Monitor VM host data
- 6 minutes
You want to monitor the VMs that host your website, so you decide to quickly create a VM in the Azure portal and evaluate its built-in monitoring capabilities. In this unit, you use the Azure portal to create a Linux VM with recommended alerts and boot diagnostics enabled. As soon as the VM starts up, Azure automatically begins collecting basic metrics and activity logs. You can then view built-in metrics graphs, activity logs, and boot diagnostics.
Create a VM and enable recommended alerts
Sign in to the Azure portal, and in the Search field, enter virtual machines.
On the Virtual machines page, select Create, and then select Azure virtual machine.
On the Basics tab of the Create a virtual machine page:
- In the Subscription field, select the correct subscription if not already selected.
- Under Resource group:
- Select Create new.
- Under Name, enter learn-monitor-vm-rg.
- Select OK.
- For Virtual machine name, enter monitored-linux-vm.
- For Image, select Ubuntu Server 20.04 LTS - x64 Gen2.
Leave the other settings at their current values, and select the Monitoring tab.

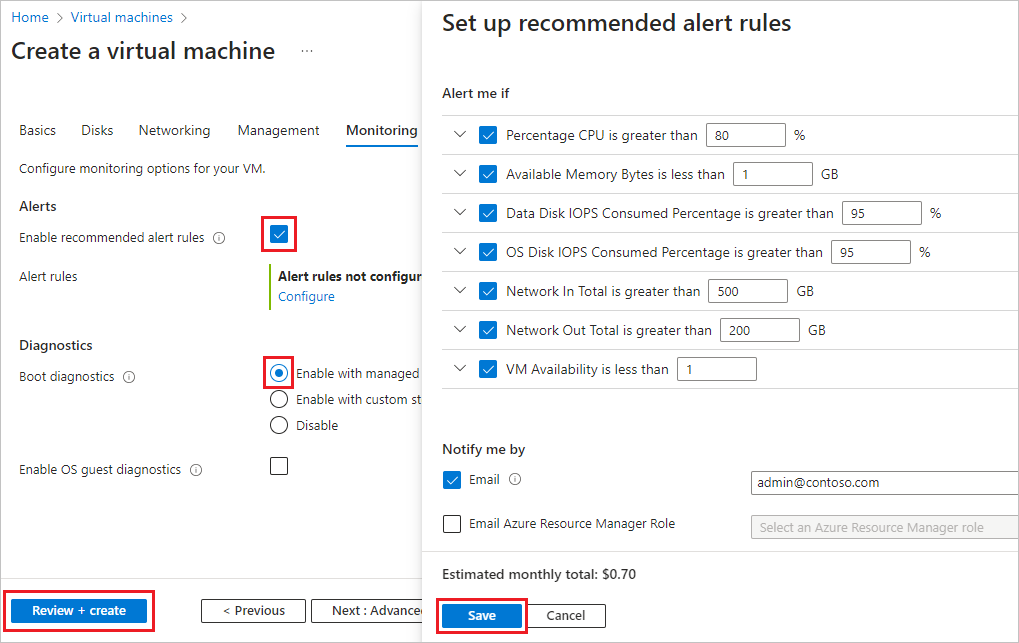
On the Monitoring tab, select the checkbox next to Enable recommended alert rules.
On the Set up recommended alert rules screen:
- Select all the listed alert rules if not already selected, and adjust the values if desired.
- Under Notify me by, select the checkbox next to Email, and enter an email address to receive alert notifications.
- Select Save.
Under Diagnostics, for Boot diagnostics, ensure that Enable with managed storage account (recommended) is selected.
Note
Don't select Enable OS guest diagnostics. The Linux Diagnostics Agent (LAD) is deprecated, and you can enable OS guest and client monitoring later.
Select Review + create at the bottom of the page, and when validation passes, select Create.
On the Generate new key pair popup dialog box, select Download private key and create resource.


It can take a few minutes to create the VM. When you get the notification that the VM is created, select Go to resource to see basic metrics data.
View built-in metrics graphs
Once your VM is created, Azure starts collecting basic metrics data automatically. Built-in metrics graphs, along with the recommended alerts you enabled, can help you monitor whether and when your VM encounters health or performance issues. You can then use more advanced monitoring and analytics capabilities to investigate issue causes and remediation.
To view basic metrics graphs, on the VMs Overview page, select the Monitoring tab.

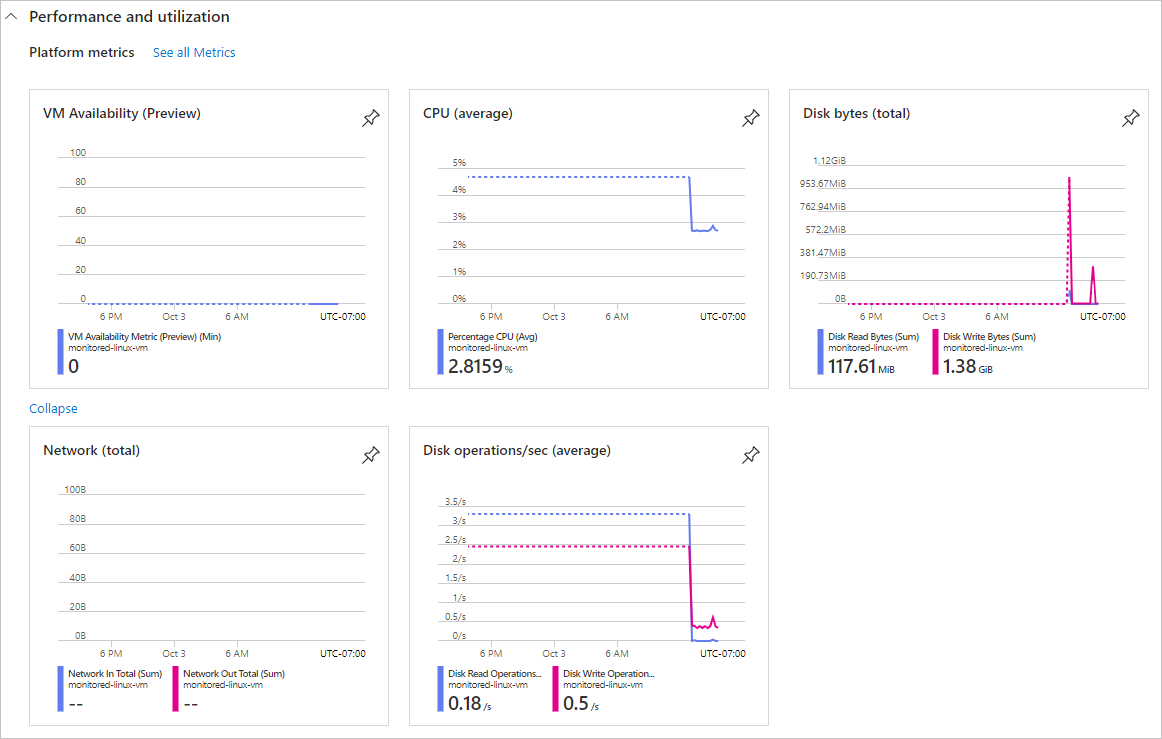
Under Performance and utilization > Platform metrics, review the following metrics graphs related to the VMs performance and utilization. Select Show more metrics if all the graphs don't appear immediately.
- VM Availability
- CPU (average)
- Disk bytes (total)
- Network (total)
- Disk operations/sec (average)
Under Guest OS metrics, notice that guest OS metrics aren't being collected yet. In the next units, you configure VM insights and data collection rules to collect guest OS metrics.


View the activity log
You can view the VMs activity log by selecting Activity log from the VMs left navigation menu. You can also retrieve entries by using PowerShell or the Azure CLI.

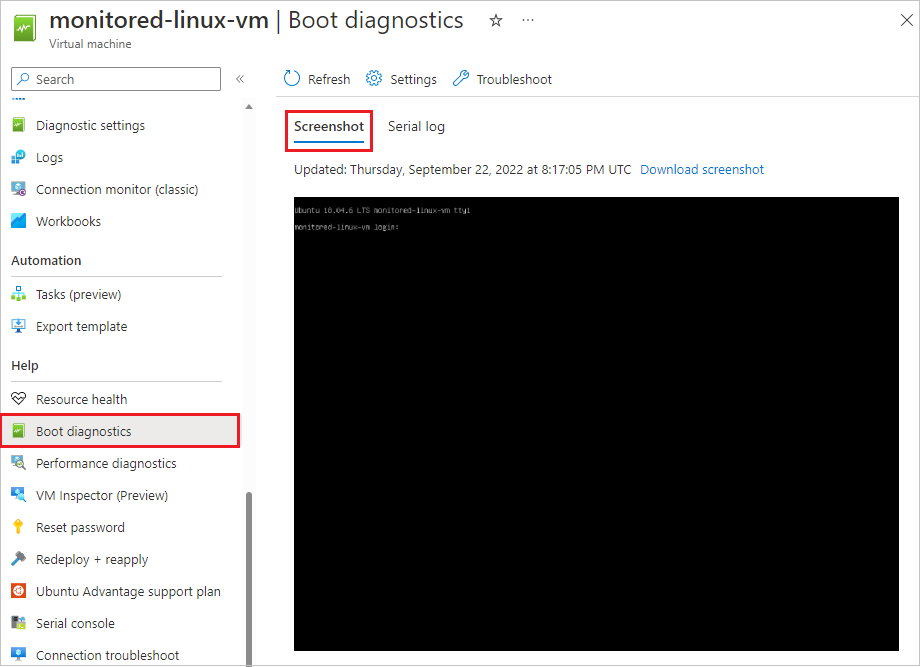
View boot diagnostics
You enabled boot diagnostics when you created the VM. You can view boot diagnostics to view boot data and troubleshoot startup issues.
In the left navigation menu for the VM, select Boot diagnostics under Help.
On the Boot diagnostics page, select Screenshot to see a startup screenshot from the VMs hypervisor. Select Serial log to view log messages created when the VM started.