Exercise - Enabling storage metrics and view metric data
In this exercise, we'll use Azure portal and PowerShell to configure storage metrics for our storage account. We'll upload some files to Blob Storage, and then look at metrics in Metrics Explorer.
Create a storage account
Select this link to sign in to the Azure portal by using the same account with which you activated the sandbox.
In the Azure portal, select Create a resource.
In the Search services and Marketplace box, search for and select Storage account.
The Storage account panel appears.
Select Create.
The Create storage account panel appears.
On the Basics tab, fill in the following values for each setting.
Setting Value Project details Subscription Concierge Subscription Resource group [Sandbox resource group] Instance details Storage account name <your-storage-account-name>, which is 3 to 24 characters and consists of only lowercase letters and numbers; for example, monitorstorageaccount Region Use the default region Performance Standard Redundancy Geo-redundant storage (GRS) Select the Advanced tab. In the Blob storage section, make sure that access tier is set to Hot.
Select Review. After validation passes, select Create.
On the Your deployment is complete panel, select Go to resource.
Add a blob container
Before you can add blobs to a storage account, you need to create a blob container.
Under Data storage, select Containers.
In the Containers panel, select + Container.
In the Name field, enter monitor-blobs-container, then select Create.
Upload files to the blob container
To upload a single file to the blob container:
Open the monitor-blobs-container container, then select Upload.
Select the Browse for files link.
In the Open dialog box, select a small text file from your local file system, and select Open.
Select Upload.
Wait for one minute, and then repeat these steps to upload a different file.
Wait for another minute, and then repeat these steps to upload another file.
Wait for several more minutes before continuing with the next section.
Visualize metrics in the Azure portal
Transaction metrics are emitted on every request to a storage account, so you should see changes in these values relatively quickly. To create a transaction metrics chart, complete the following steps:
In the Azure portal, navigate to the page for your storage account.
In the menu pane, under Monitoring, select Metrics.
In the top right, select Last hour for the time range.
Under Time granularity, select Automatic, then select Apply.
On the bar that appears beneath the chart title, select Line chart, and then Bar chart.
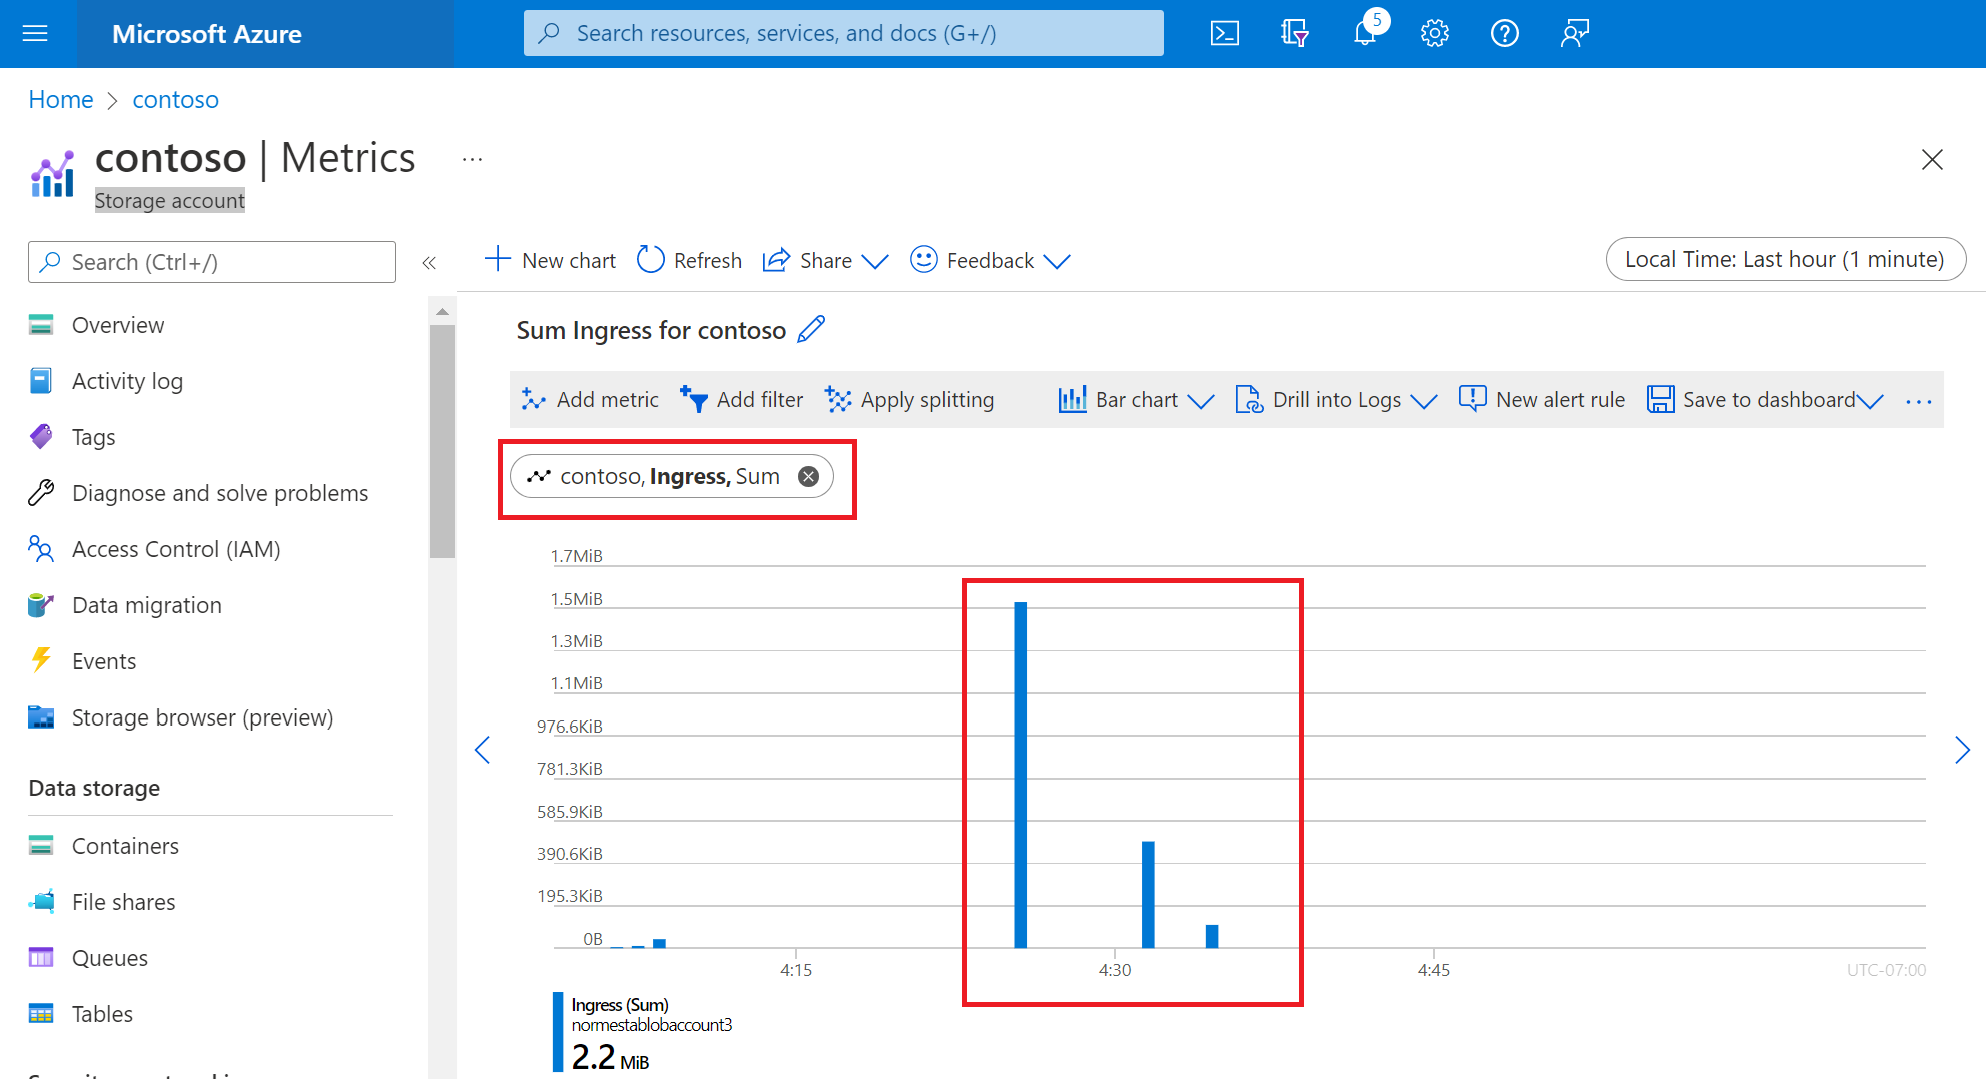
Change the metric namespace to Blob and select Ingress for the metric.
The following image shows a bar for every file upload operation in the last hour.
Split a metric
Splitting a metric lets you view additional dimensions in the data. For each file that you uploaded, the Azure portal made several API calls. Each request resulted in bytes transferred. You can split the ingress metric by the API dimension to see the breakdown of bytes transferred by API call. To split a metric, complete the following steps:
Select Apply splitting
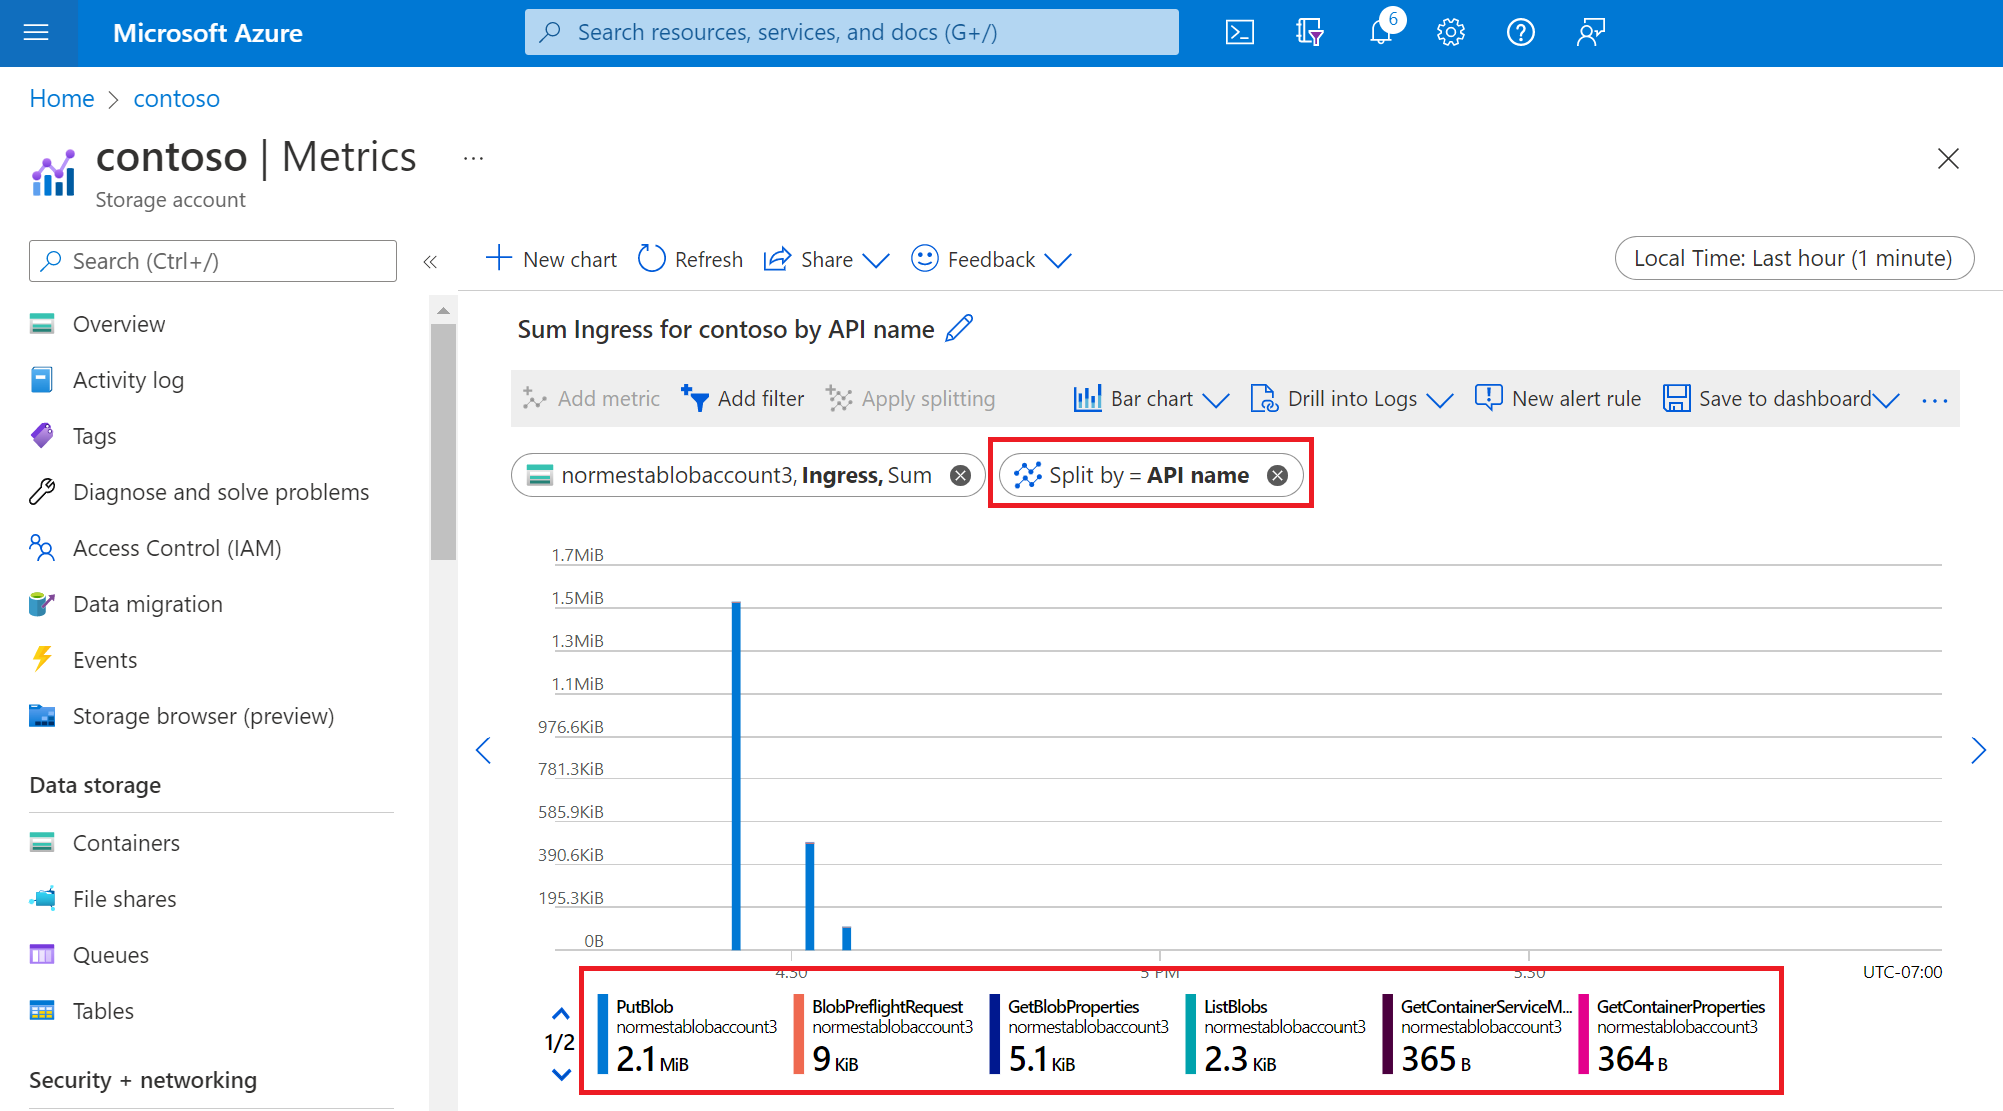
In the Splitting oval, from the drop-down list, select API name.
View the output in the chart window. The following image shows bytes transferred by API call.
Add a filter
Filtering lets you look at the metrics with greater granularity. You can use a filter to look only at specific API calls used for your upload operation. In this case, we're interested only in bytes related to the file transfer. We want to exclude traffic related to other API calls used to complete the transfer.
Select Add filter.
Under Property, select API name.
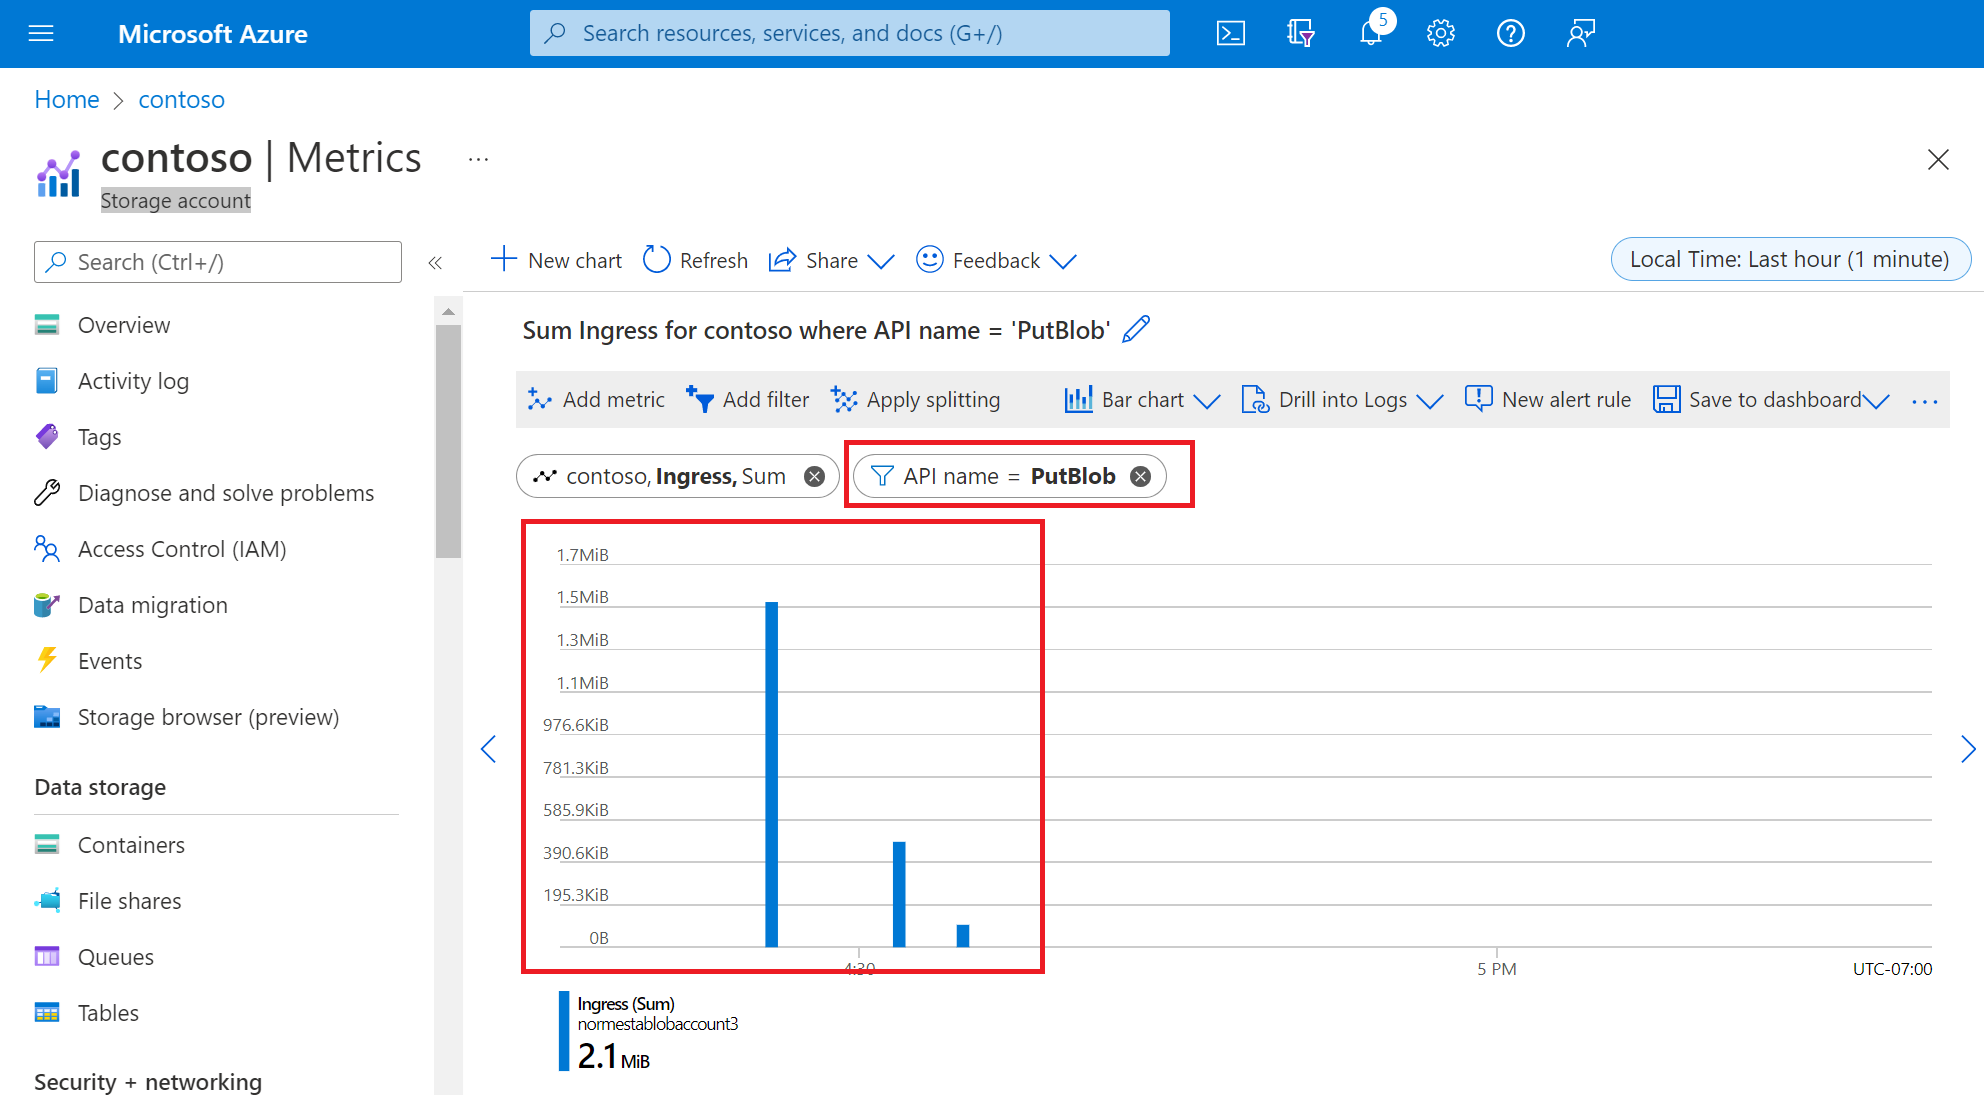
Under Values, select PutBlob.
The chart shows bars that represent the REST call to the Put Blob API.
Select the X to the right of the filter oval to remove the filter.