Monitoring the entire solution
In this unit, we look at monitoring the entire solution.
Introduction
Enabling monitoring across today's complex computing environments requires collecting operational data from every layer and component of a distributed system. You need deep insights on this data, and to combine it with different perspectives to support the multitude of stakeholders in your organization.
Azure Monitor collects data from different kinds of sources, where you can use it for analysis, visualization, and alerting. It gives you deep insights across all your monitored resources and even with data from other services that store their data in Azure Monitor.
Log analytics
Logs are events that occurred within the system. Logs can contain different kinds of data, and might be structured or free-form text with a timestamp. Logs might be created sporadically as events in the environment generate log entries. A system under heavy load typically generates more log volume.
Logs in Azure Monitor are valuable for identifying the root causes of issues. Data that Azure Monitor Logs collects is stored in one or more Log Analytics workspaces. Data is retrieved from a Log Analytics workspace using a log query, which is a read-only request to process data and return results. Log queries are written in Kusto Query Language (KQL), which is the same query language Azure Data Explorer uses.
Note
Your Azure Spring Apps sample application has already been set up with a Log Analytics workspace. For more information on KQL syntax, see the Summary unit at the end of this training.
Use Log Analytics
There are actually three ways to access your application's logs: Azure Storage, Azure Events Hub, and Log Analytics. We'll focus here on Log Analytics because it's the most common one and is integrated into Azure Spring Apps for metrics monitoring.
Important
The Log data ingestion time in Azure Monitor can take up to 15 minutes. If data isn't found in Log Analytics, it might take additional time to ingest Azure Spring Apps log data.
Open the Azure portal.
Select Azure Spring Apps from the list of Azure services.
Select your Azure Spring Apps instance.
Next, under the Monitoring section, select Logs.
In the Query search box:
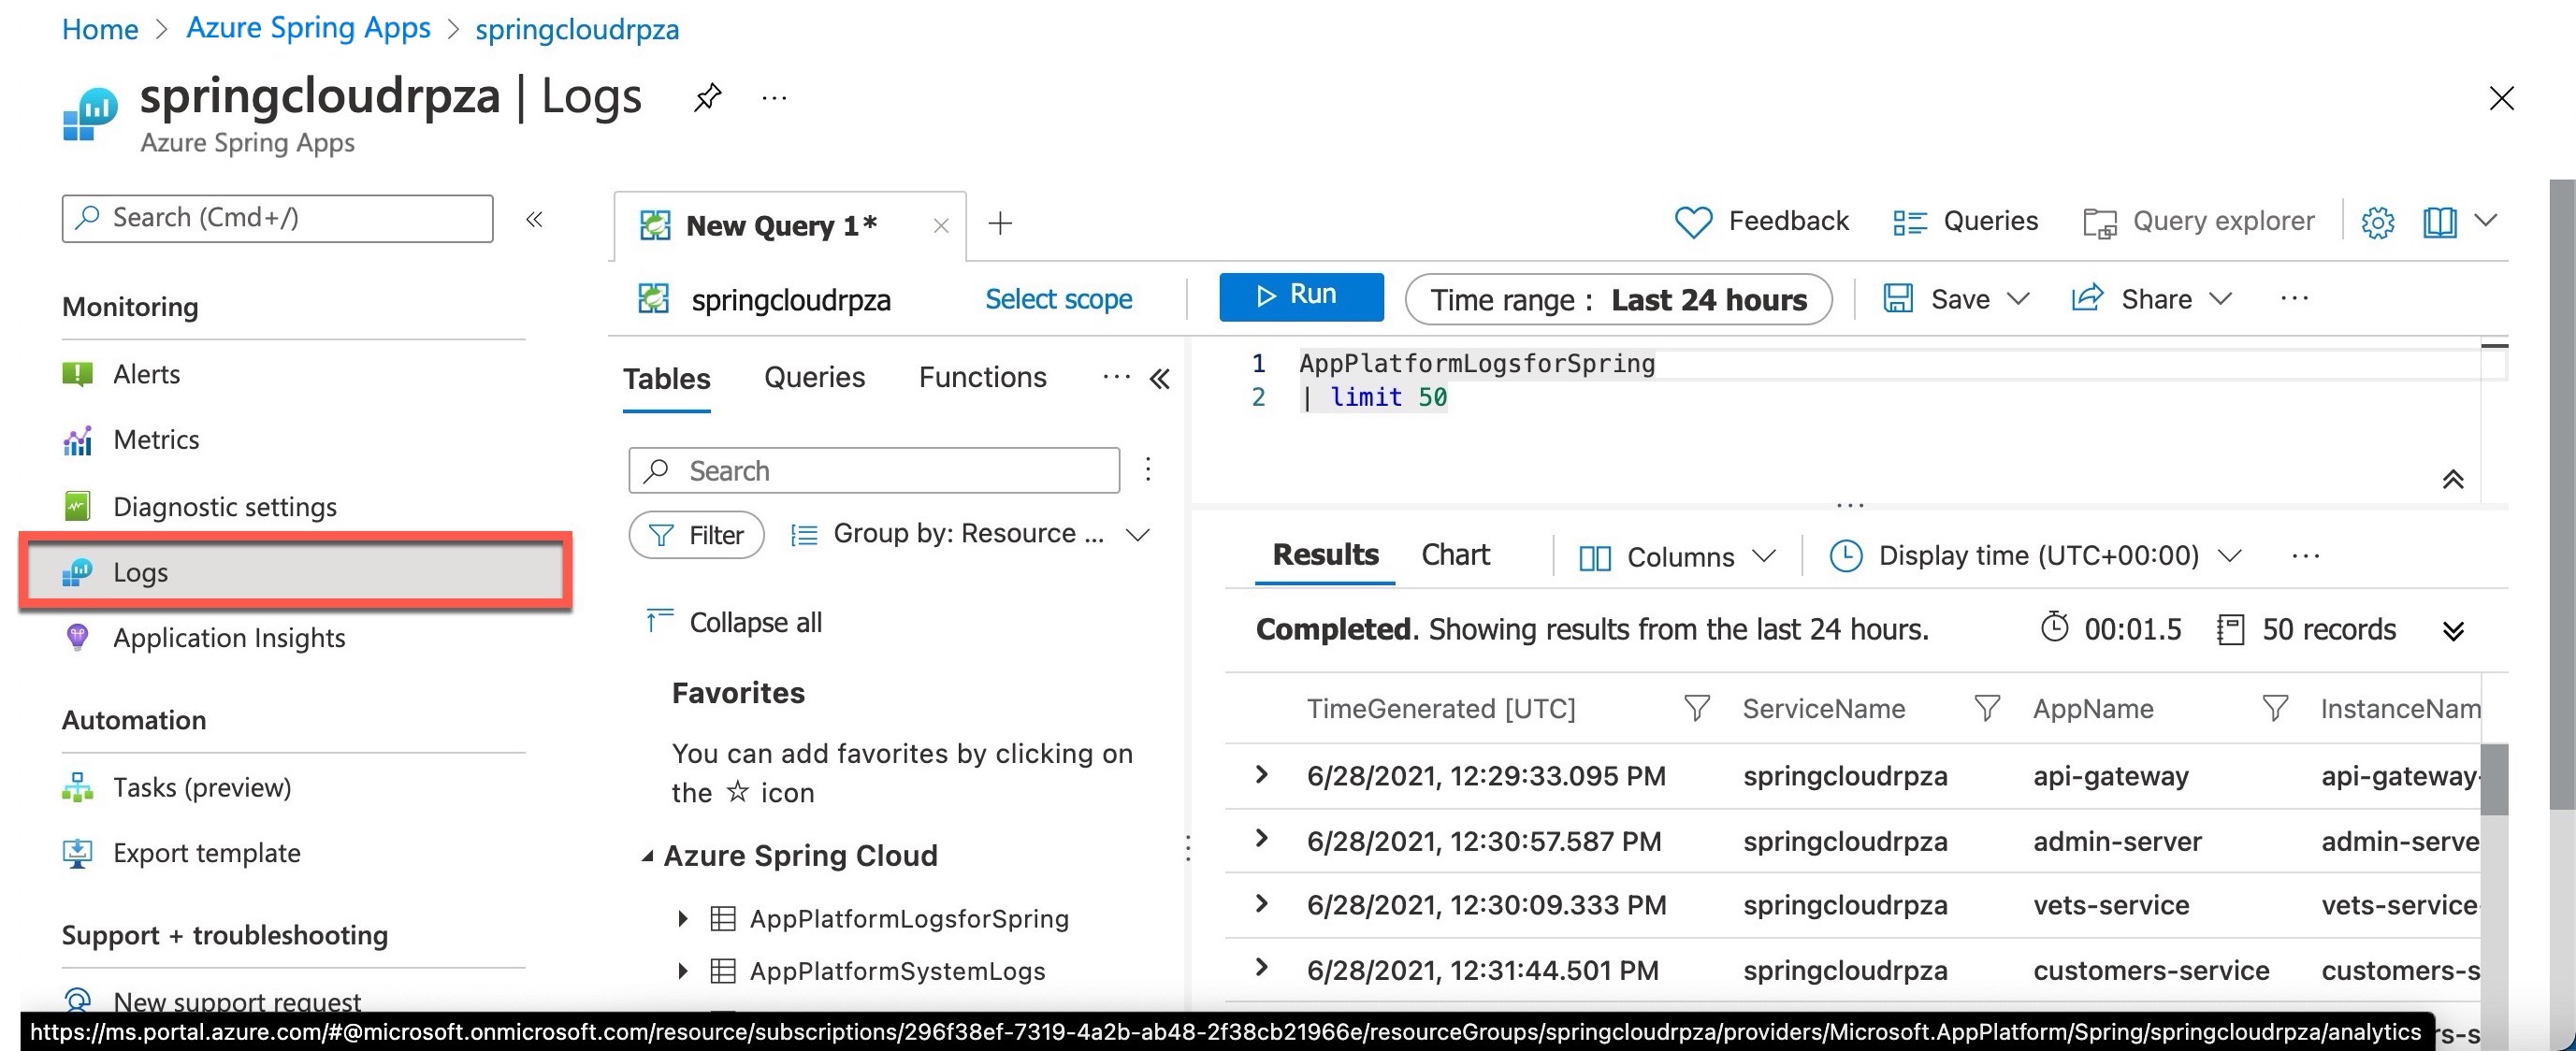
To view logs, run a query such as:
AppPlatformLogsforSpring
| limit 50
To view metrics, enter a query such as:
AzureMetrics
| limit 50
You can search the logs of the specific application or instance by setting a filter condition:
AppPlatformLogsforSpring
| where ServiceName == "YourServiceName" and AppName == "YourAppName" and InstanceName == "YourInstanceName"
| limit 50

Analyze the Application logs
Application logs provide critical information and verbose logs about your application's health, performance, and more. In the next section, we provide queries to help you understand your application's current and past states.
Show application logs from Azure Spring Apps
Open the Azure portal.
Select Azure Spring Apps from the list of Azure services.
Select your Azure Spring Apps instance.
Next, under the Monitoring section, select Logs.
In the Query search box:
To review a list of application logs from Azure Spring Apps, sorted by time with the most recent logs shown first, run the following query:
AppPlatformLogsforSpring
| project TimeGenerated , ServiceName , AppName , InstanceName , Log
| sort by TimeGenerated desc
To review unsorted log entries that mention an error or exception, run the following query:
AppPlatformLogsforSpring
| project TimeGenerated , ServiceName , AppName , InstanceName , Log
| where Log contains "error" or Log contains "exception"
To create a pie chart that displays the number of errors and exceptions logged by your application, run the following query:
AppPlatformLogsforSpring
| where TimeGenerated > ago(1h)
| where Log contains "error" or Log contains "exception"
| summarize count_per_app = count() by AppName
| sort by count_per_app desc
| render piechart
Database Monitoring
Monitoring data about your servers helps you troubleshoot and optimize for your workload. Azure Database for MySQL provides various metrics that give insight into the behavior of your server.
In Azure Database for MySQL, the slow query log is available to users. Access to the transaction log isn't supported. You can use the slow query log to identify performance bottlenecks for troubleshooting.
In our sample application, your slow query logs are set up to be piped to Azure Monitor Logs through Diagnostic Logs, and you can do further analysis of your slow queries. Following are sample queries to help you get started/
Important
The MySQL Log data ingestion time in Azure Monitor can take up to 30 minutes. If data is not found in Log Analytics, it may take additional time to ingest MySQL log data.
Sign in to the Azure portal.
Select your Azure Database for MySQL server you use for your Azure Spring Apps.
Next, under the Monitoring section, select Logs.
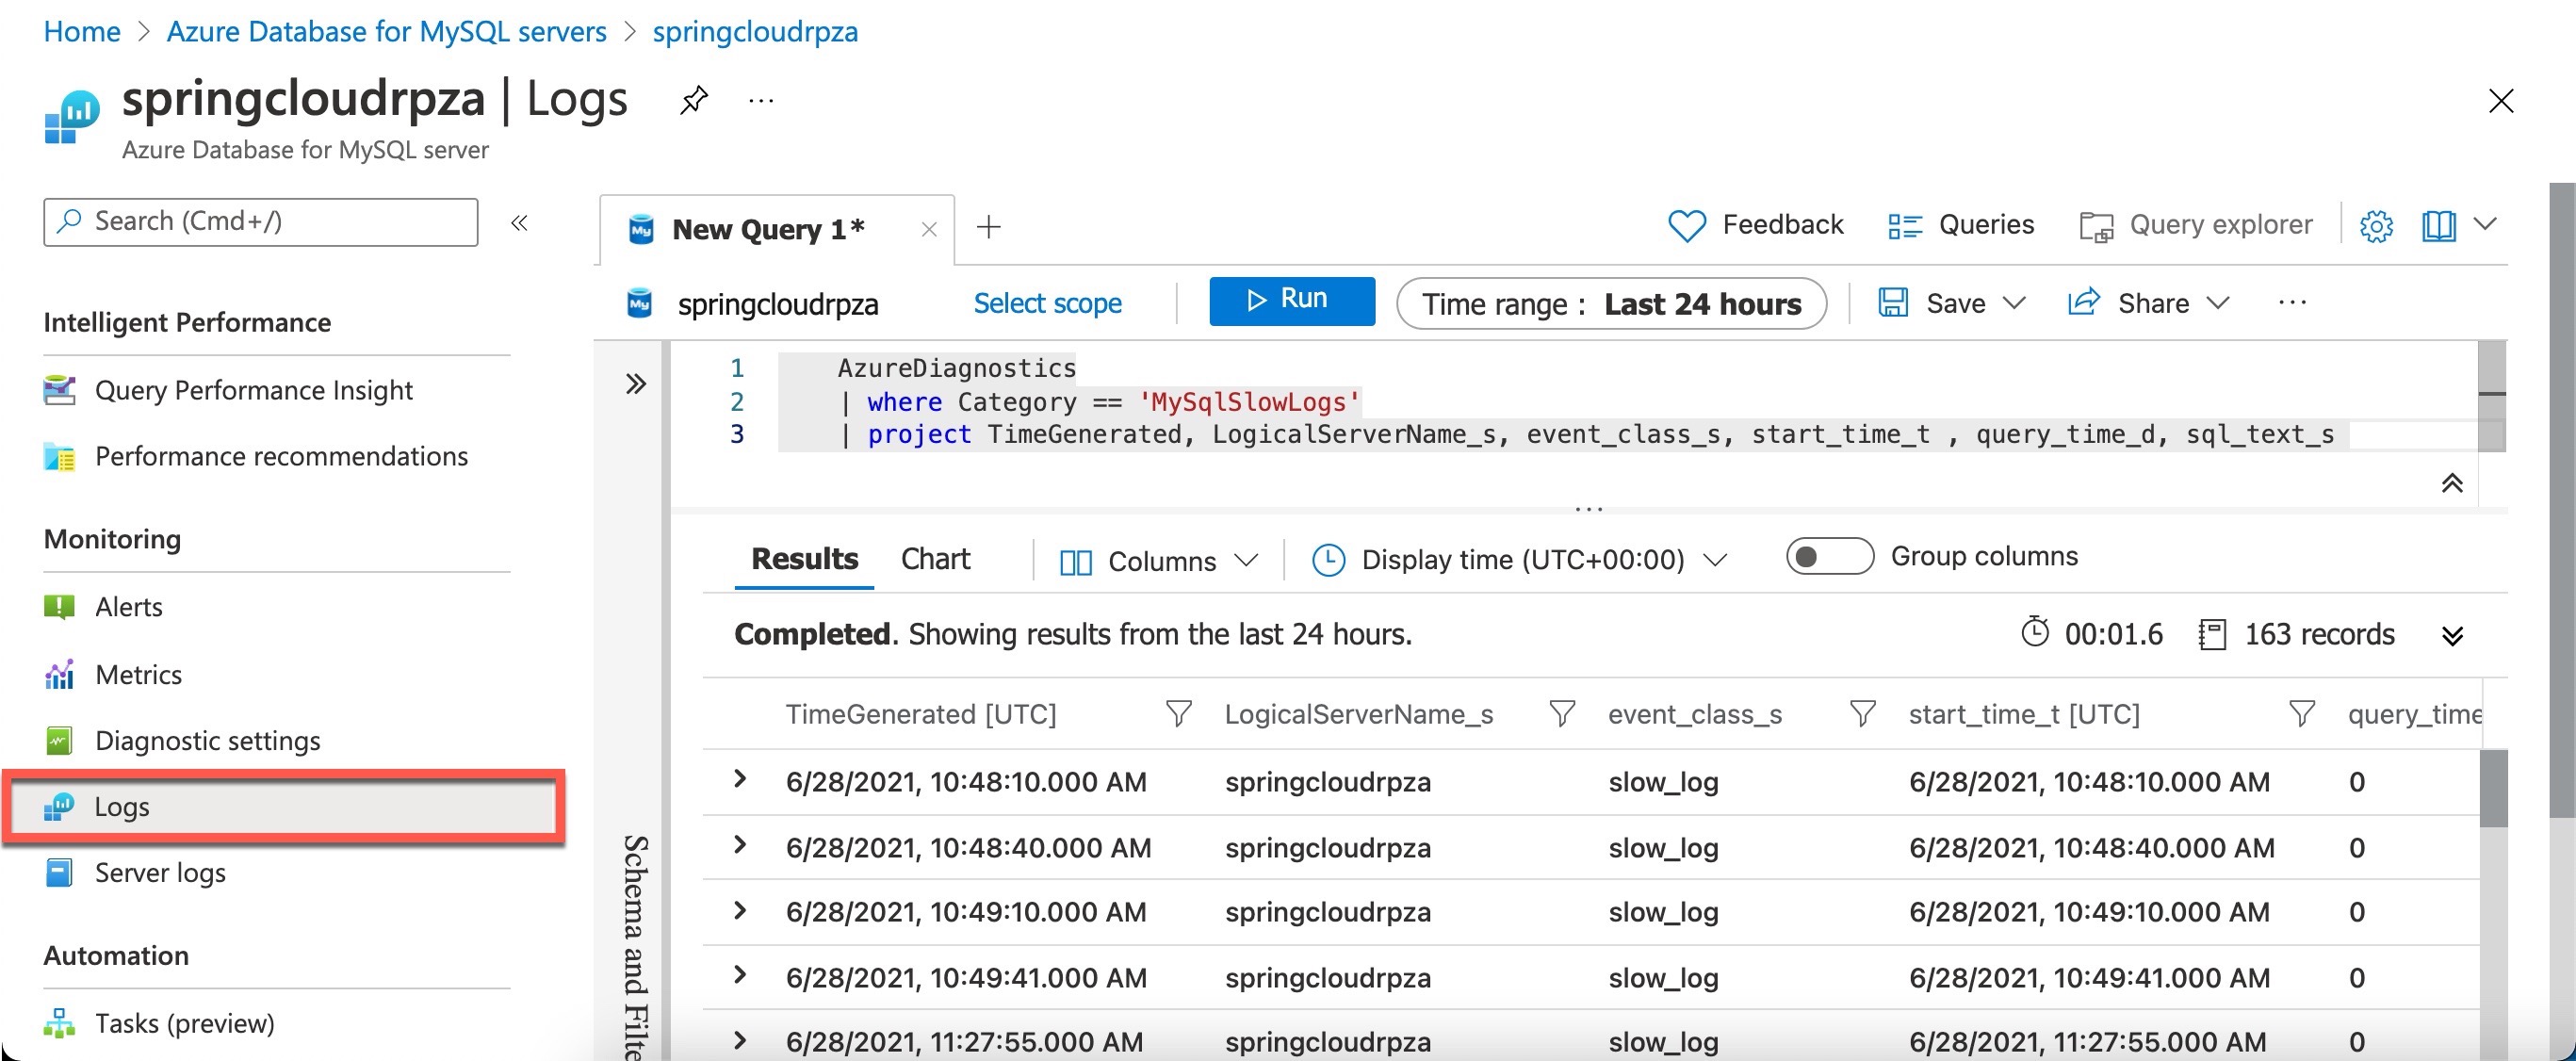
In the Query search box:
To retrieve all Queries longer than one second, run the following query:
AzureDiagnostics
| where Category == 'MySqlSlowLogs'
| project TimeGenerated, LogicalServerName_s, event_class_s, start_time_t , query_time_d, sql_text_s
To list the top five longest queries, run the following query:
AzureDiagnostics
| where Category == 'MySqlSlowLogs'
| project TimeGenerated, LogicalServerName_s, event_class_s, start_time_t , query_time_d, sql_text_s
| order by query_time_d desc
| take 5
To summarize slow queries by minimum, maximum, average, and standard deviation query time, run the following query:
AzureDiagnostics
| where Category == 'MySqlSlowLogs'
| project TimeGenerated, LogicalServerName_s, event_class_s, start_time_t , query_time_d, sql_text_s
| summarize count(), min(query_time_d), max(query_time_d), avg(query_time_d), stdev(query_time_d), percentile(query_time_d, 95) by LogicalServerName_s
To graph the slow query distribution on a particular server, run the following query:
AzureDiagnostics
| where Category == 'MySqlSlowLogs'
| project TimeGenerated, LogicalServerName_s, event_class_s, start_time_t , query_time_d, sql_text_s
| summarize count() by LogicalServerName_s, bin(TimeGenerated, 5m)
| render timechart
You can also use the audit log to track database-level activity. It's commonly used for compliance. Audit logs are integrated with Azure Monitor Diagnostic Logs. In your sample, we've enabled audit logs on your MySQL server so you can do further analysis of your audited events.
Here's a sample query that retrieves the general MySQL log:
AzureDiagnostics
| where Category == 'MySqlAuditLogs' and event_class_s == "general_log"
| project TimeGenerated, LogicalServerName_s, event_class_s, event_subclass_s, event_time_t, user_s , ip_s , sql_text_s
| order by TimeGenerated desc

UI monitoring
If you add Application Insights to your page script, you get timings of page loads and AJAX calls, counts, and details of browser exceptions and AJAX failures, also users and session counts. You can segment all of these metrics by page, client OS and browser version, geo-location, and other dimensions. You can set alerts on failure counts or slow page loading, and by inserting trace calls in your JavaScript code, you can track how the different features of your web page application are used.
You can use Application Insights with any web page; you just add a short piece of JavaScript. If your web service is Java, you can use the server-side SDKs with the client-side JavaScript SDK to get an understanding of your app's performance.
Note
For more information on UI monitoring, see the Summary unit at the end of this training.