Optimize capacity and performance
Use the Performance Diagnostics tool to identify and troubleshoot performance issues on your Azure virtual machine (VM) in one of two modes:
- Continuous diagnostics (preview) collects data at five-second intervals and reports actionable insights about high resource usage every five minutes.
- On-demand diagnostics helps you troubleshoot an ongoing performance issue with more in-depth data, insights, and recommendations based on data collected at a single point in time.
Performance Diagnostics stores all insights and reports in a storage account, which you can configure for short data retention to minimize costs.
Run Performance Diagnostics directly from the Azure portal, where you can also review insights and a report on various logs, rich configuration, and diagnostics data. We recommend that you run Performance Diagnostics and review the insights and diagnostics data before you contact Microsoft Support.
This unit explains how to use Performance Diagnostics and what the continuous and on-demand modes offer.
The following operating systems are currently supported for both on-demand and continuous diagnostics:
- Windows Server 2022
- Windows Server 2019
- Windows Server 2016
- Windows Server 2012 R2
- Windows Server 2012
- Windows 11
- Windows 10
Install and run Performance Diagnostics on your VM
To install and run Performance Diagnostics:
In the Azure portal, select Virtual machines.
From the list of VM names, select the VM that you want to run diagnostics on.
In the Help section, select Performance Diagnostics.
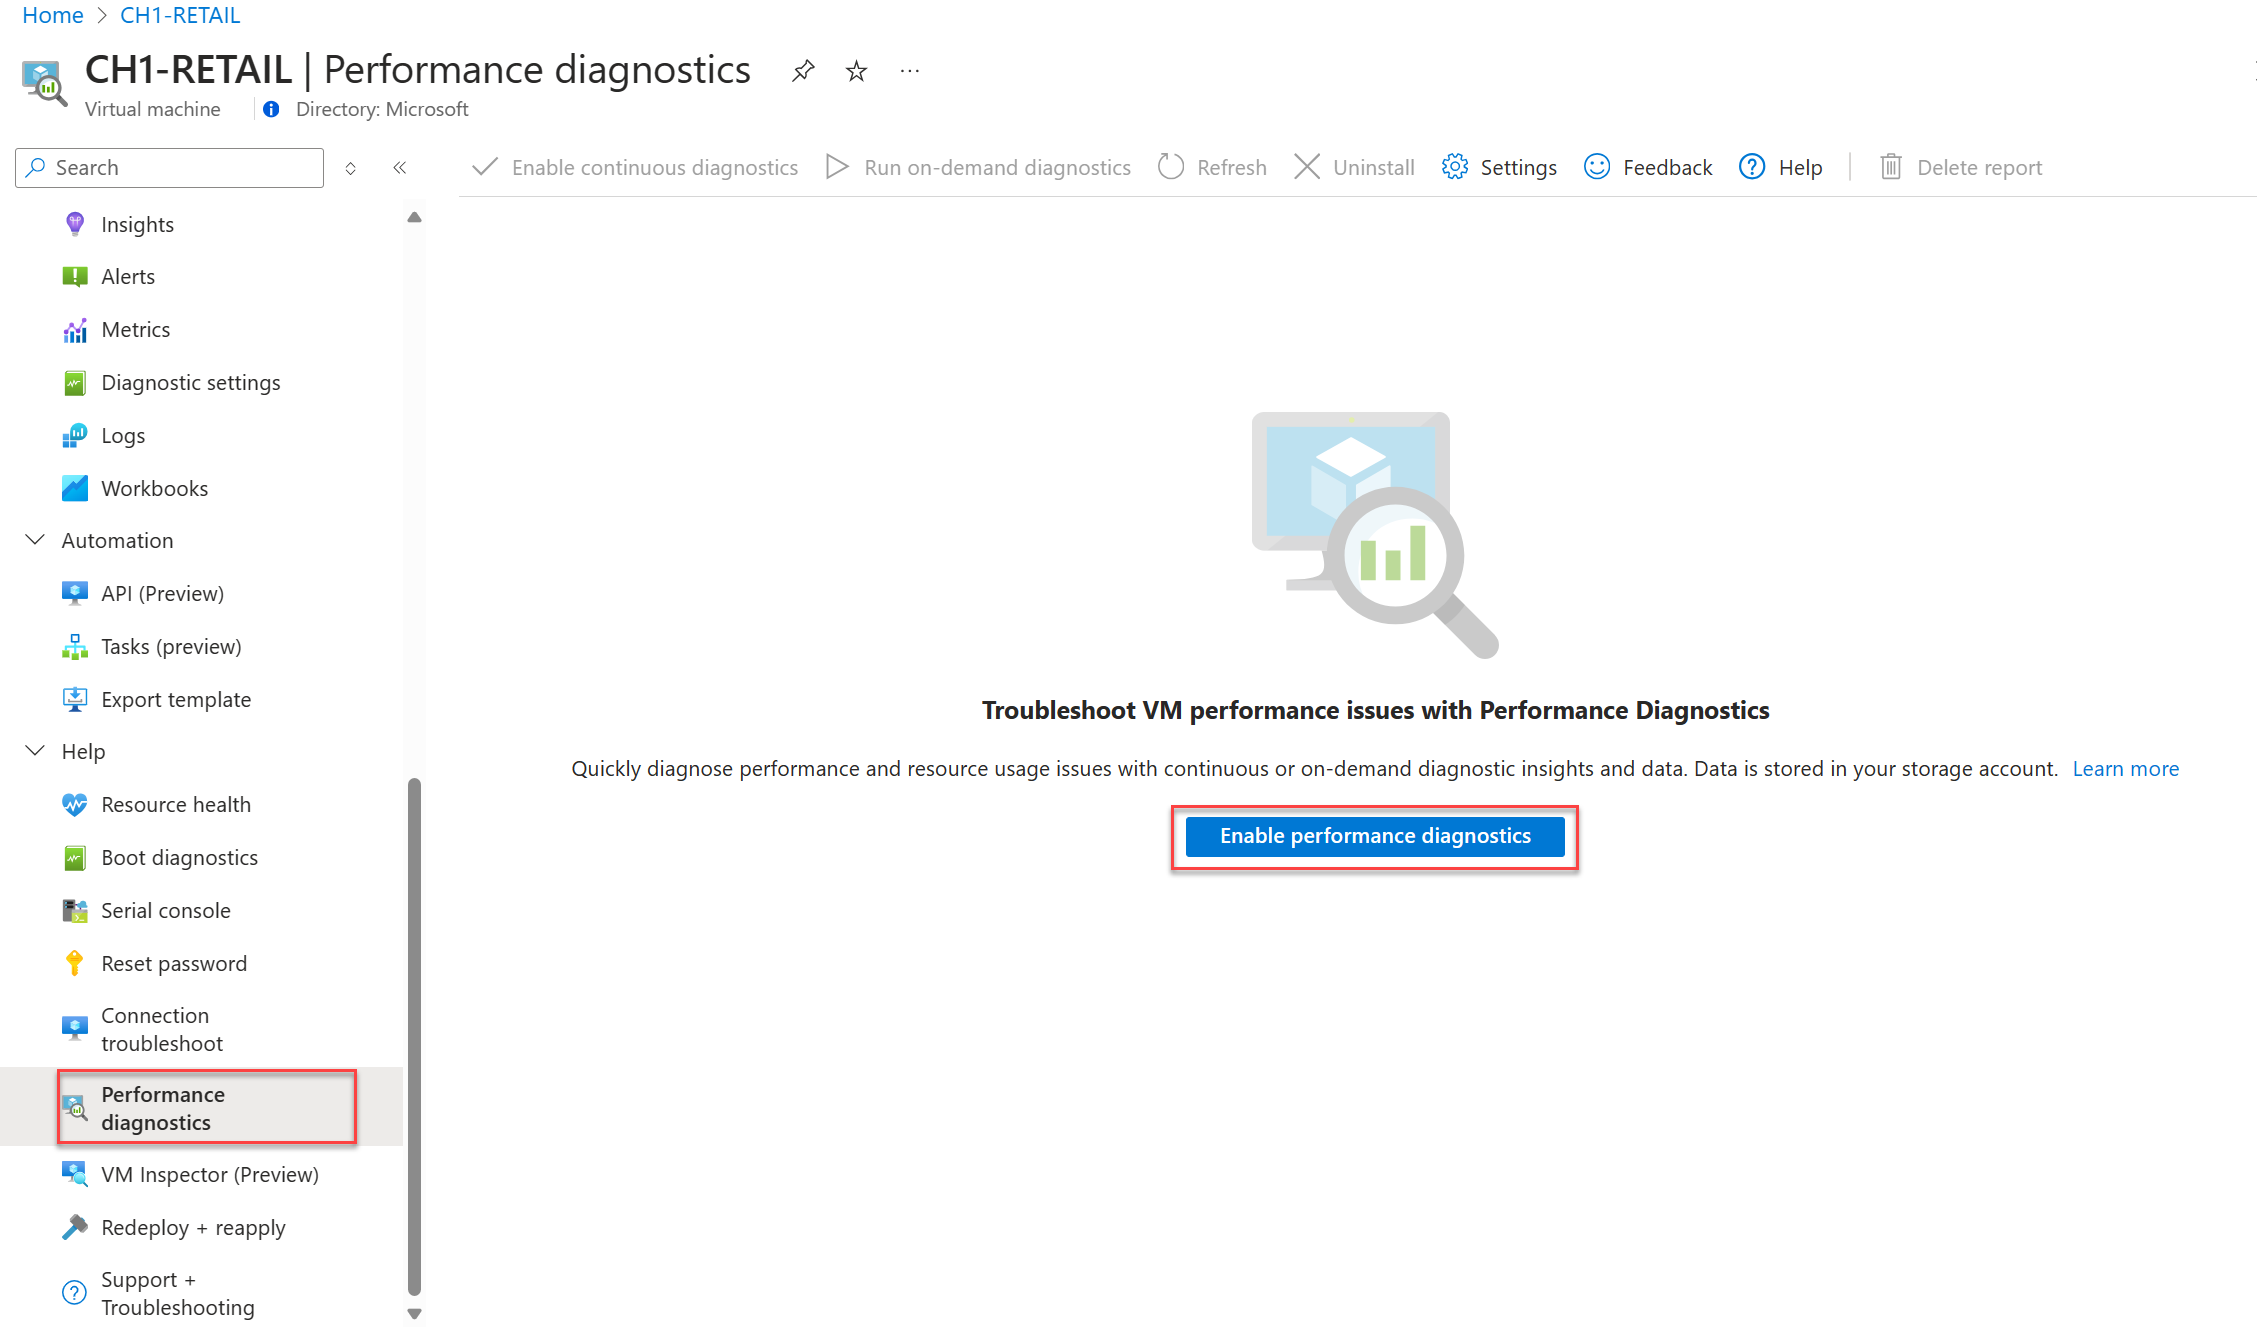
Select Enable Performance Diagnostics.
Select the options to install and run for the tool.
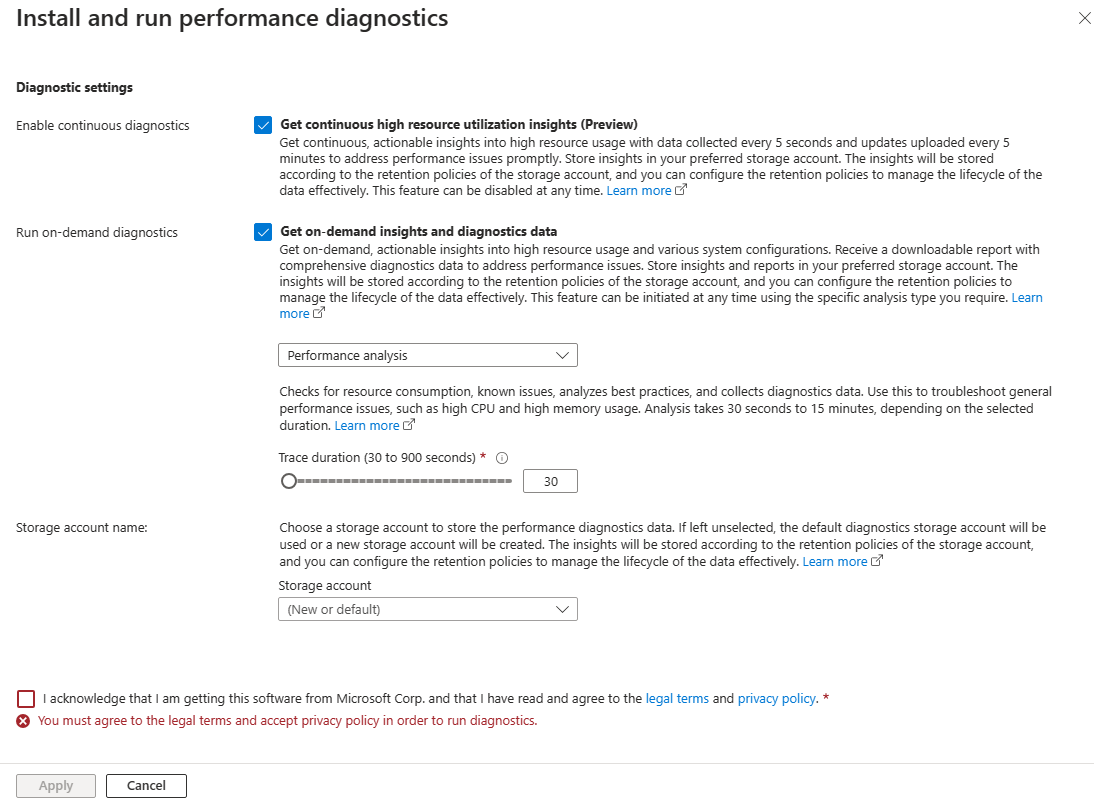
This table describes the available options. Review the legal terms and privacy policy, and select the corresponding checkbox to acknowledge (required).
Option Description Enable continuous diagnostics Get continuous, actionable insights into high resource usage with data collected every 5 seconds and updates uploaded every 5 minutes to address performance issues promptly. Store insights in your preferred storage account. Run on-demand diagnostics Get on-demand, actionable insights into high resource usage and various system configurations. Receive a downloadable report with comprehensive diagnostics data to address performance issues. Store insights and reports in your preferred storage account. Storage account Optionally, if you want to use a single storage account to store the Performance Diagnostics results for multiple VMs, you can select a storage account from the dropdown. If you don't specify a storage account, Performance Diagnostics uses the default diagnostics storage account or creates a new storage account. To install and run Performance Diagnostics, you must agree to the legal terms and accept the privacy policy.
Select Apply to apply the selected options and install the tool. A notification is displayed as Performance Diagnostics starts to install. After the installation is completed, you see a notification that indicates that the installation is successful. If the Run on-demand diagnostics option is selected, the selected performance analysis scenario is then run for the specified duration.
View insights and reports
This table compares the data provided by Continuous and On-demand Performance Diagnostics.
| Continuous Performance Diagnostics | On-demand Performance Diagnostics | |
|---|---|---|
| Availability | Currently supported only for Windows VMs | Supported for both Windows and Linux VMs |
| Insights generated | Continuous actionable insights into high resource usage, such as high CPU, high memory, and high disk usage | On-demand actionable insights into high resource usage and various system configurations |
| Data collection frequency | Collects data every 5 seconds, updates uploaded every 5 minutes | Collect data on demand for the selected duration of the on-demand run |
| Reports generated | Doesn't generate a report | Generates a report with comprehensive diagnostics data |