Exercise - Set up a dashboard and add a report
In this exercise, you set up a dashboard for the security team, so they can see the potential of Azure logs and alerts in monitoring user behavior. You'll do these tasks:
- Create a security dashboard.
- Build a query for the dashboard.
- Pin query results to your dashboard.
- Edit or customize an item in your dashboard.
- Export a report to Excel.
Note
This exercise is optional. If you don't have an Azure account, you can read through the following instructions to understand how to use your Log Analytics workspace and dashboards.
If you want to complete this exercise but you don't have an Azure subscription or prefer not to use your own account, you can create a free account before you begin.
Create a security dashboard
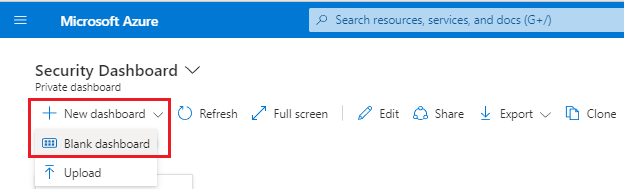
In the Azure portal, search for Dashboard.
Select New dashboard > Blank dashboard.
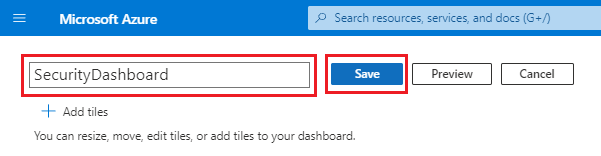
Name the dashboard SecurityDashboard, and then select Save. For now, leave the dashboard blank. In the next few steps, you'll add a report query to the dashboard.
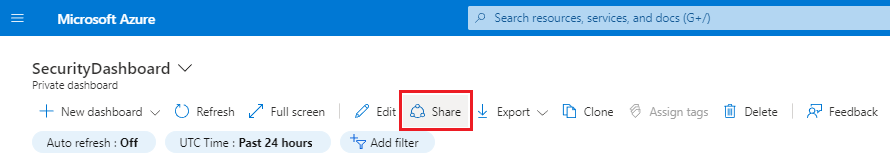
Select Share.
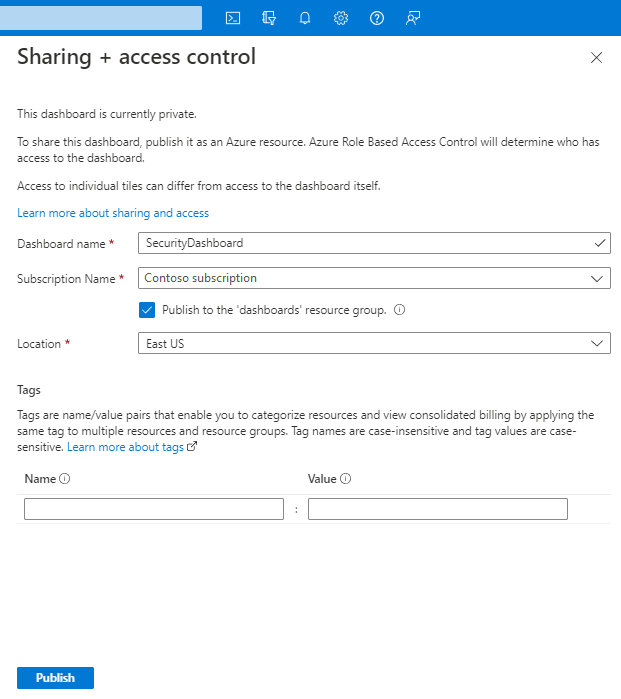
In the Sharing + access control pane, confirm that the information is correct:
- The dashboard name is SecurityDashboard.
- For the subscription name, keep the default value.
- The Publish to the 'dashboards' resource group check box is cleared.
Select Publish to make the empty dashboard available.
Build a query for the dashboard
To build a query for a dashboard:
In the Azure portal, select All resources.
Select the Log Analytics workspace you created earlier.
Under General, select Logs.
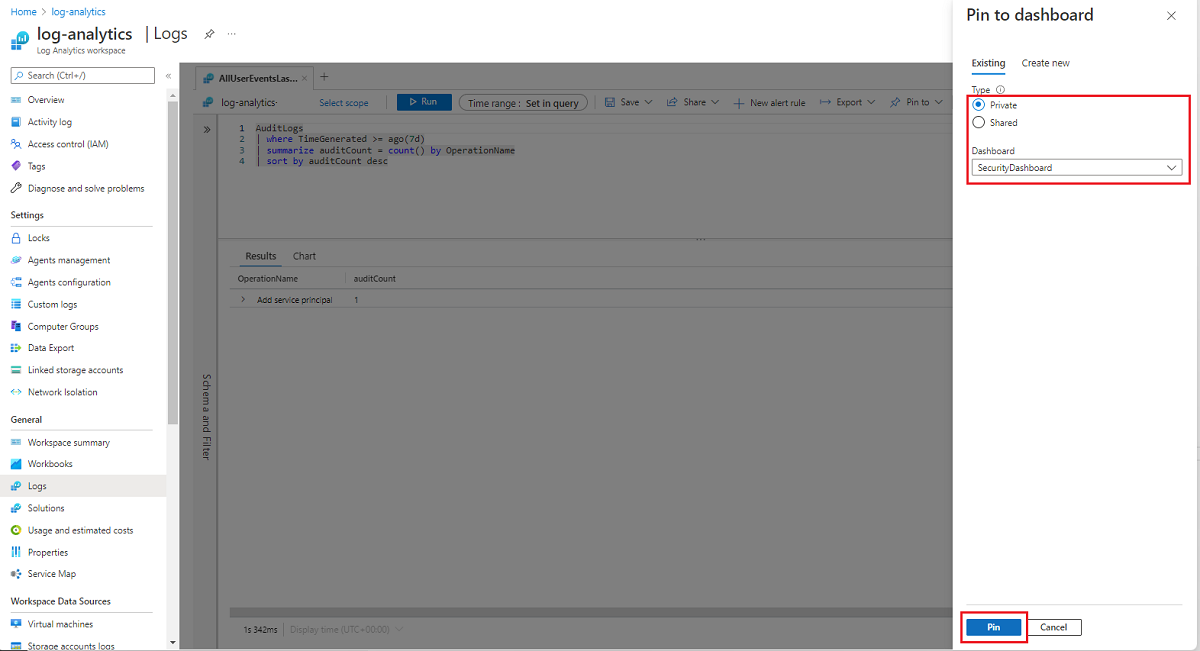
For this exercise, you want to know the most common user event for last week. In your query editor, paste the following query:
AuditLogs
| where TimeGenerated >= ago(7d)
| summarize auditCount = count() by OperationName
| sort by auditCount desc
In the menu bar, select Run to ensure that the query returns data.
When you're satisfied that you have the data you want, select Done editing, and then select the Save icon in the menu bar.
Enter a descriptive name, like Common User Events Last 7 days.
Select or enter the subscription, resource group, and location you want to use.
Select Save.
Pin query results to your dashboard
Next, pin query results to the dashboard you created:
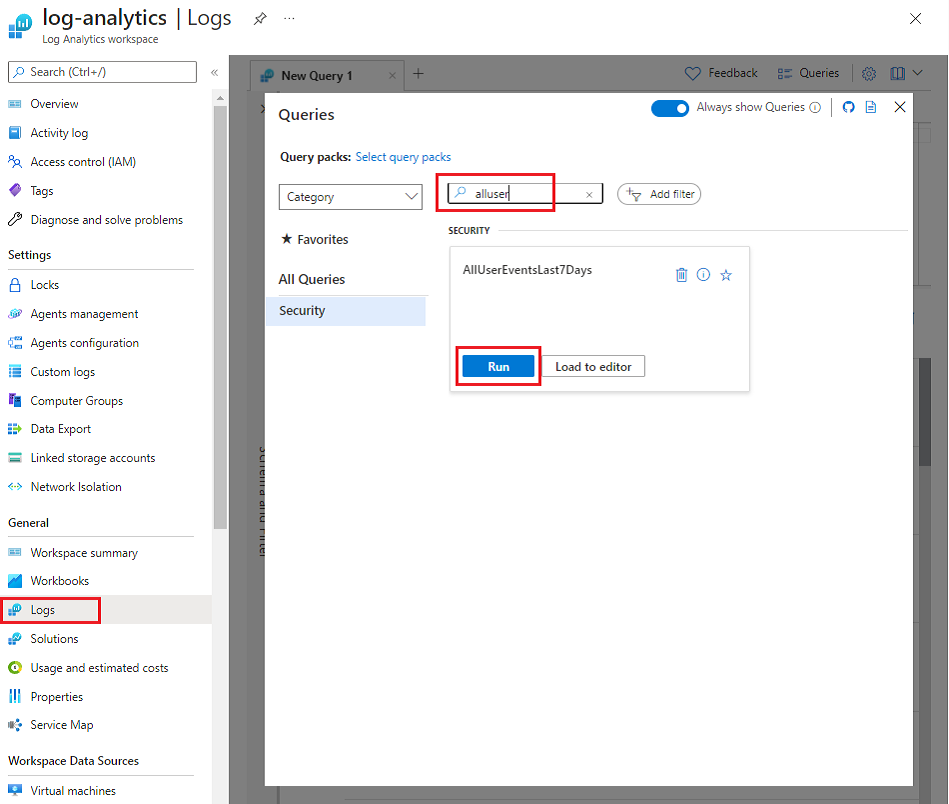
In your Log Analytics workspace, under General, select Logs.
In the Queries dialog, search for the query you created, and then select Run.
To pin query results to a dashboard, in the menu bar, select the Pin icon.
In the Pin to dashboard pane, select the options you want to use. For example, select SecurityDashboard, which you created earlier.
Select Pin.
Go to the dashboard to view your analytics results.
Edit or customize a report in your dashboard
To change the title of an item in a dashboard or change the dashboard view:
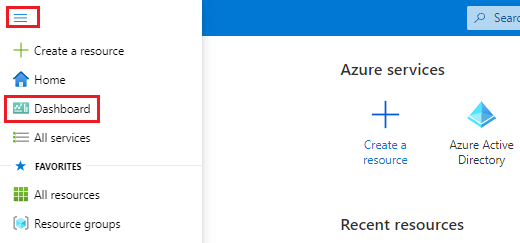
In the Azure portal menu, select Dashboard.
If you have multiple dashboards, in the dashboard dropdown menu, select SecurityDashboard.
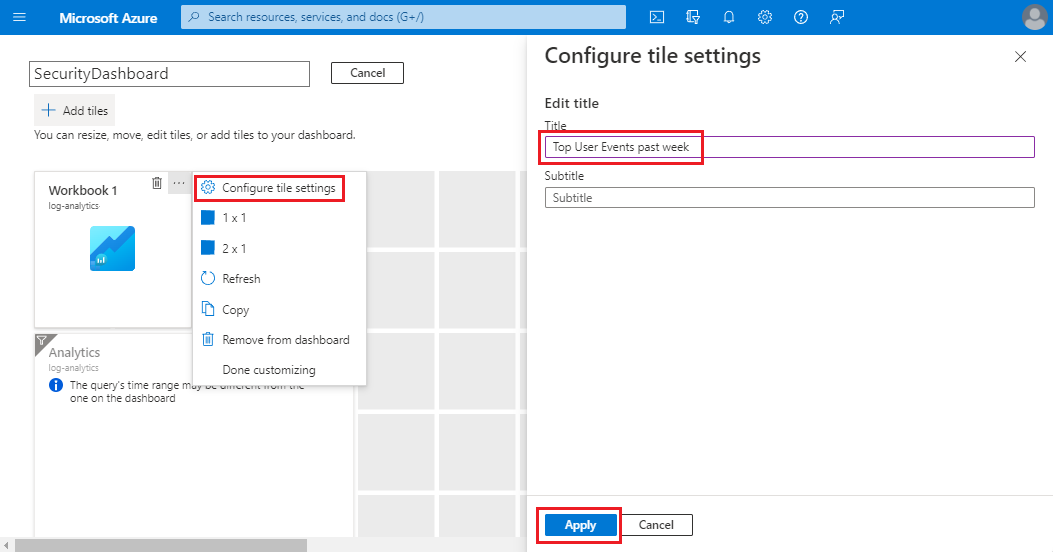
On a tile, select the ellipsis, and then select Configure tile settings (the gear icon) in the item tile.
In the Configure tile settings pane, change the title to Top User Events past week.
Select Apply.
To change how an item appears in the dashboard, select the ellipsis, and then select Customize (the pencil icon). Select from the options to change the tile appearance on the dashboard, and then select Done customizing.
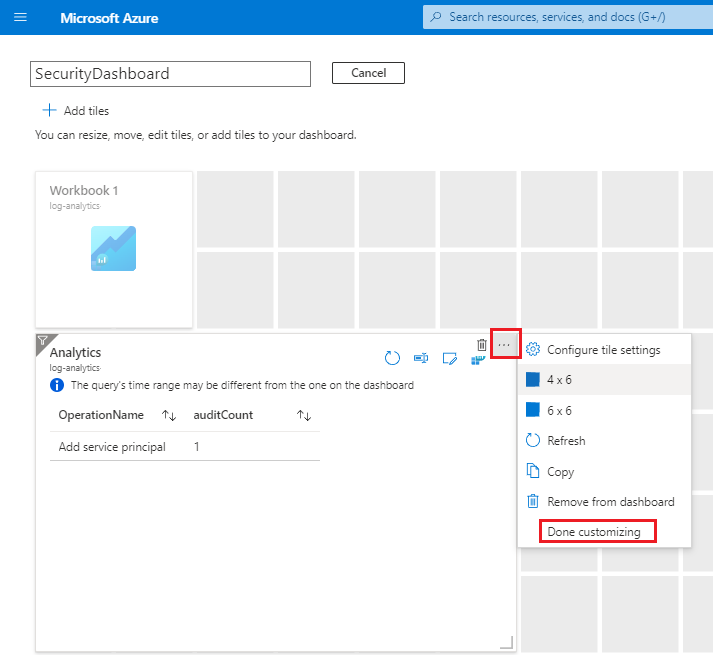
Select Save.
Export a report to Excel
Finally, export the report to Excel:
In the report tile on the dashboard, select the Open in Logs blade icon:
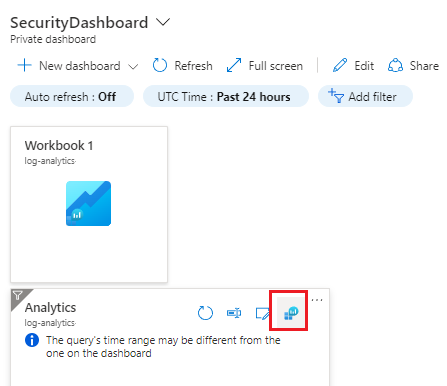
In the Logs pane, select Run, and then select Export > Open in Excel.
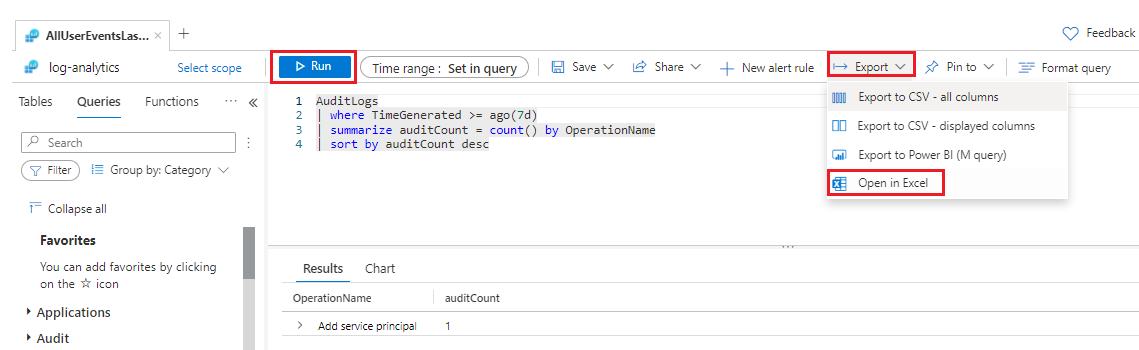
Open the downloaded file, and then save the file to your computer.