Identify and resolve common problems
There are two common ways to use Monitor during the app development process:
Reactive: Use Monitor when you're aware of a problem and need to identify the root cause. For example, if a user reports an error, you can use Monitor to observe events related to the reported issue.
Proactive: Use Monitor before releasing your app to identify potential issues. Run the app while capturing events in Monitor and review the event log for long response times, anomalies, or errors. Identifying issues early helps reduce problems in production and supports higher app quality.
Start with a clean event log
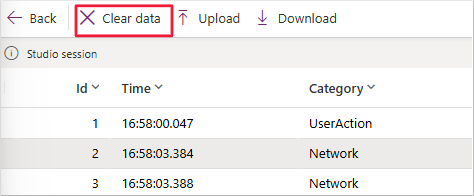
Before testing your app, start with an empty event log. In Monitor, select Clear data to remove previous events. This ensures that the captured data reflects only the new actions you perform during testing.
Use meaningful control names
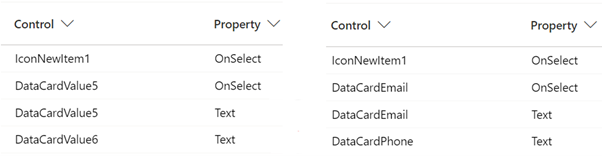
Control names in the event log correspond to the names in your app. Descriptive control names make it easier to analyze event data. The following image compares default names with more descriptive alternatives, highlighting the benefits of meaningful naming.
Filter event data to find related events
When troubleshooting, it's common to identify patterns across related events. Monitor provides two filtering options:
Global filter
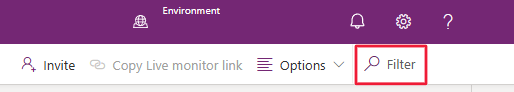
The global filter searches all columns in the event log. It's useful for broad searches, such as control names or connector actions. You can find this filter in the upper-right corner of the Monitor dashboard.
Column filters
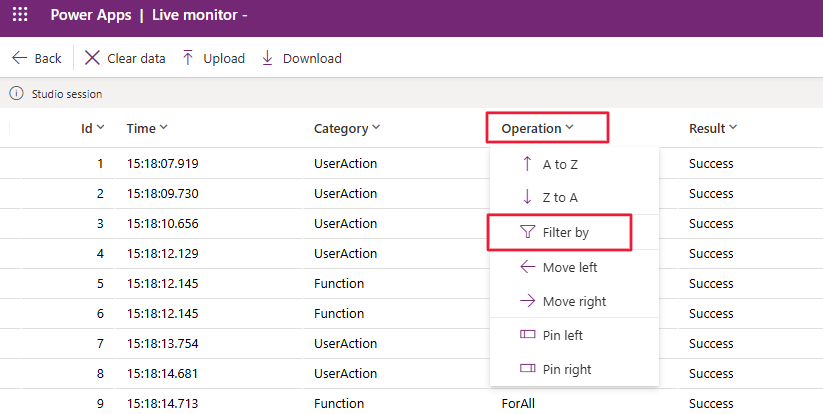
Use column filters to target specific columns. Select the dropdown next to the column name and choose Filter by. You can apply filters to multiple columns simultaneously. When multiple filters are used, all conditions must be met for an event to display.
Filters are useful when working with large sets of captured events to isolate specific issues.
Identify and resolve errors
Errors often present as messages to the user or trigger error-handling logic in the app. Monitor provides detailed information for errors involving connectors.
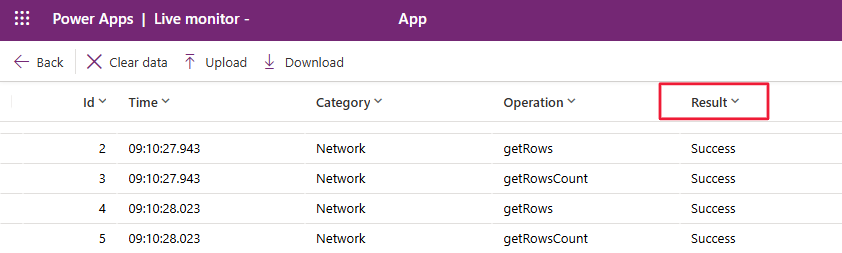
To identify errors:
- Look for entries in the Result column labeled Error.
- Watch for a red circle at the start of error rows.
- Check the Status column for HTTP status codes. For more information, see HttpStatusCode Enum.
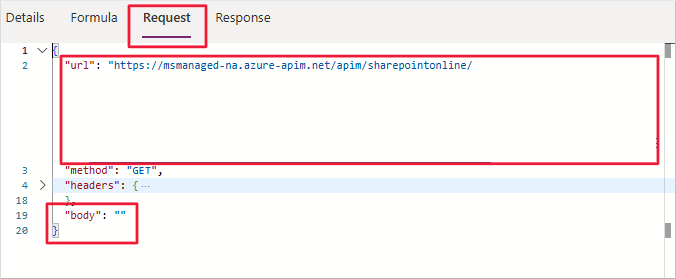
Double-click a row to open a pane with tabs for Formula, Request, and Response. These tabs provide insights into the error source.
- Formula shows the formula that caused the error.
- Request includes details like the URL and body sent to the connector.
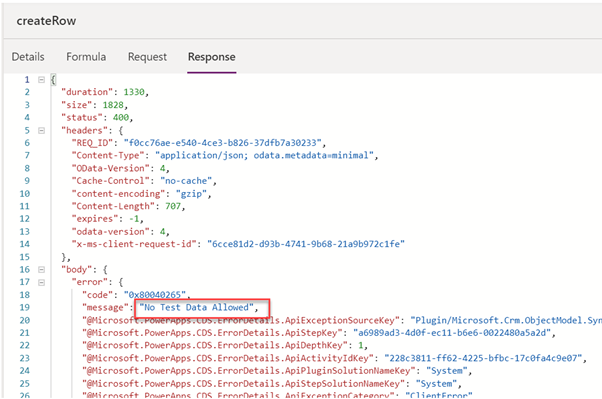
- Response includes returned data, including error messages.
Common issues include missing or incorrect data in requests. Compare request details to connector documentation to identify discrepancies.
Reviewing the Response tab can help you identify business rule violations or other errors returned by the connector.
If the response is unclear, provide these details to the connector developer or support.
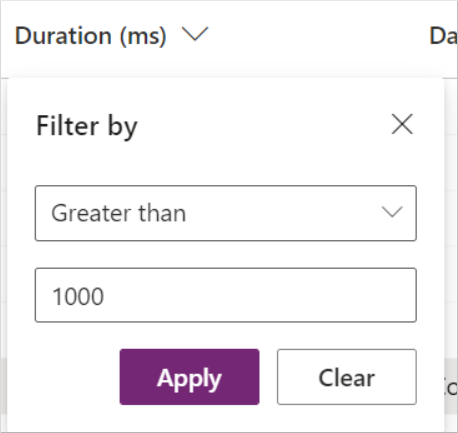
Identify and resolve slow actions
Use the Duration column to find slow actions. Filter the column to display entries that exceed a set threshold, such as one second. Duration values are in milliseconds (ms).
To capture startup logic performance, ensure Monitor is running and that Run OnStart logic is selected.
To improve performance:
- Reduce the volume of data returned.
- Optimize query criteria.
- Ensure only necessary data is requested.
Some connectors support options to limit returned data. Adjust requests accordingly.
Identify and resolve delegation problems
Delegation issues occur when a data source can't process a query remotely. Instead, the app retrieves a limited data set (default 500 records) and filters locally. This can result in incomplete or inaccurate data.
Use App checker in Power Apps Studio to identify delegation issues. Monitor can provide additional context when needed.
To troubleshoot delegation problems:
- Review the request in Monitor.
- Examine query criteria for unsupported functions.
- Modify formulas to use delegable functions.
Monitor helps confirm whether formula changes result in correct data retrieval.
Summary
Monitor is a critical tool for identifying errors, performance issues, and delegation problems in canvas apps. Use it proactively during development and reactively when addressing user-reported issues. With regular use, Monitor can help ensure app quality and performance.