Use Data Collector Sets to analyze server performance
A data collector set is a custom set of performance counters, event traces, and system configuration data. A data collector set organizes multiple data-collection points into a single portable component.
How can you use data collector sets?
You can use a data collector set on its own or group it with other data collector sets. You can also incorporate a data collector set into logs or observe it in Performance Monitor. You can configure a data collector set to generate alerts when it reaches thresholds configured in performance counters.
Although it's useful to analyze current performance activity on a server computer, you might find it more useful to collect performance data over a set period and then analyze and compare it with data that you gathered previously. You can use this comparison to determine resource usage to plan for growth and to identify potential performance problems.
You can also configure a data collector set to run at a scheduled time for a specific length of time or until it reaches a predefined size. For example, you can run a data collector set for 10 minutes every hour during your working hours to create a performance baseline. You can also set a data collector to restart when it reaches set limits so that it creates a separate file for each interval.
You can configure a schedule for performance monitoring when configuring a data collector set. Scheduling options on the Schedule tab of the data collector set's properties window. The schedule monitoring options that you can select include beginning date, expiration date, and start time. You can also choose the day of the week you want performance monitoring to run.
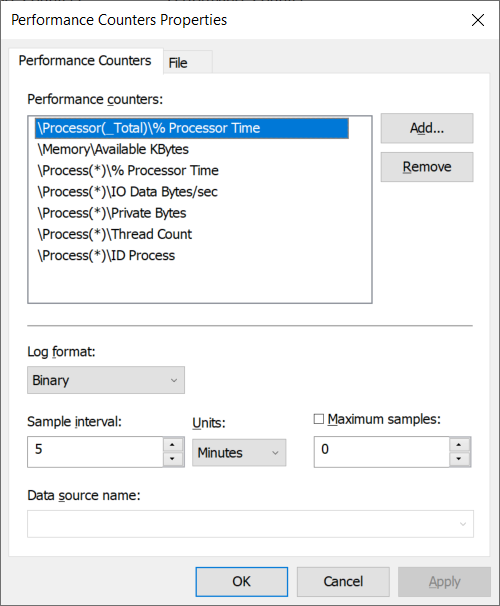
The following screenshot displays an administrator configuring a data collector set. They have selected the default Server Manager Performance Monitor data collector set, and are modifying the default Performance Counters.
After you've created a combination of data collectors that describe useful system information, you can save them as a data collector set, run the set, and observe the results.
Data collector sets can use the following types of data collectors:
- Performance counters. This data collector provides server performance data.
- Event trace data. This data collector provides information about system activities and events, and it's often useful for troubleshooting.
- System configuration information. This data collector allows you to record the current state of registry keys and to record changes to those keys.
Tip
You can create a data collector set from a template, from an existing set of data collectors in a Performance Monitor view, or by selecting individual data collectors, and then setting each individual option in the data collector set properties.