Monitor the Microsoft 365 network connectivity dashboard
The Microsoft 365 network connectivity dashboard provides you a quick overview of your enterprise network perimeter health. You can instantly get a sense of the enterprise's network health and quickly drill down into a detailed report for any global office location.

Required roles
To access the network connectivity page, you must be an administrator for the organization within Microsoft 365.
- The Report Reader administrative role will have read access to this information.
- An administrator must be part of a server administrator role to configure locations and other elements of network connectivity.
Prerequisites
You will have to configure your locations to see the map of global network performance. There are three options for getting network assessments from your office locations:
- Enable Windows Location Services.
- Add locations and provide LAN subnet information.
- Manually gather test reports with the Microsoft 365 network connectivity test tool.
For more information, see Pre-requisites for network connectivity assessments to appear
Interpret network assessments
You can access the network connectivity dashboard from the Microsoft 365 admin center > Health > Network connectivity. There are two types of network assessments:
Tenant network assessments
The network performance overview page shows a network assessment value for the whole Microsoft 365 tenant. This value is a weighted average of the network assessments for all office locations.
The network assessment at each location is shown with color. The size of the circle represents the relative number of users at each location.
Office location network assessments
A network assessment measures the design of the network perimeter of an office location to Microsoft's network. Improvements to the network perimeter are best done at each office location.
You can view a table view of the locations where they can be filtered, sorted, and edited in the Locations tab. Locations are auto classified as onsite or remote. You can enter all your onsite egress IP addresses manually to ensure a 100% classification.
You can select an office location to open a location-specific summary page. The page shows the details of the network egress that has been identified from measurements for that office location. The details tab on the office location page shows the specific measurement results that were used to come up with any insights, recommendations, and the network assessment.
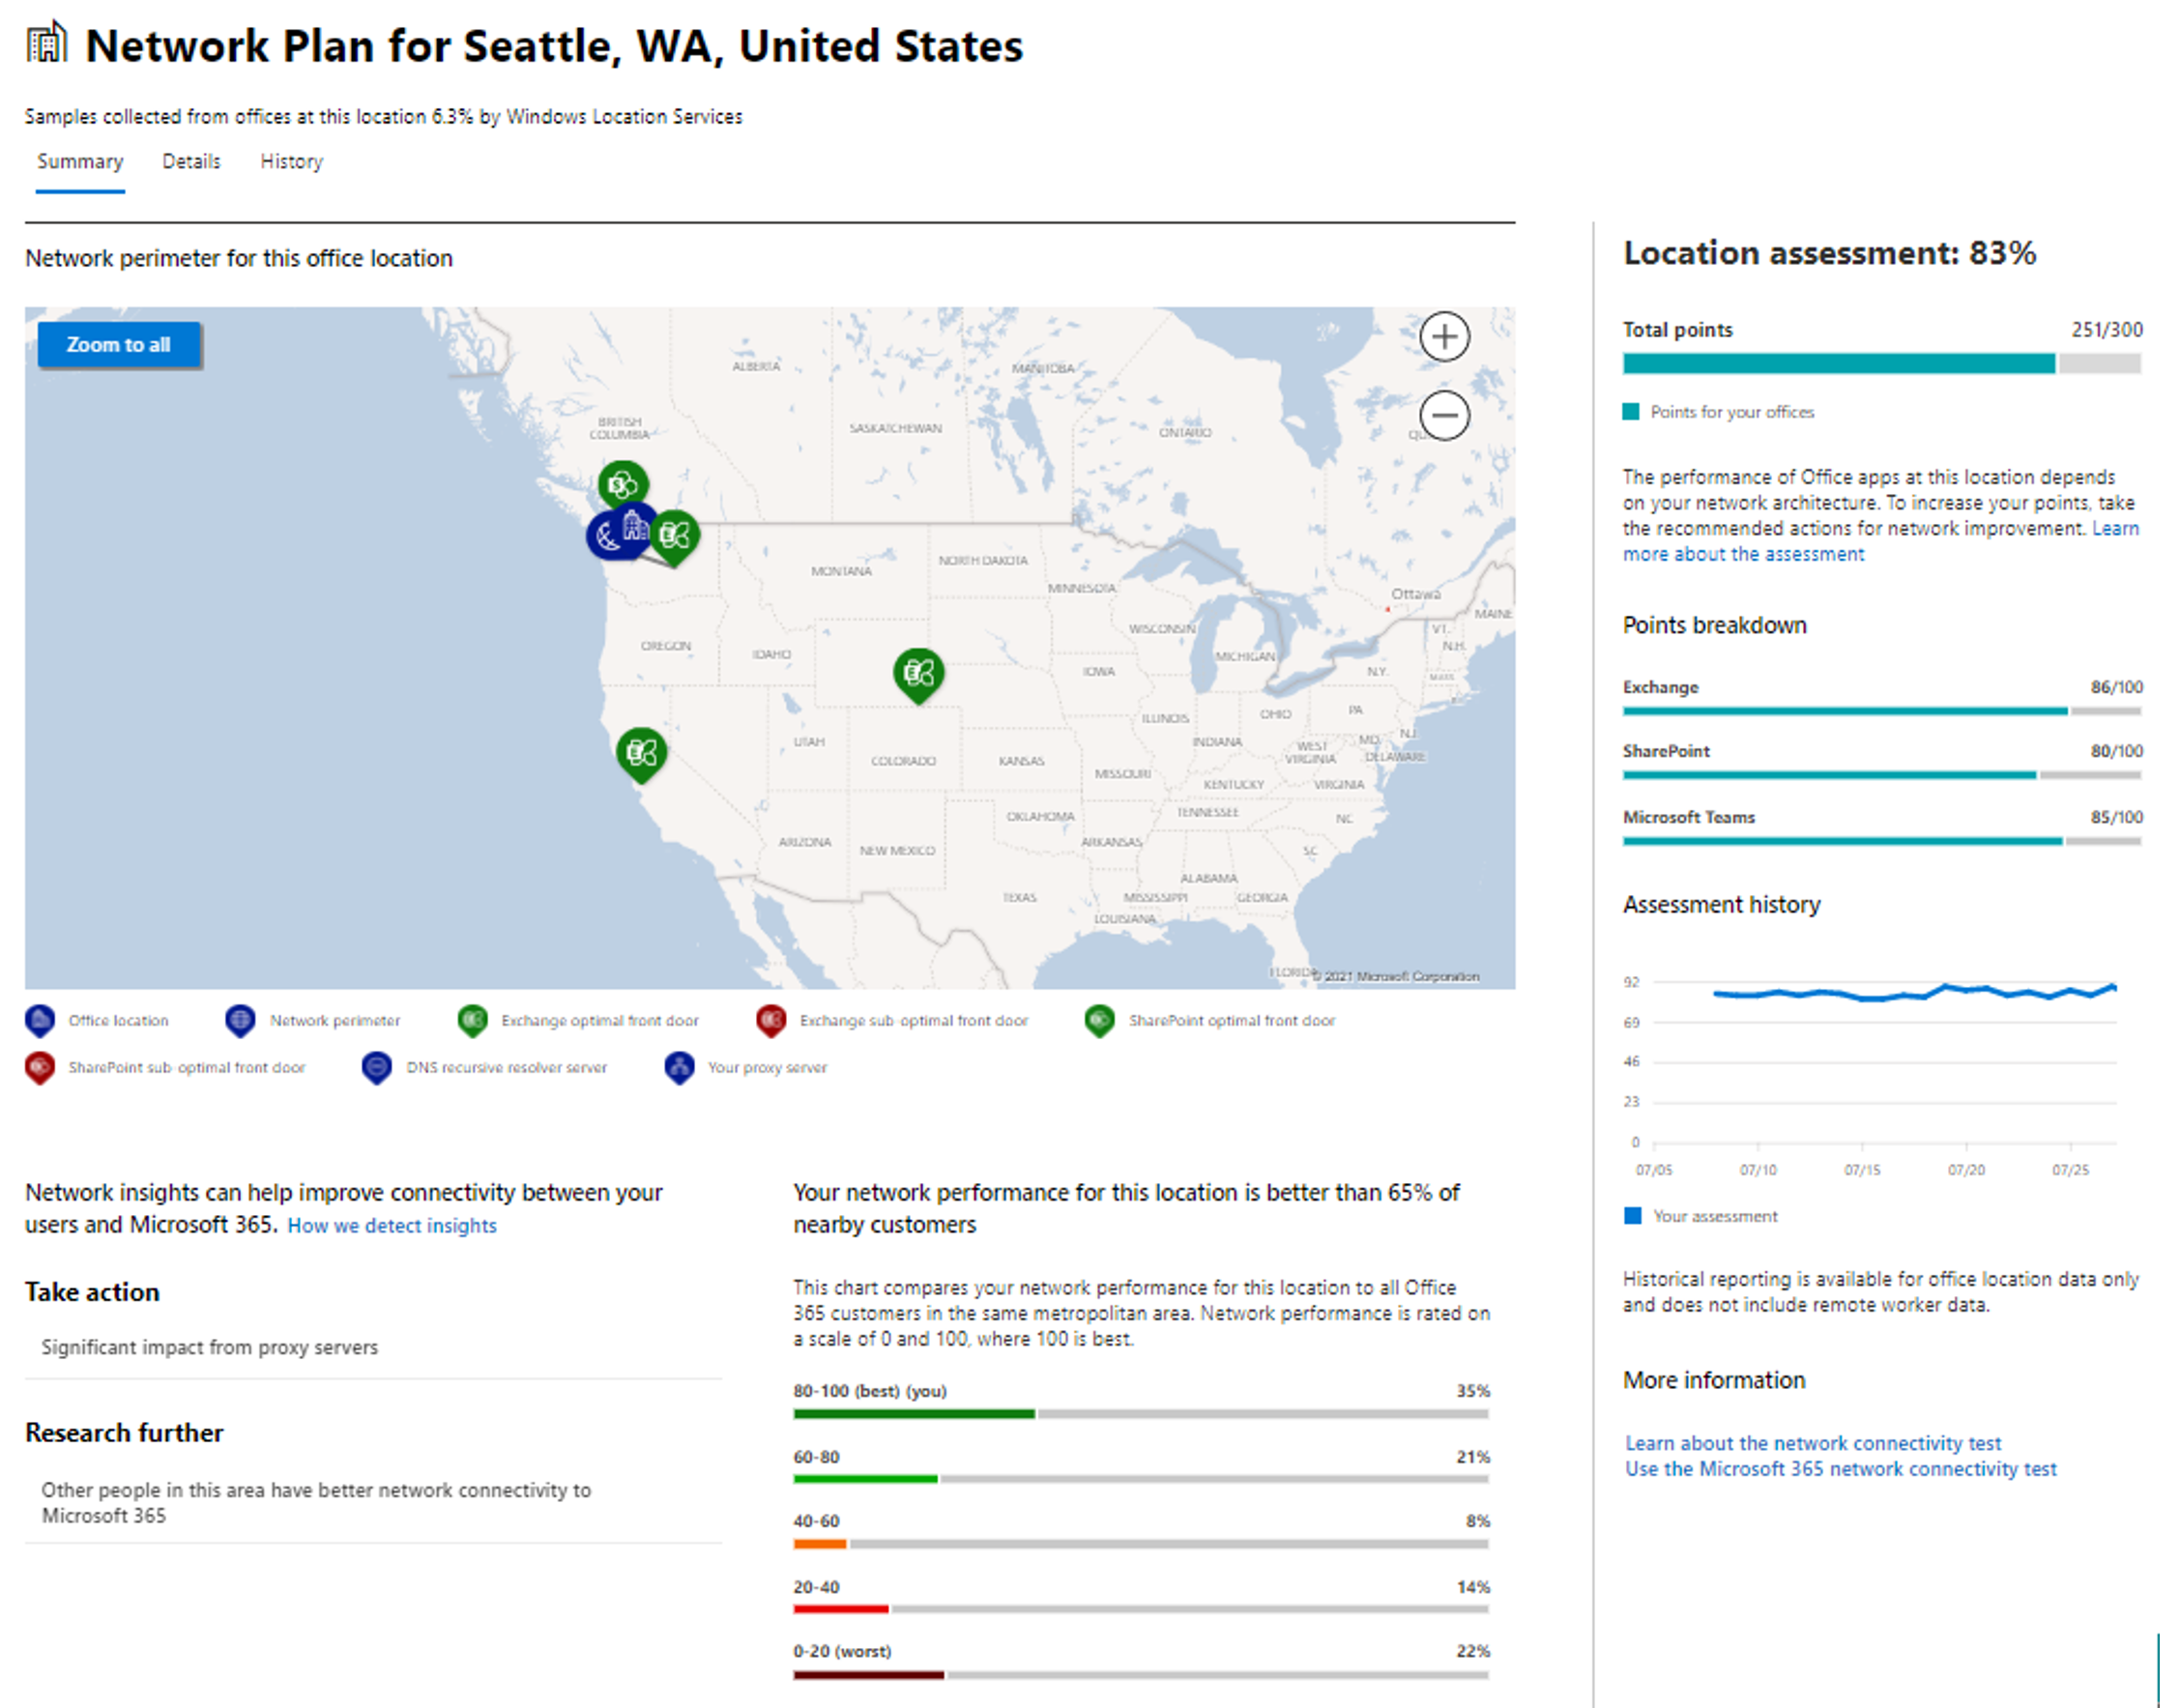

Each network assessment shows a network assessment panel with details about the assessment. This panel shows a bar chart of the assessment both as a percentage and as the total points for each component workload including only workloads where measurement data was received.
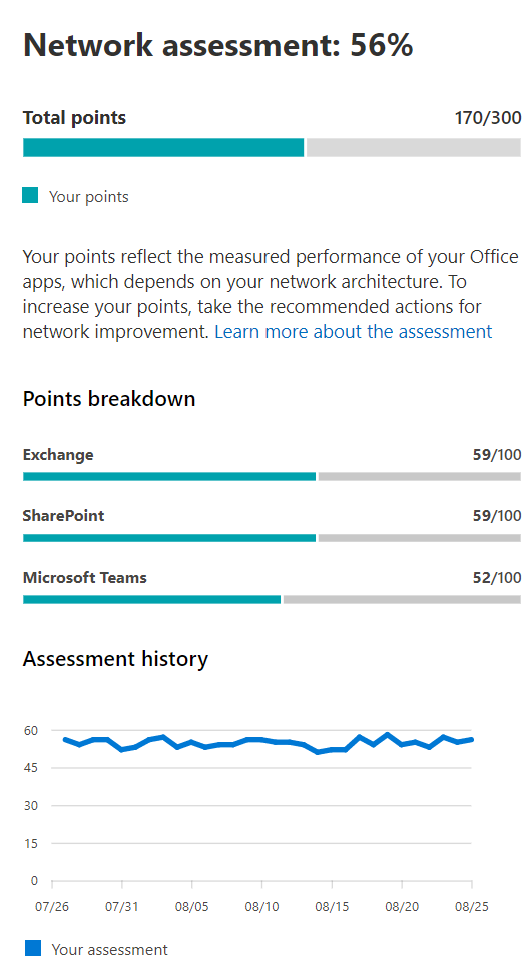
The network assessment points value is from 0 to 100 and is an average of TCP latency, download speed, and UDP connection quality metrics.
A high value indicates a properly configured network with few ongoing performance issues. A value of 80% represents a healthy baseline, above which you should not expect to receive regular user complaints about Microsoft 365 connectivity or responsiveness due to network performance. These metrics are compiled once a day. As iterative network connectivity improvements are made, this value will increase along with user experience.
Note
Performance metrics for Microsoft-owned networks are excluded from these measurements to ensure that assessment results are unambiguous and specific to the corporate network.
| Network assessment | Expected user experience |
|---|---|
| 100 | Best |
| 80 | Meets recommendations |
| 60 | Acceptable |
| 40 | Users may experience issues |
| 20 | Users may complain |
| 0 | Network problems a common topic of discussion |
Assessment breakdown
The Assessment breakdown in the panel shows the assessment for each of the component workloads, including Exchange, SharePoint, and Microsoft Teams.
For Microsoft Teams the Network quality is measured as UDP latency, UDP jitter, and UDP packet loss. UDP is used for call and conferencing audio and video media connectivity for Microsoft Teams. This can be impacted by the same factors as for latency and download speed in addition to connectivity gaps in a network's UDP support since UDP is configured separately to the more common TCP protocol. The median (also known as the 50th percentile or P50 measure) is taken for all measurements over the previous three days.
Microsoft calculates a mean opinion score from these UDP measurements for a scale from one to five. Then we map that to the 0-100 points scale for the Microsoft Teams network assessment. Overall good is over 87.5 points and overall bad is below 50 points.
Assessment history
The Assessment history shows the past 30 days of the assessment and the benchmark. You can also report on the metrics history for any office location for up to two years using the history tab. The history tab allows you to select your attributes to report on. By choosing a report time frame, you can highlight the impact of a network update project and see the improvement to your network assessment.
Review network insights
Network insights in the Insights tab are performance metrics collected from your Microsoft 365 tenant. Insights are intended to help in designing network perimeters for your office locations.
Each insight provides live details about the performance characteristics for a specific common issue for each geographic location where users are accessing your tenant. Performance recommendations for each network insight offer specific network architecture design changes you can make to improve user experience related to Microsoft 365 network connectivity.