Network monitoring
Your organization has servers, applications, services, and data, all of which are crucial to delivering services and products to your customers. You need to monitor your network regularly to protect your organization's assets and resources.
In this unit, we'll explore some of the different network-monitoring tools available. We'll explore best practices, like how to separate your monitoring tasks and functions. We'll also look at the tools available for alerting and monitoring on Azure.
What is network monitoring?
Network monitoring means monitoring all the components of a network, like switches, routers, servers, and firewalls. You can monitor the network for performance and faults and continuously analyze the information you gather. When you monitor a network, you're taking a preventative approach to issues. As a result, you're improving the availability of your network, reducing downtime and failures.
Agent-based monitoring
Network monitoring solutions are often agent-based. An agent is a piece of software that runs on the monitored device. The agent monitors and gathers information on the device, then sends information to the appropriate network-monitoring solution that employed it.
The agent helps gather granular data on the monitored device. For example, an agent can gather information on the processes running on the device, or its hardware performance. Keep in mind that an agent needs time to install and configure. The agent might also require maintenance and update tasks that will be time-consuming if there are many agents.
Agentless monitoring
Here, an agent isn't deployed to monitor devices. The networking solution gathers information on the device by looking at things like transferred data packets. The networking solution can also look at APIs that the device uses to send information about itself. Agentless monitoring helps avoid having to configure and maintain agents on devices. However, the information you gather might not be as granular as when you're using agent-based monitoring. Some devices also might not expose the information you need.
Monitoring intervals
Monitoring intervals show how frequently you want to poll for information on one of your network devices.
The interval frequency depends on what you want to monitor. For example, you'd use the shortest interval possible if you're monitoring to see if a particular device is available or not. If you're monitoring for things like memory and CPU usage, you might have intervals of a few minutes. You don't necessarily want to monitor every device at the shortest intervals possible for each metric, because you'd add unnecessary load to your network.
Protocols
To monitor your network, you'll need to use a secure network-management protocol that consumes minimum bandwidth. You want to keep your network secure and prevent unnecessary load on network performance. The following are some network management protocols that you can use:
Simple Network Management Protocol (SNMP)
Like switches and routers, the majority of Linux servers and network devices use SNMP. An SNMP-based agent is preinstalled on the device and allows for configuration. The SNMP agent collects things like traffic on the network switch, memory usage, or even printer queues. The SNMP protocol communicates information about the device to the network monitoring and management solution (NMS).
Windows Management Instrumentation (WMI)
Windows devices use WMI to provide information about the status of the device. You can also use WMI to make changes to devices, such as scheduling processes to trigger or updating system properties and settings. Windows Management Infrastructure is a newer version of WMI that has upgraded capabilities, such as better integration with PowerShell to run commands and scripts.
System Logging Protocol (Syslog)
Syslog is a protocol that lets the device send event messages and is used for event logging. For example, the web server might use Syslog to log events about failed attempts to access it, or the router might log events on user activities.
Best practices
FCAPS
When you manage a network, you deal with many different tasks and functions. These tasks and functions have been categorized to help us deal with them effectively. The categories are fault management, configuration management, accounting/administration, performance management, and security, or FCAPS:
Fault management relates to the processes and tasks used to identify and resolve faults on the network. Dealing with issues that might cause problems later is also classified as fault management.
Configuration management includes aspects like collecting information based on changes made to device configurations, physical hardware, and network changes, as well as software updates.
Accounting/administration applies when you're dealing with a network used in a service-provider setting, and all the tasks and functions that apply. With service-provider networks, usage needs to be monitored to track utilization and billing for users. If the network isn't in a service-provider setting, then administration is applicable, and tasks like managing permissions and user passwords are included.
Performance management covers anything that's done to manage the performance of your network. Aspects include monitoring throughput, monitoring usage, and improving response times.
Security encompasses all the tasks you do to secure your network. These tasks include protecting devices, restricting access to network resources, or protecting user activity in the network.
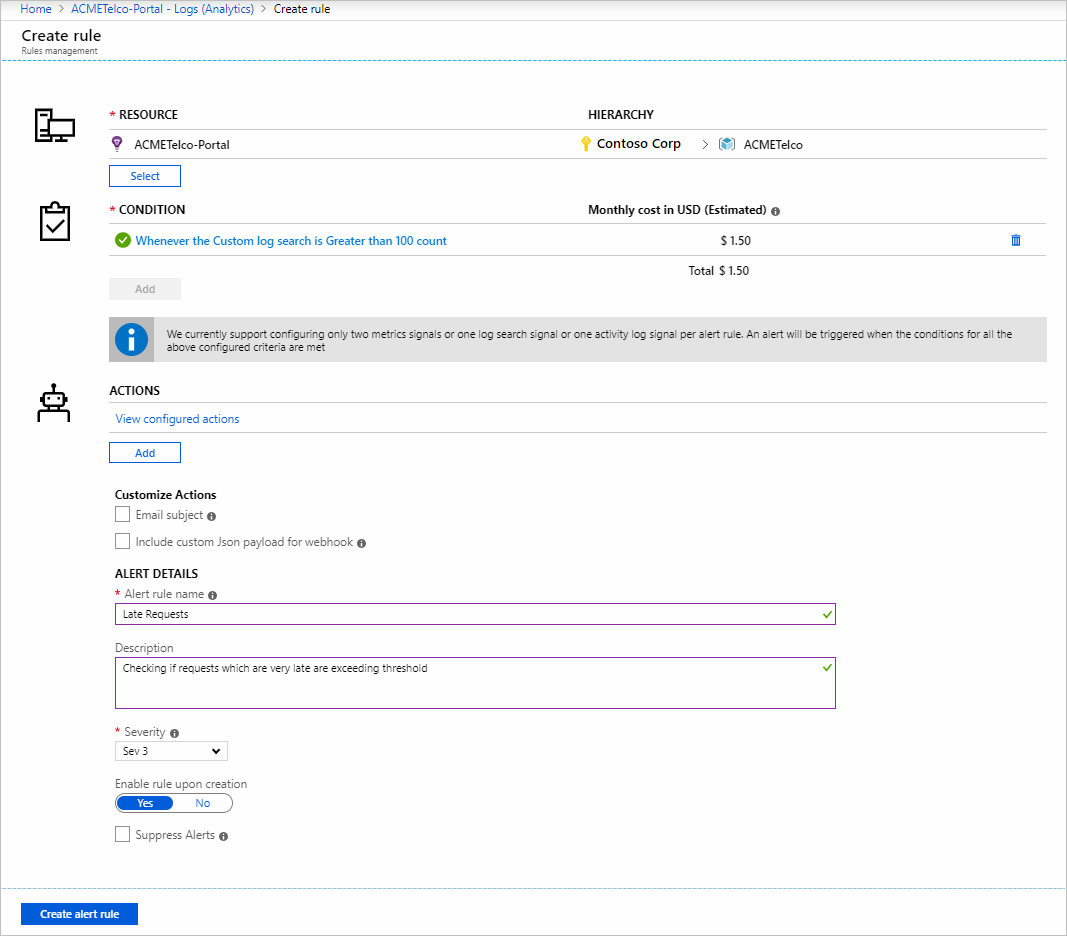
Alerts and reports
When you're monitoring the network, you collect data. You process data through reporting and put it into a format you can use to make informed management decisions about your network. Use alerts to capture information about events and issues. These alerts help you respond better to issues and risks as they arise.
Here are some of the Azure network-monitoring solutions you can use for reporting and alerts.
Azure Monitor
Azure Monitor is a unifying solution that collects log data for analysis, helping you take appropriate action for resources across your on-premises and Azure networks. Azure Monitor varies in the scope of its capabilities. For example, Azure Monitor uses its integration with Application Insights to check and diagnose any risks and issues in the applications and their dependencies.
You can use Azure Monitor to configure alerts to notify you about potential problems. These alerts help you take further action (when needed) to rectify potential problems in your network environment.
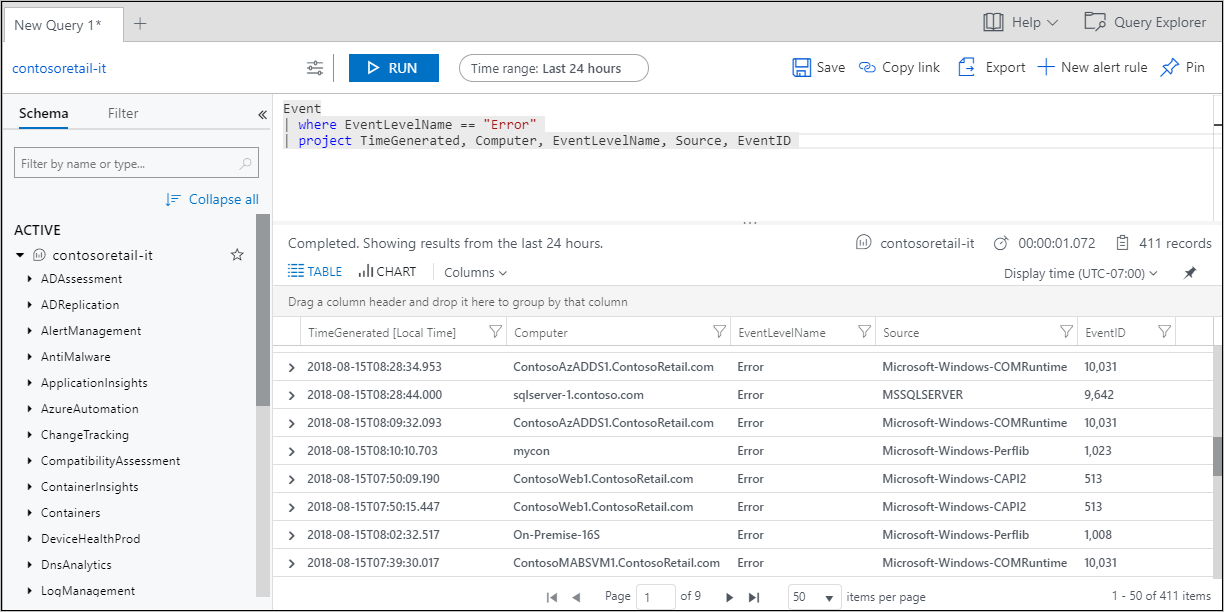
Log Analytics
You can use the Log Analytics tool in Azure Monitor to query and aggregate large amounts of log data for comprehensive analysis. This tool helps you gain a better understanding of the resources and services across your network.