Review performance of measures, relationships, and visuals
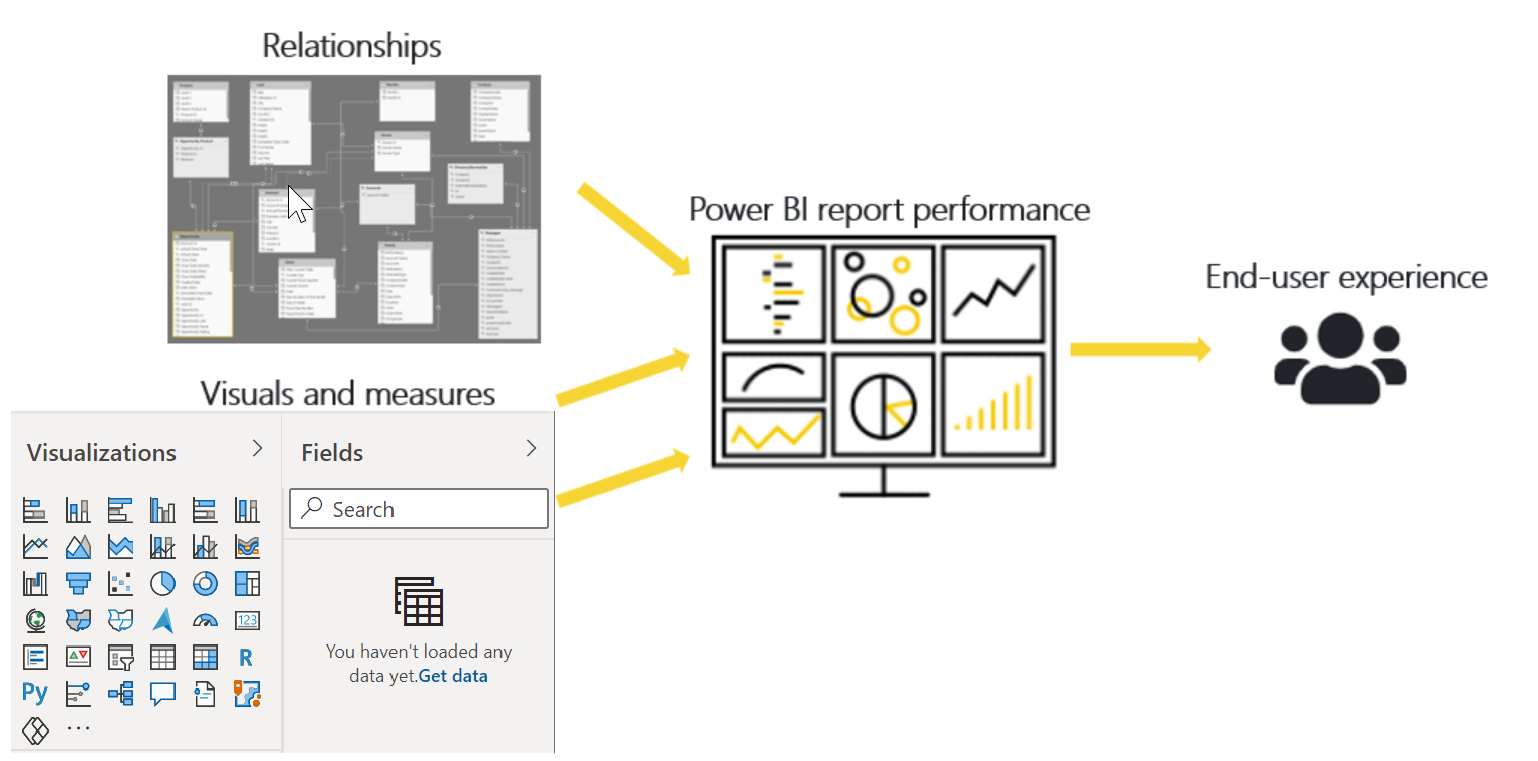
If your semantic model has multiple tables, complex relationships, intricate calculations, multiple visuals, or redundant data, a potential exists for poor report performance. The poor performance of a report leads to a negative user experience.
To optimize performance, you must first identify where the source of the problem; in other words, find out which elements of your report and semantic model are causing the performance issues. Afterward, you can take action to resolve those issues and, therefore, improve performance.
Identify report performance bottlenecks
To achieve optimal performance in your reports, you need to create an efficient semantic model that supports fast-running queries and measures. When you have a good foundation, you can improve the model further by analyzing the query plans and dependencies and then making changes to further optimize performance.
You should review the measures and queries in your semantic model to ensure that you are using the most efficient way to get the results that you want. Your starting point should be to identify bottlenecks that exist in the code. When you identify the slowest query in the semantic model, you can focus on the biggest bottleneck first and then establish a priority list to work through the other issues.
Analyze performance
You can use Performance Analyzer, which is a tool in Power BI Desktop, to help find out how each of your report elements is performing when users interact with them. For example, you can determine how long it takes for a particular visual to refresh when it's initiated by a user interaction. The tool will help you identify any elements that contribute to your performance issues, which can be useful during troubleshooting.
Before you run Performance Analyzer, to ensure you get the most accurate results in your analysis (test), make sure that you start with a clear visual cache and a clear data engine cache.
Visual cache - When you load a visual, you can't clear this visual cache without closing Power BI Desktop and opening it again. To avoid any caching in play, you need to start your analysis with a clear visual cache.
To ensure that you have a clear visual cache, add a blank page to your Power BI Desktop file and then, with that page selected, save and then close the file. Reopen the Power BI Desktop file, which will open on the blank page.
Data engine cache - When a query is run, the results are cached, so the results of your analysis will be misleading. You need to clear the data cache before rerunning the visual.
To clear the data cache, you can either restart Power BI Desktop or connect DAX Studio to the semantic model and then invoke the Clear Cache function.
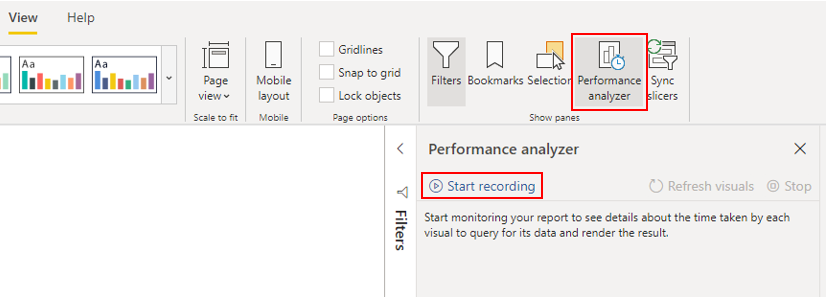
When you have cleared the caches and opened the Power BI Desktop file on the blank page, go to the View ribbon tab, and then select Performance Analyzer.
To begin the analysis process, select Start recording, select the page of the report that you want to analyze, and then interact with the elements of the report that you want to monitor. You will see the results of your interactions displayed in the Performance Analyzer pane as you work. When you are finished, select the Stop button.
For more detailed information, see Use Performance Analyzer to examine report element performance.
Review results
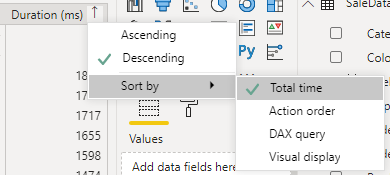
You can review the results of your performance test in the Performance Analyzer pane. To review the tasks in order of duration, longest to shortest, right-click the Sort icon next to the Duration (ms) column header, and then select Total time in Descending order.
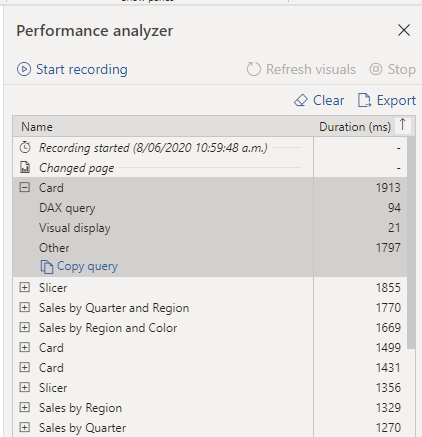
The log information for each visual shows how much time it took (duration) to complete the following categories of tasks:
- DAX query - The time it took for the visual to send the query, along with the time it took Power BI to return the results.
- Visual display - The time it took for the visual to render on the screen, including the time required to retrieve web images or geocoding.
- Other - The time it took the visual to prepare queries, wait for other visuals to complete, or perform other background processing tasks. If this category displays a long duration, the only real way to reduce this duration is to optimize DAX queries for other visuals, or reduce the number of visuals in the report.
The results help you to understand the behavior of your semantic model and identify the elements that you need to optimize. You can compare the duration of each element in the report and identify the elements that have a long duration. You should focus on those elements and investigate why it takes them so long to load on the report page.
To analyze your queries in more detail, you can use DAX Studio, which is a free, open-source tool that's provided by another service.
Resolve issues and optimize performance
The results of your analysis will identify areas for improvement and opportunities for performance optimization. You might find that you need to carry out improvements to the visuals, DAX calculations, or other elements in your semantic model. The following information provides guidance on what to look for and the changes that you can make.
Visuals
If you identify visuals as the bottleneck leading to poor performance, you should find a way to improve performance with minimal impact to user experience.
Consider the number of visuals on the report page; fewer visuals means better performance. Ask yourself if a visual is really necessary and whether it adds value to the end user. If the answer is no, you should remove that visual. Rather than using multiple visuals on the page, consider other ways to provide additional details, such as drill-through pages or report page tooltips.
Examine the number of fields in each visual. The more visuals you have on the report, the higher chance for performance issues. In addition, the more visuals, the more the report can appear crowded and lose clarity. The upper limit for visuals is 100 fields (measures or columns), so a visual with more than 100 fields will be slow to load. Ask yourself whether you really need all of this data in a visual. You might find that you can reduce the number of fields that you currently use.
DAX query
When you examine the results in the Performance Analyzer pane, you can see how long it took the Power BI Desktop engine to evaluate each query (in milliseconds). A good starting point is any DAX query that's taking longer than 120 milliseconds. In this example, you identify one particular query that has a large duration time.
Performance Analyzer highlights potential issues, but it doesn't tell you what needs to be done to improve them. You might want to conduct further investigation into why this measure takes so long to process. You can use DAX Studio to investigate your queries in more detail.
For example, select Copy Query to copy the calculation formula onto the clipboard, then paste it into DAX Studio. You can then review the calculation step in more detail. In this example, you're trying to count the total number of products with order quantities greater than or equal to five.
Count Customers =
CALCULATE(
    DISTINCTCOUNT(Order[ProductID]),
    FILTER (Order, Order[OrderQty] >= 5)
)
After analyzing the query, you can use your own knowledge and experience to identify where the performance issues are. You can also try using different DAX functions to see whether they improve performance. In the following example, the FILTER function was replaced with the KEEPFILTER function. When the test was run again in Performance Analyzer, the duration was shorter as a result of the replaced function.
Count Customers =
CALCULATE(
    DISTINCTCOUNT(Order[ProductID]),
    KEEPFILTERS(Order[OrderQty] >= 5)
)
In this case, you can replace the FILTER function with the KEEPFILTER function to significantly reduce the evaluation duration time for this query. When you make this change, to check whether the duration time has improved or not, clear the data cache and then repeat the Performance Analyzer process.
Semantic model
If the duration of measures and visuals display low values (in other words they have a short duration time), they're not the reason for the performance issues. Instead, if the DAX query displays a high duration value, it's likely that a measure is written poorly or an issue has occurred with the semantic model. The issue might be caused by the relationships, columns, or metadata in your model, or it could be that the Auto date/time option is enabled, as described in the following section.
Relationships
You should review the model relationships between tables to ensure that you have established the correct relationships. Check that relationship cardinality properties are correctly set up. For example, a one-side column that contains unique values might be incorrectly configured as a many-side column. You'll learn more about how cardinality affects performance later in this module.
Columns
It's best practice to not import columns of data that you don't need. To avoid deleting columns in Power Query, you should try to deal with them at the source when loading data into Power BI Desktop. However, if it's impossible to remove redundant columns from the source query or the data has already been imported in its raw state, you can always use Power Query to examine each column. Ask yourself whether you really need each column and try to identify the benefit that each adds to your semantic model. If you find that a column adds no value, you should remove it from your semantic model. For example, suppose that you have an ID column with thousands of unique rows. You know that you won't use this particular column in a relationship, so it won't be used in a report. Therefore, you should conclude that this column as unnecessary and admit that it's wasting space in your semantic model.
When you remove an unnecessary column, you reduce the size of the semantic model which, in turn, results in a smaller file size and faster refresh time. Also, because the semantic model contains only relevant data, the overall report performance should improve.
For more information, see Data reduction techniques for Import modeling.
Metadata
Metadata is information about other data. Power BI metadata contains information on your semantic model, such as the name, data type and format of each of the columns, the schema of the database, the report design, when the file was last modified, the data refresh rates, and more.
When you load data into Power BI Desktop, it's good practice to analyze the corresponding metadata so you can identify any inconsistences with your semantic model and normalize the data before you start to build reports. Running analysis on your metadata should improve semantic model performance because, while analyzing your metadata, you'll possibly identify unnecessary columns, errors within your data, incorrect data types, the volume of data being loaded (large semantic models, including transactional or historic data, will take longer to load), and more.
You can use Power Query in Power BI Desktop to examine the columns, rows, and values of your source data. You can then use the available tools, such as those highlighted in the following image, to make the necessary changes.
The Power Query options include:
Unnecessary columns - Evaluates the need for each column. If one or more columns won't be used in the report and are therefore unnecessary, you should remove them by using the Remove Columns option.
Unnecessary rows - Checks the first few rows in the semantic model to see whether they're empty or whether they contain data that you don't need in your reports; if so, it removes those rows by using the Remove Rows option.
Data type - Evaluates the column data types to ensure that each one is correct. If you identify a data type that's incorrect, change it by selecting the column, selecting Data Type on the Transform ribbon tab, and then selecting the correct data type from the list.
Query names - Examines the query (table) names in the Queries pane. Just like you did for column header names, you should change uncommon or unhelpful query names to names that are more obvious or names that the user is more familiar with. You can rename a query by right-clicking that query, selecting Rename, editing the name as required, and then pressing Enter.
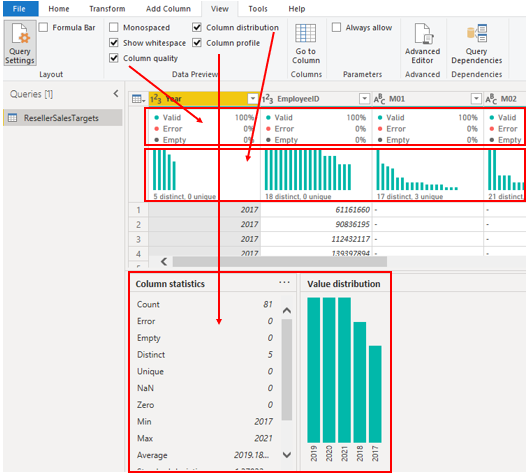
Column details - Power Query has the following three data preview options that you can use to analyze the metadata that's associated with your columns. You can find these options on the View ribbon tab, as shown in the following screenshot.
- Column quality - Determines what percentage of items in the column are valid, have errors, or are empty. If the valid percentage is not 100 percent, you should investigate the reason, correct the errors, and populate empty values.
- Column distribution - Displays frequency and distribution of the values in each of the columns. You'll investigate this further later in this module.
- Column profile - Shows column statistics chart and a column distribution chart.
Note
If you're reviewing a query with more than 1,000 rows, and you want to analyze that whole semantic model, you need to change the default option at the bottom of the window. Select Column profiling based on top 1000 rows > Column profiling based on entire data set.
Other metadata that you should consider is the information about the semantic model as a whole, such as the file size and data refresh rates. You can find this metadata in the associated Power BI Desktop (.pbix) file. The data that you load into Power BI Desktop is compressed and stored to disk by the VertiPaq storage engine. The size of your semantic model has a direct impact on its performance; a smaller sized semantic model uses less resources (memory) and achieves faster data refresh, calculations, and rendering of visuals in reports.
Auto date/time feature
Another item to consider when optimizing performance is the Auto date/time option in Power BI Desktop. By default, this feature is enabled globally, which means that Power BI Desktop automatically creates a hidden calculated table for each date column, provided that certain conditions are met. The new, hidden tables are in addition to the tables that you already have in your semantic model.
The Auto date/time option allows you to work with time intelligence when filtering, grouping, and drilling down through calendar time periods. We recommend that you keep the Auto date/time option enabled only when you work with calendar time periods and when you have simplistic model requirements in relation to time.
If your data source already defines a date dimension table, that table should be used to consistently define time within your organization, and you should disable the global Auto date/time option. Disabling this option can lower the size of your semantic model and reduce the refresh time.
You can enable/disable the Auto date/time option globally so that it applies to all of your Power BI Desktop files, or you can enable/disable the option for the current file so that it applies only to an individual file.
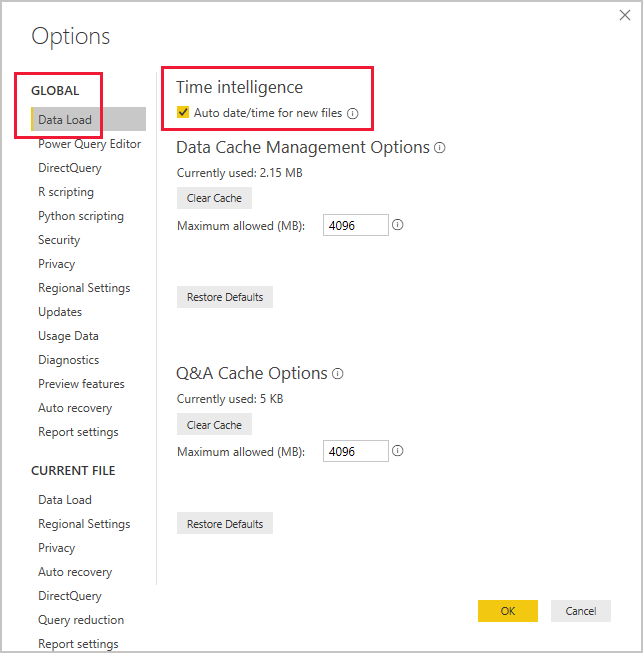
To enable/disable the Auto date/time option, go to File > Options and settings > Options, and then select either the Global or Current File page. On either page, select Data Load and then, in the Time Intelligence section, select or clear the check box as required.
For an overview and general introduction to the Auto date/time feature, see Apply auto date/time in Power BI Desktop.
