Exercise - Perform analytics in Power BI
In this exercise, you learn how to:
- Create animated scatter charts
- Use a visual to forecast values
This lab takes approximately 20 minutes to complete.
Note
A virtual machine containing the client tools you need is provided, along with the exercise instructions. Use the "Launch lab" button to launch the virtual machine.
A limited number of concurrent sessions are available. If the hosted environment is unavailable, please try again later.
Alternatively, you can open the instructions in a separate window.
Tip
You need access to the Power BI service to complete this exercise in your own environment. Work with your IT organization or create a free Microsoft 365 Developer account.
Access your environment
Before you start this lab (unless you are continuing from a previous lab), select Launch lab above.
You are automatically logged in to your lab environment as data-ai\student.
You can now begin your work on this lab.
Tip
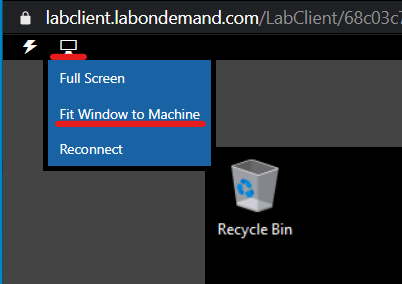
To dock the lab environment so that it fills the window, select the PC icon at the top and then select Fit Window to Machine.
