Monitor performance by using SQL Insights
SQL performance tools are viewed in Lifecycle Services through the Environment Monitoring page on the SQL Insights tab. Within this tab, you can view Performance Metrics, Index Analysis, Live View, Queries, and Actions for a specific environment.
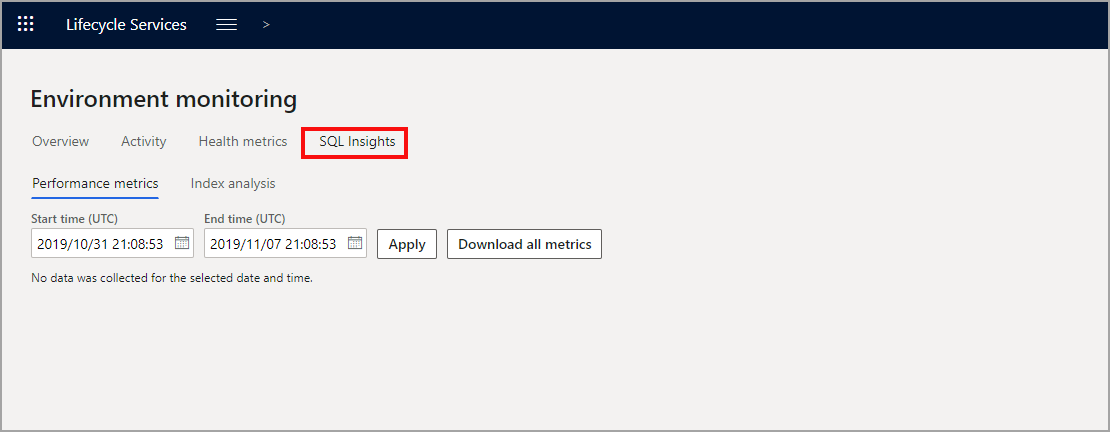
- Performance Metrics - Shows you the most expensive queries that were run in the system during a selected period based on duration in milliseconds, logical input/output, execution count, CPU time in milliseconds, and wait time. The data collection is pulled once daily and is stored for 30 days. On the Statement tab within Performance Metrics, you can view the query and download the query run plan.
- Index Analysis - Shows aggregated table and index information from user scans, seeks, updates, and row count. You can view the trend for your selected index and additional table metrics.
- Live View - Shows you the current DTU and running and blocking statements.
- Queries - Shows a list of predefined queries that are used to retrieve metrics on an on-demand basis. Most queries are run synchronously to ensure that the results are returned instantaneously. If you're having performance issues, the query runs could cause a time-out error. If this happens, select the option to turn off Use Fast Query and rerun the query.
- Actions - Shows a list of predefined actions that you should use to mitigate issues in sandbox and production environments. These actions include adding or dropping an index, updating statistics on a table, rebuilding indices, terminating a blocking statement, and others. You can view environment history based on the action that was performed.
Advanced troubleshooting with SQL Insights
For advanced troubleshooting, you can view the raw information logs. Before exporting the logs, you can use predefined queries to get the raw logs for an issue to aid in your diagnostics and monitoring. The different types of predefined queries include slow queries, deadlocks, crashes, and financial reporting issues.
In addition to raw logs, an advanced SQL troubleshooting tool enables performance analysis. These tools are similar to the DynPerf tool that is used in Microsoft Dynamics AX 2012. If you want more information on this, check the reference links in the Summary unit of this module.