Measure and report Microsoft 365 Copilot usage
Measure the impact of Microsoft 365 Copilot through the Microsoft Copilot Dashboard
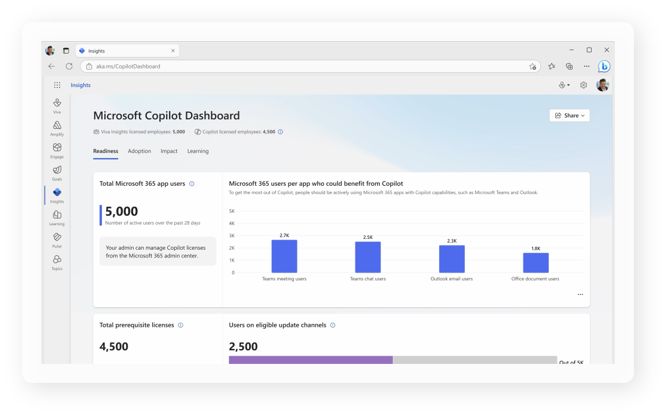
The Microsoft Copilot Dashboard powered by Microsoft Viva, helps organizations measure usage and adoption at every phase of the rollout with real-time data and insights. The dashboard enables business and IT leaders to prepare for the Copilot rollout, understand where it adds value, optimize user enablement strategies, and measure the impact of their investments.
The dashboard allows you to:
- Plan and track Copilot readiness across Microsoft 365 apps and features.
- Evaluate Copilot adoption by app, feature, and user group.
- Analyze Copilot's impact across meetings, email, chat, and documents.
- Understand how employees are using Copilot to save time and enhance their work.
- Compare adoption rates and usage across groups, organizations, and job functions.
- Benchmark user sentiment on Copilot's value against industry research.
- Access the latest AI research and insights to refine strategies.
Microsoft Viva for Measurement
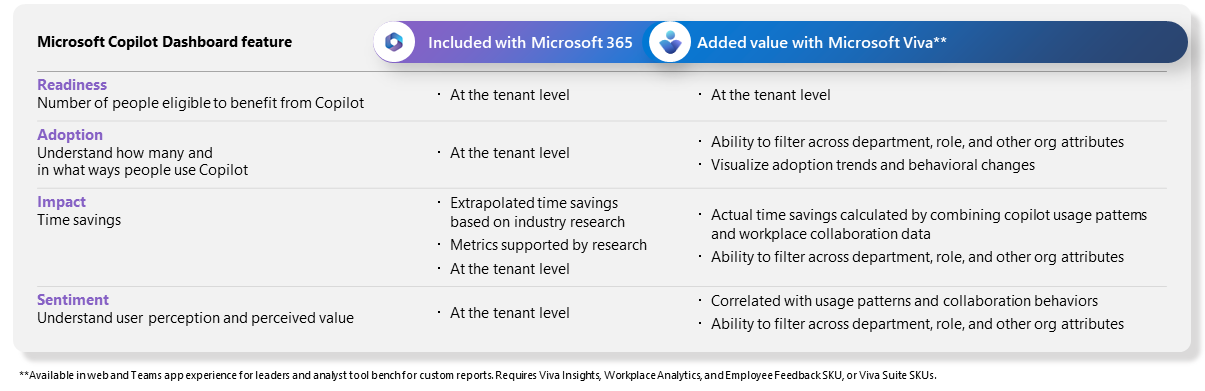
With a Viva license (available as an add-on), get advanced analytics across behavioral, collaboration, and sentiment data to measure how Copilot has impacted work patterns. Understand readiness, usage, and adoption trends while quantifying productivity gains. Leaders can also run custom queries and reports, and survey employees about their sentiment about Copilot. The following image describes the Microsoft Copilot dashboard features included with a Microsoft 365 license and with an added Microsoft Viva license.
Access reports and tracking tools within the Microsoft 365 admin center
The Microsoft 365 admin center is where you can manage your Microsoft 365 subscription (you must have the right admin permissions to access). Get insights on how employees are using Microsoft 365 apps and services through the available reports. Reports are available for the last 7 days, 30 days, 90 days, and 180 days. You need to have the right admin permissions to be able to view these reports. To access the admin center, go to admin.microsoft.com and sign in with your account information. Alternatively, you can access the Microsoft 365 admin center by logging in through www.office.com or through the Microsoft 365 Admin mobile app.
The following list describes the two types of reports available in the admin center:
Adoption score: Adoption score provides insights into your organization's digital transformation journey through its use of Microsoft 365 and the technology experiences that support it. Your organization's score reflects people and technology experience measurements and can be compared to benchmarks from organizations similar to yours. Adoption score provides metrics, insights, and recommendations in two areas: people experiences and technology experiences.
- People experiences: Quantifies how the organization works using Microsoft 365 categories like content collaboration, mobility, communication, meetings, and teamwork.
- Technology experiences: Quantifies how reliable and well-performing the technology is and the efficient use of Microsoft 365. These insights can be viewed through Endpoint analytics and network connectivity.
Usage: Usage reports help you see how users are using Microsoft 365 apps and services across your organization. These reports can help you make changes or steer user behavior to maximize the benefits you get with Microsoft 365. You can drill down into each product report to get more detailed insights about the activities within each product. For example, you can understand the activity of each user licensed to use Microsoft 365 Apps by looking at their activity across the apps and how they're utilized across platforms.
You can use Microsoft 365 usage analytics within Power BI to get more insights on how your organization is adopting the various apps and services within Microsoft 365. You can visualize and analyze Microsoft 365 usage data, create custom reports and share the insights within your organization. You can also gain insights into how specific regions or departments are using Microsoft 365. For more information, see About Microsoft 365 usage analytics.
Refer to these reports to measure against your success criteria and identify areas for improvement. Continue to track KPIs using your customized scorecard.