Handle missing data
Missing data refers to the lack of values in certain variables within a dataset.
Handling missing data is a crucial aspect of the preprocessing phase in a machine learning project, and the way you treat them can significantly affect the performance of your model.
Check for missing data
Back to the scenario of house prices from the previous unit, let’s suppose we encounter missing values in our df dataframe that require attention.
To check for missing data in Data Wrangler, you need to first launch Data Wrangler from a Microsoft Fabric notebook. Once there, you have a few options.
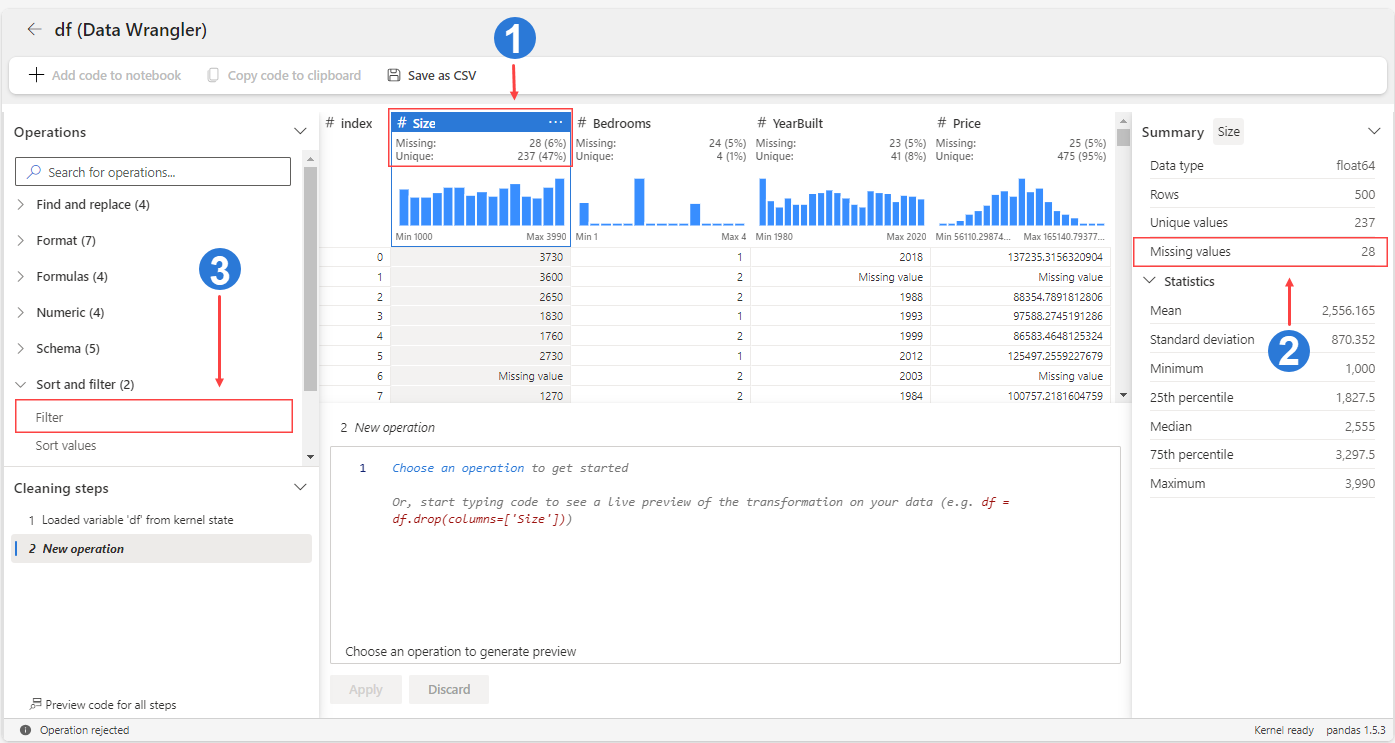
- Column header: Shows the count and proportion of missing values for each variable at the top of the grid.
- Summary panel: Highlights the summary statistics for the selected column or dataframe, including missing values.
- Filter operator: Filters rows based on one or more conditions. This option is also available in the column header when you select More options for the column.
Handling missing data
There are a few options on how to handle missing data.
Ignore: Minimal missing data might not significantly impact your model.
Remove: Rows or columns with many missing values might be better off removed.
Impute: Fill in the missing values with a specified value or estimate (like mean, median, mode, or using a machine learning algorithm like K-Nearest Neighbors (KNN)).
Use it as a new feature: Sometimes, the fact that a value is missing can be used as information itself. For example, in a product survey, unanswered questions about recommending the product could indicate customer dissatisfaction. In this case, the nonresponse can be a new feature indicating a likelihood of customer dissatisfaction.
Remove missing values
The following steps show how to remove rows with missing values in the targeted column(s) in Data Wrangler.
On the Operations panel, select Find and replace, and then select Drop missing values.
Select the Price column.
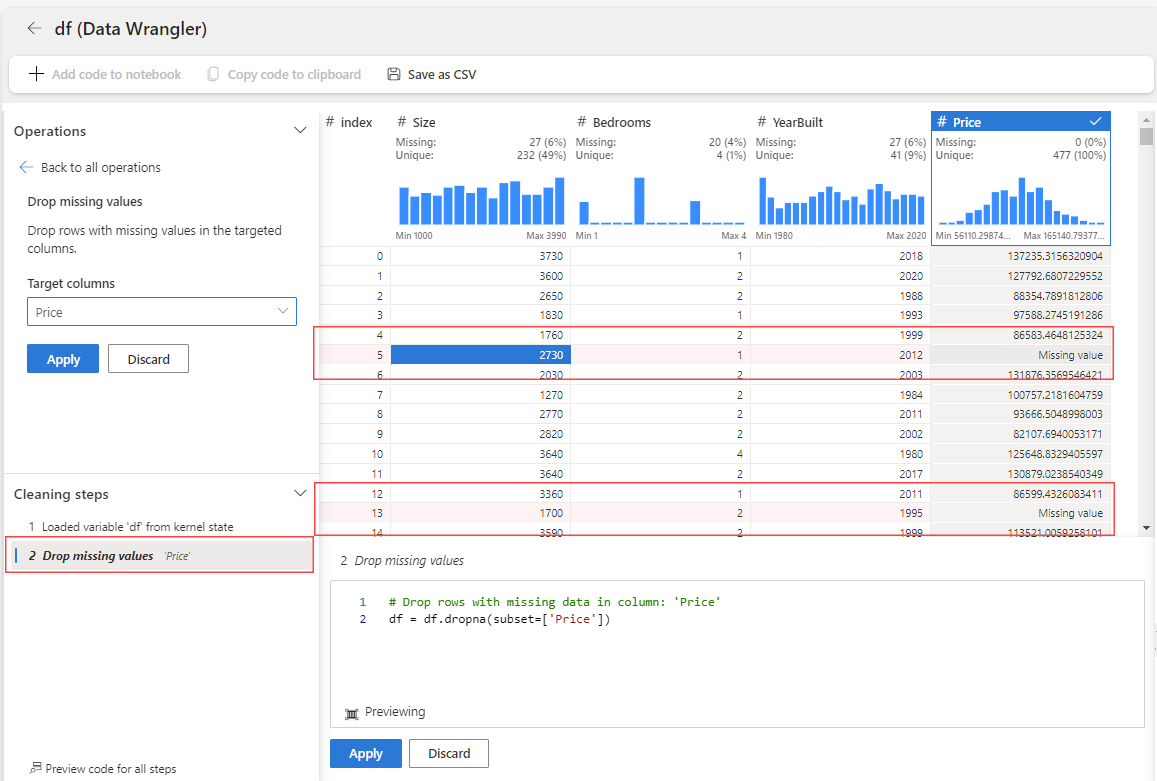
The rows marked for deletion are highlighted in red within the grid, and added to the Cleaning steps panel. This visual cue not only enhances the agility, but also allows for adjustments if needed.
Select Apply. The changes are in effect and the grid applies the step.
Impute missing values
When a dataset has missing data, you can use several imputation methods to fill in those gaps. Each method has its own advantages and is suitable for different types of data and situations.
Understanding these methods can help you choose the most appropriate strategy for handling missing data in your specific context.
| Method | Description |
|---|---|
| Mean | Replaces missing values with the mean (average) value of that variable. It's suitable for continuous data without outliers. |
| Median | Replaces missing values with the median (middle) value of that variable. It's more robust to outliers than the mean. |
| Mode | Replaces missing values with the mode (most frequent) value of that variable. It's suitable for categorical data. |
| Propagate forward | Fills missing values with the previous valid value in the dataset. Also known as forward fill. |
| Propagate backward | Fills missing values with the next valid value in the dataset. Also known as backward fill. |
| Custom value | Replaces missing values with a user-defined constant value. This can be any value that makes sense in the context of the data. |
The following steps show how to fill or impute missing values in the targeted columns using the median, for example.
On the Operations panel, select Find and replace, and then select Fill missing values.
Select the YearBuilt column, and then select the Median fill method.
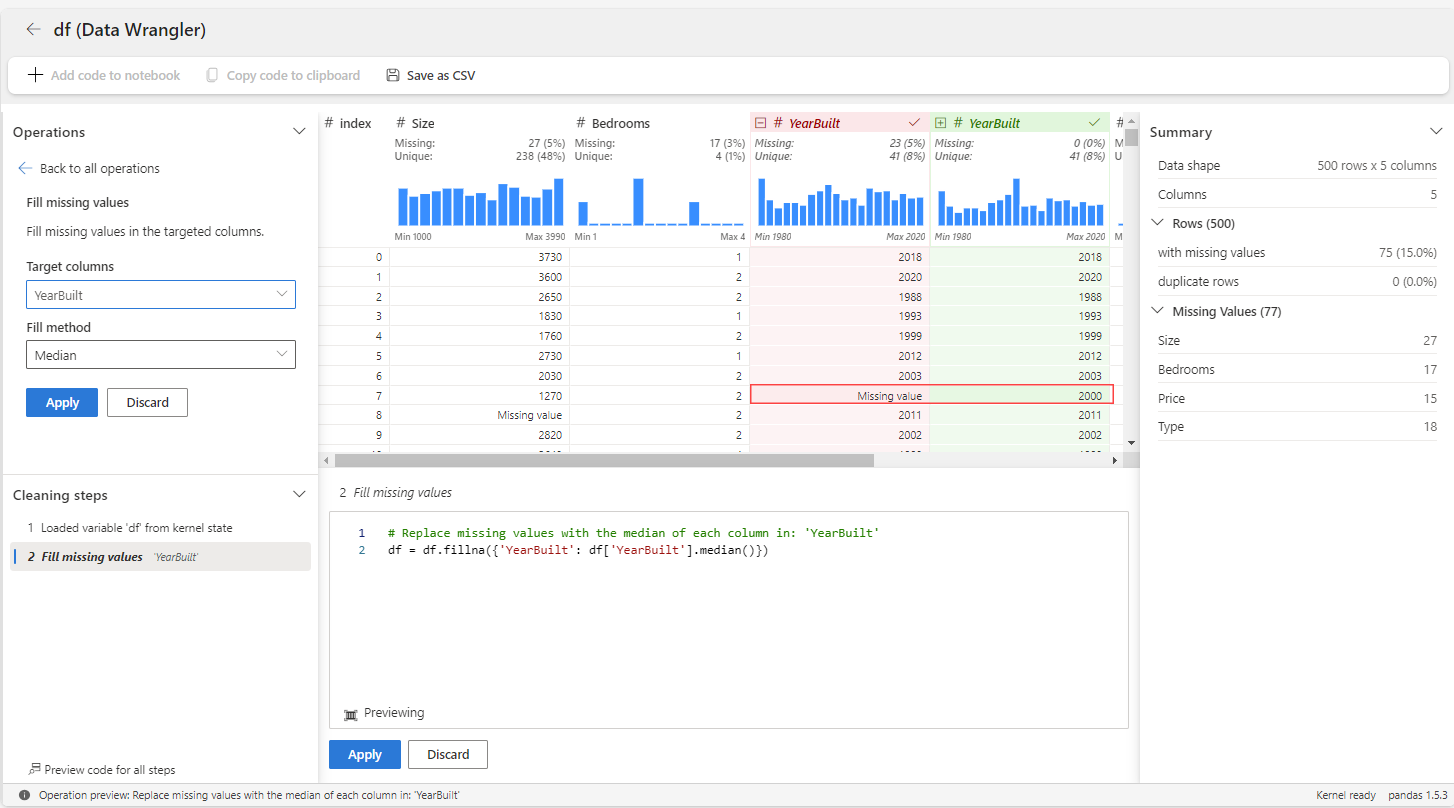
The rows marked for imputation are highlighted in red within the grid, and added to the Cleaning steps panel. This visual cue facilitates real-time modifications when needed.
Select Apply.
The changes are immediately visible in the Data Wrangler’s display grid, providing a real-time view of how the operation affects your dataset.
Alternatively, you can use the Custom operation operator to create your own imputation code.
To learn more about missing data, see Explore data for data science with notebooks in Microsoft Fabric.