Normalize and center the data
Our numeric data comes in a variety of mass units (grams, milligrams, and micrograms) and one energy unit (kilocalories). To make valid comparison of the nutritional data, we need to first normalize the data and make it more normally distributed. That is, we need to make the distribution of the data look more like a familiar bell curve.
To help see why we need to normalize the data, let's look at a histogram of all the columns:
ax = nutr_df.hist(bins=50, xlabelsize=-1, ylabelsize=-1, figsize=(11,11))
The output is:
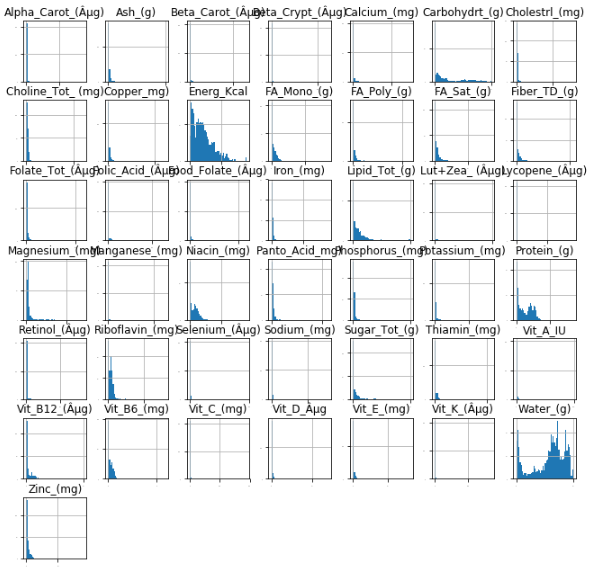
There's no bell curve in sight. Worse, a lot of the data is clustered at or around 0. We'll use the Box-Cox Transformation on the data, but it requires entirely positive input. So we'll add 1 to every value in each column.
nutr_df = nutr_df + 1
Now for the transformation. The Box-Cox Transformation performs the transformation $y(\lambda) = \dfrac{y^{\lambda}-1}{\lambda}$ for $\lambda \neq 0$ and $y(\lambda) = log y$ for $\lambda = 0$ for all values $y$ in a column. SciPy has a particularly useful boxcox() function that can automatically calculate the $\lambda$ for each column that best normalizes the data in that column.
Note
The transformation doesn't support NaN values. The scikit-learn library has a comparable boxcox() function that is NaN-safe. But that function is not available on the version of scikit-learn that you likely installed with your Jupyter Notebooks with Visual Studio Code.
from scipy.stats import boxcox
nutr_df_TF = pd.DataFrame(index=nutr_df.index)
for col in nutr_df.columns.values:
    nutr_df_TF['{}_TF'.format(col)] = boxcox(nutr_df.loc[:, col])[0]
Now, let's take a look at the DataFrame that contains the transformed data:
ax = nutr_df_TF.hist(bins=50, xlabelsize=-1, ylabelsize=-1, figsize=(11,11))
The output is:
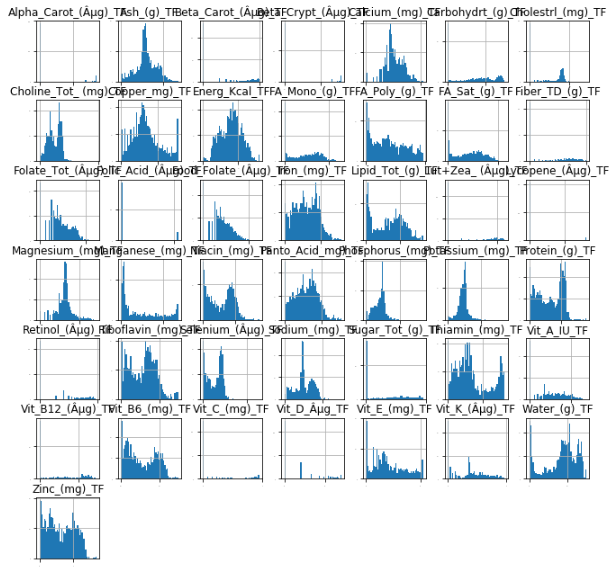
Few of these columns look typical, but it's enough to now center the data.
Our data units were incompatible to begin with, and the transformations have not improved that. But we can address that by centering the data around 0. We will again transform the data, this time so that every column has a mean of 0 and a standard deviation of 1. The scikit-learn library has a convenient function for this:
nutr_df_TF = StandardScaler().fit_transform(nutr_df_TF)
You can satisfy yourself that the data is now centered by using the mean() method on the array:
print("mean: ", np.round(nutr_df_TF.mean(), 2))
The output is:
mean: -0.0
Try it yourself
Find the standard deviation for nutr_df_TF. If you need a hint for which method to use, see the pandas documentation.
The correct code to use here is print("s.d.: ", np.round(nutr_df_TF.std(), 2)).
The output is:
s.d.: 1.0