Import a report to your workspace
In this exercise, you assume the role of Jessie and follow these steps to import a sample Microsoft Power BI report to your workspace.
In a new Incognito or InPrivate browser session, sign in to your Microsoft Power BI home page with the credentials of Jessie Irwin. If asked, reset the password and provide authentication.
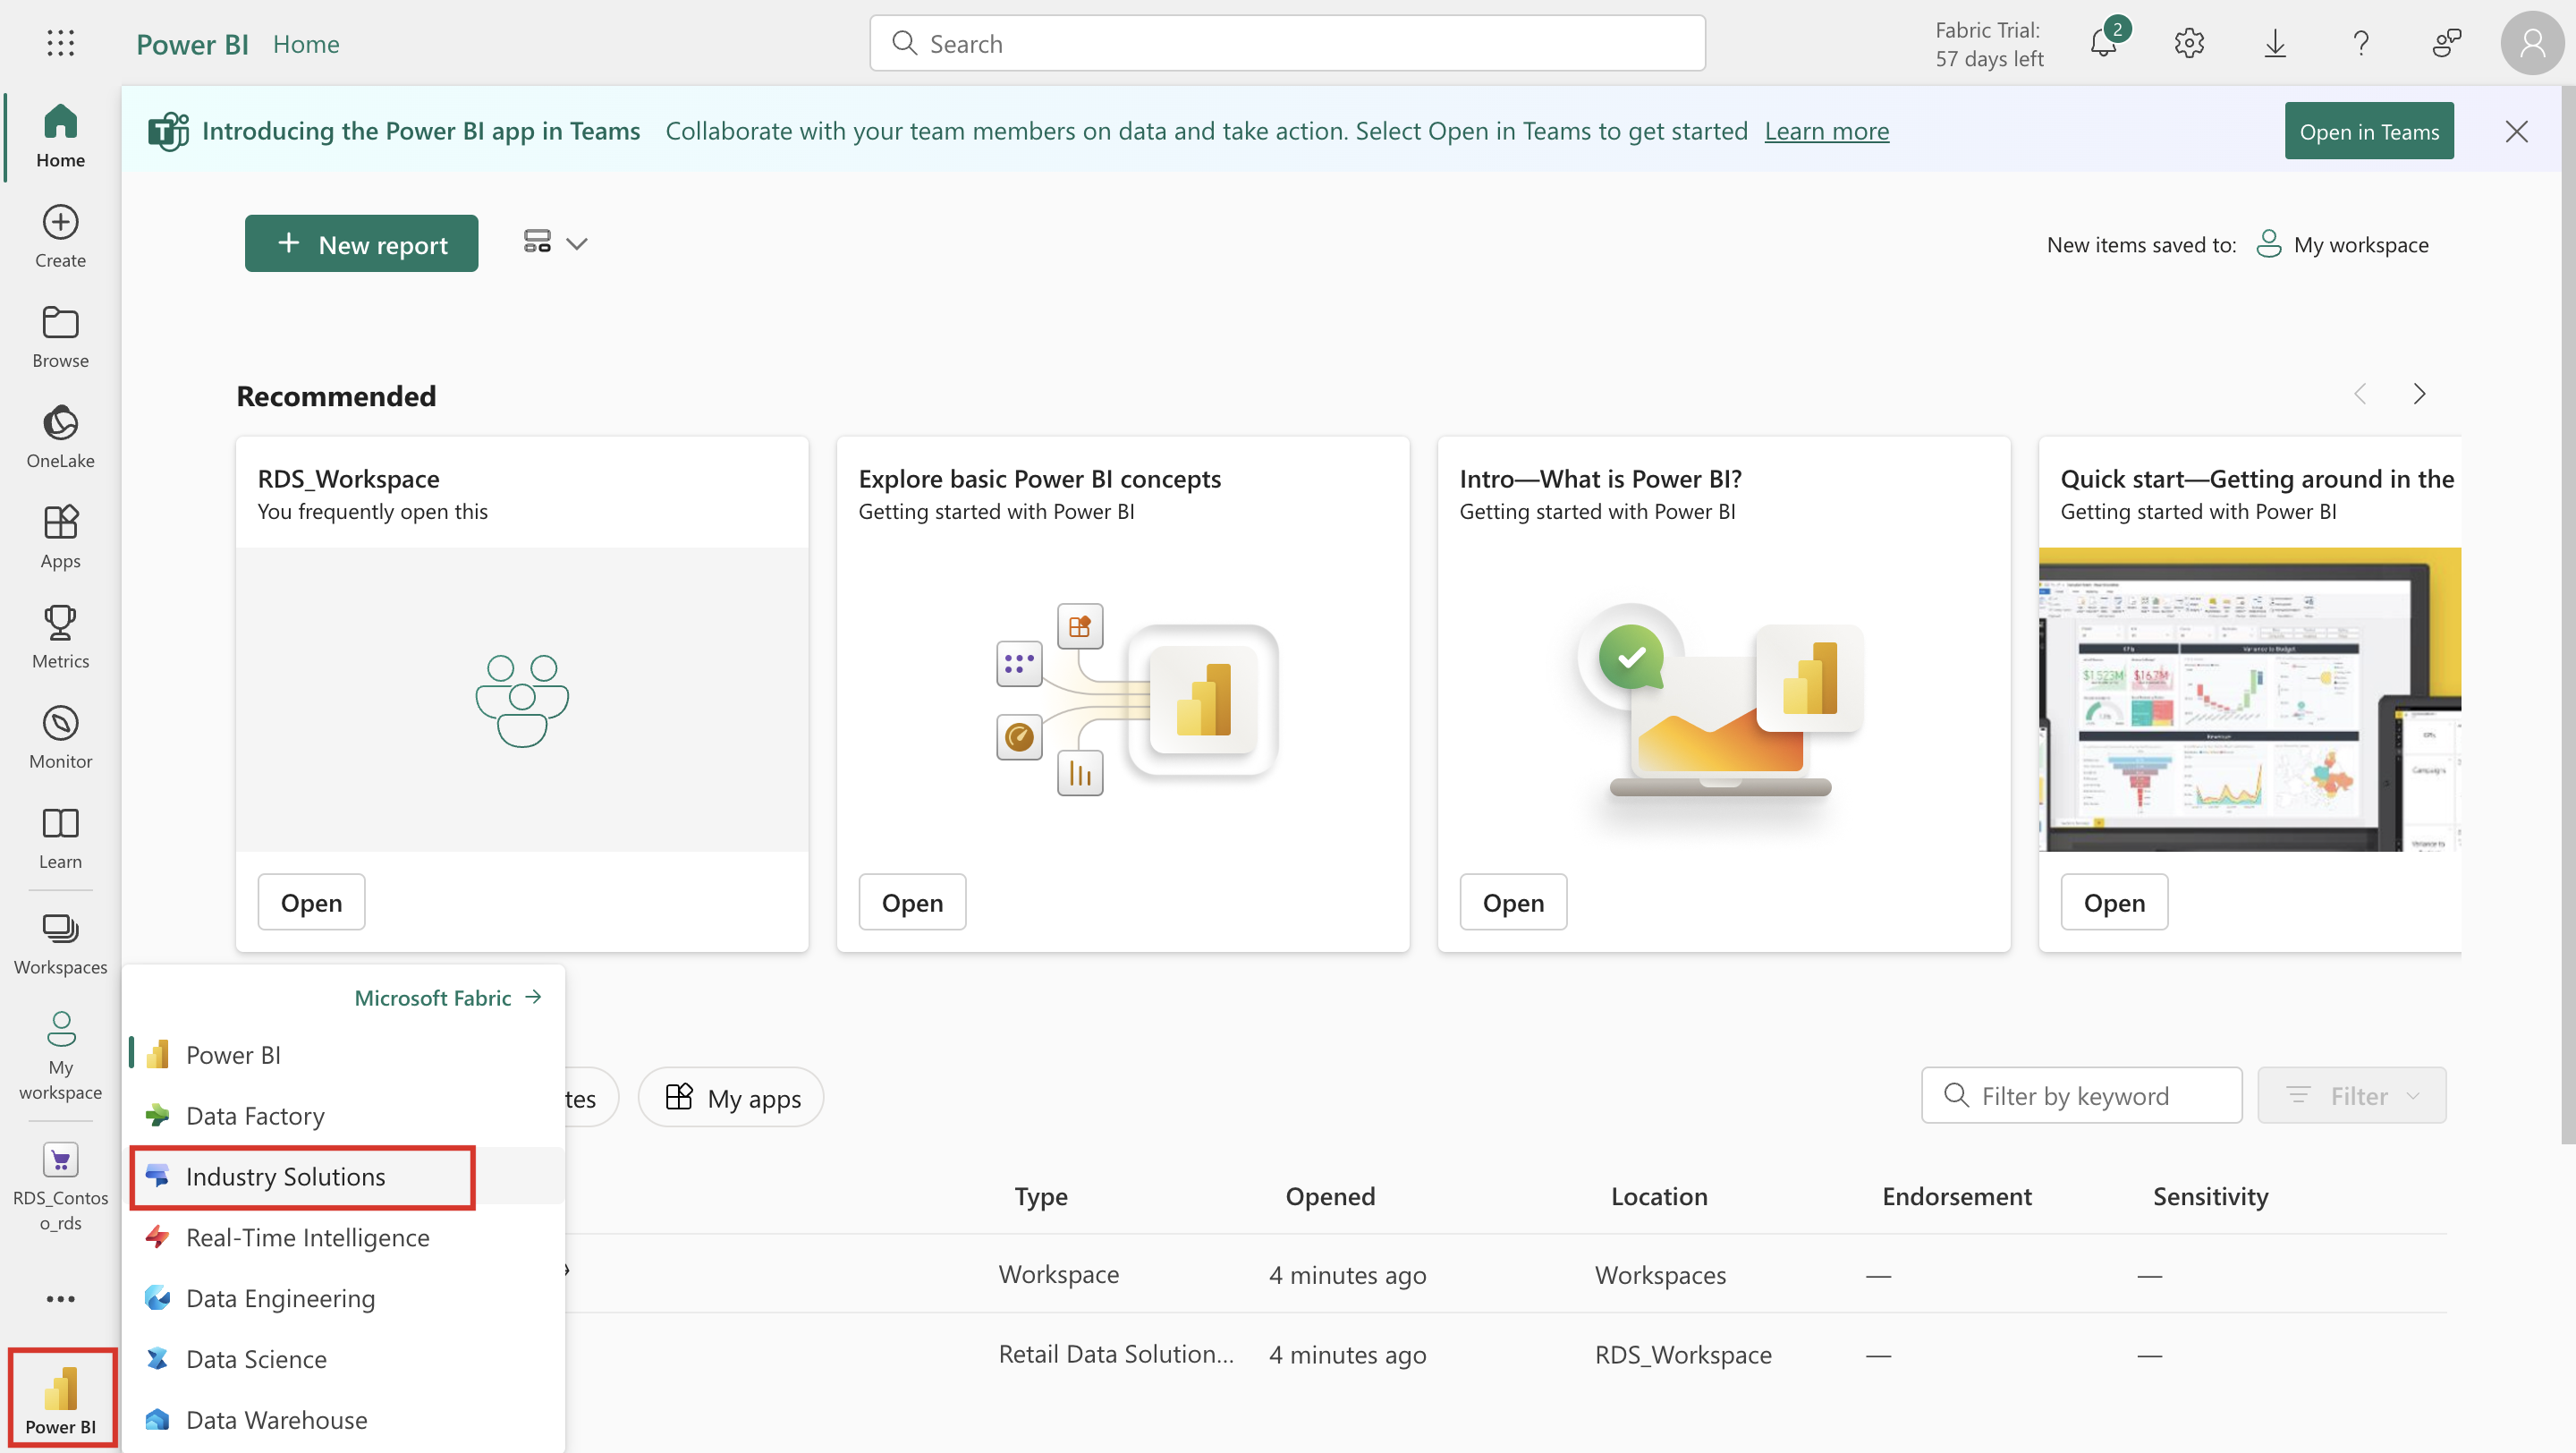
From the lower left, select the Power BI icon and then select Industry Solutions from the list.
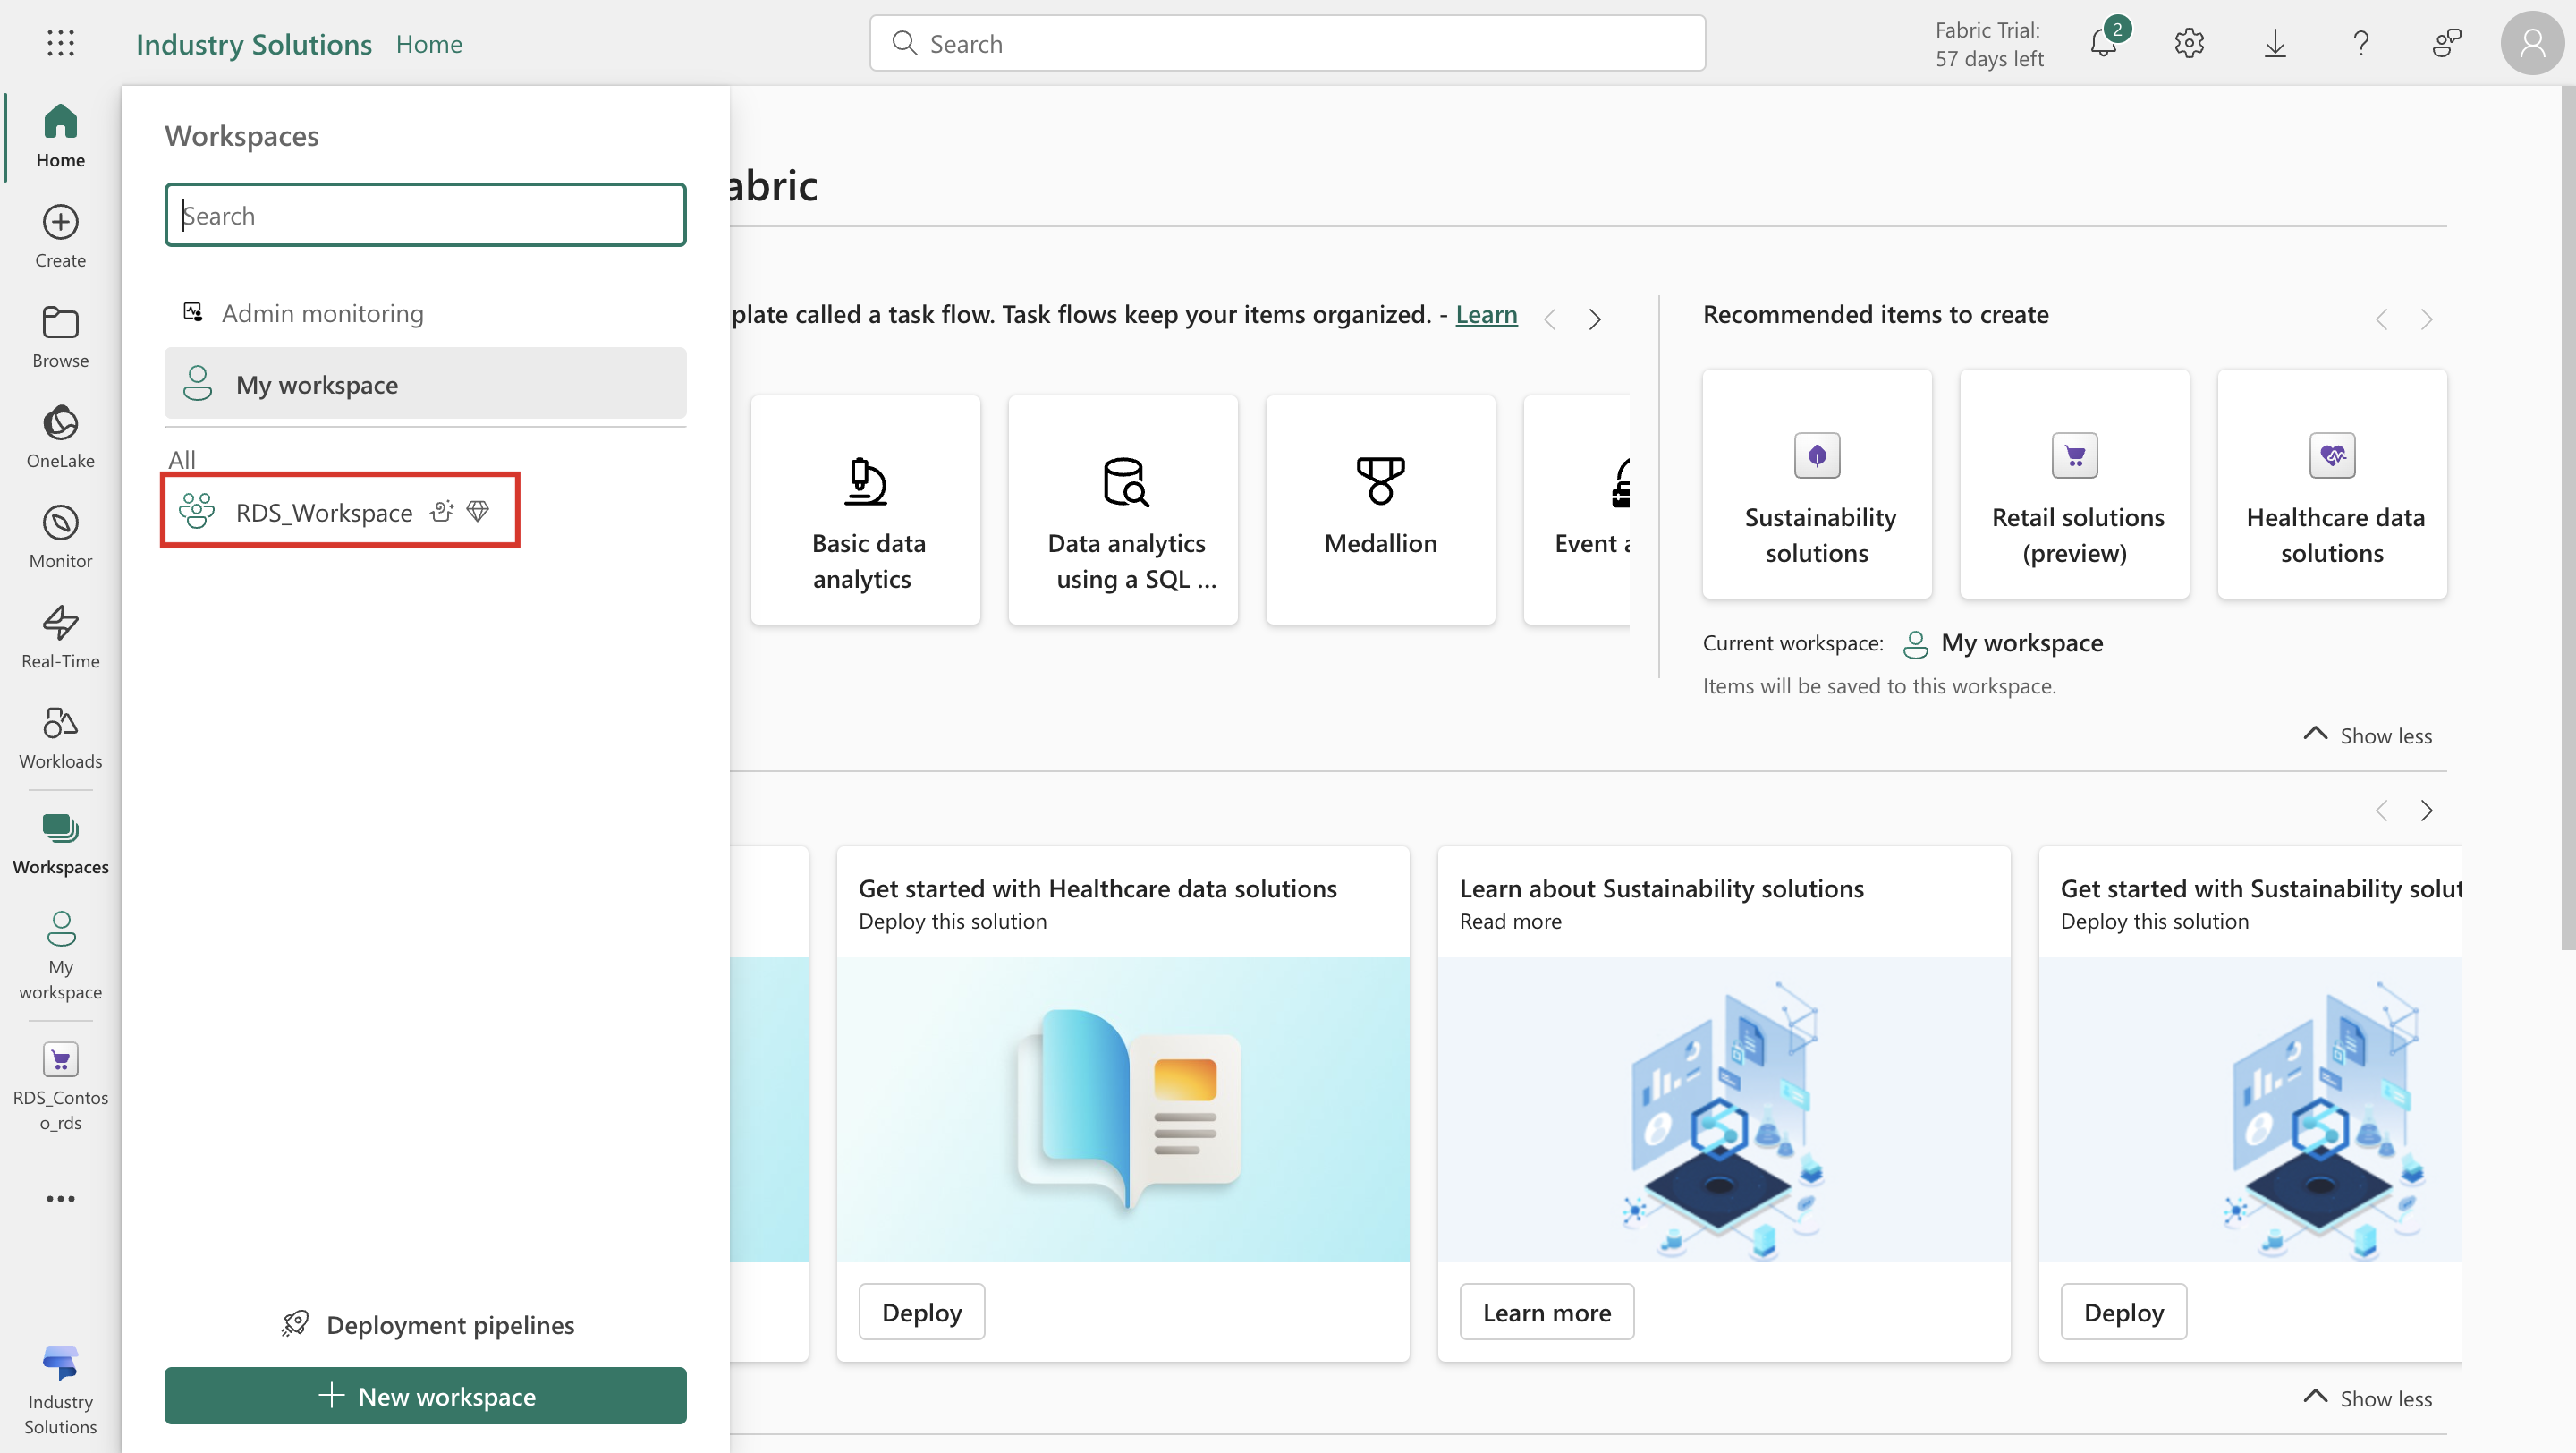
From the left navigation pane, select Workspaces and then select RDS_Workspace. The system redirects you to RDS_Workspace.
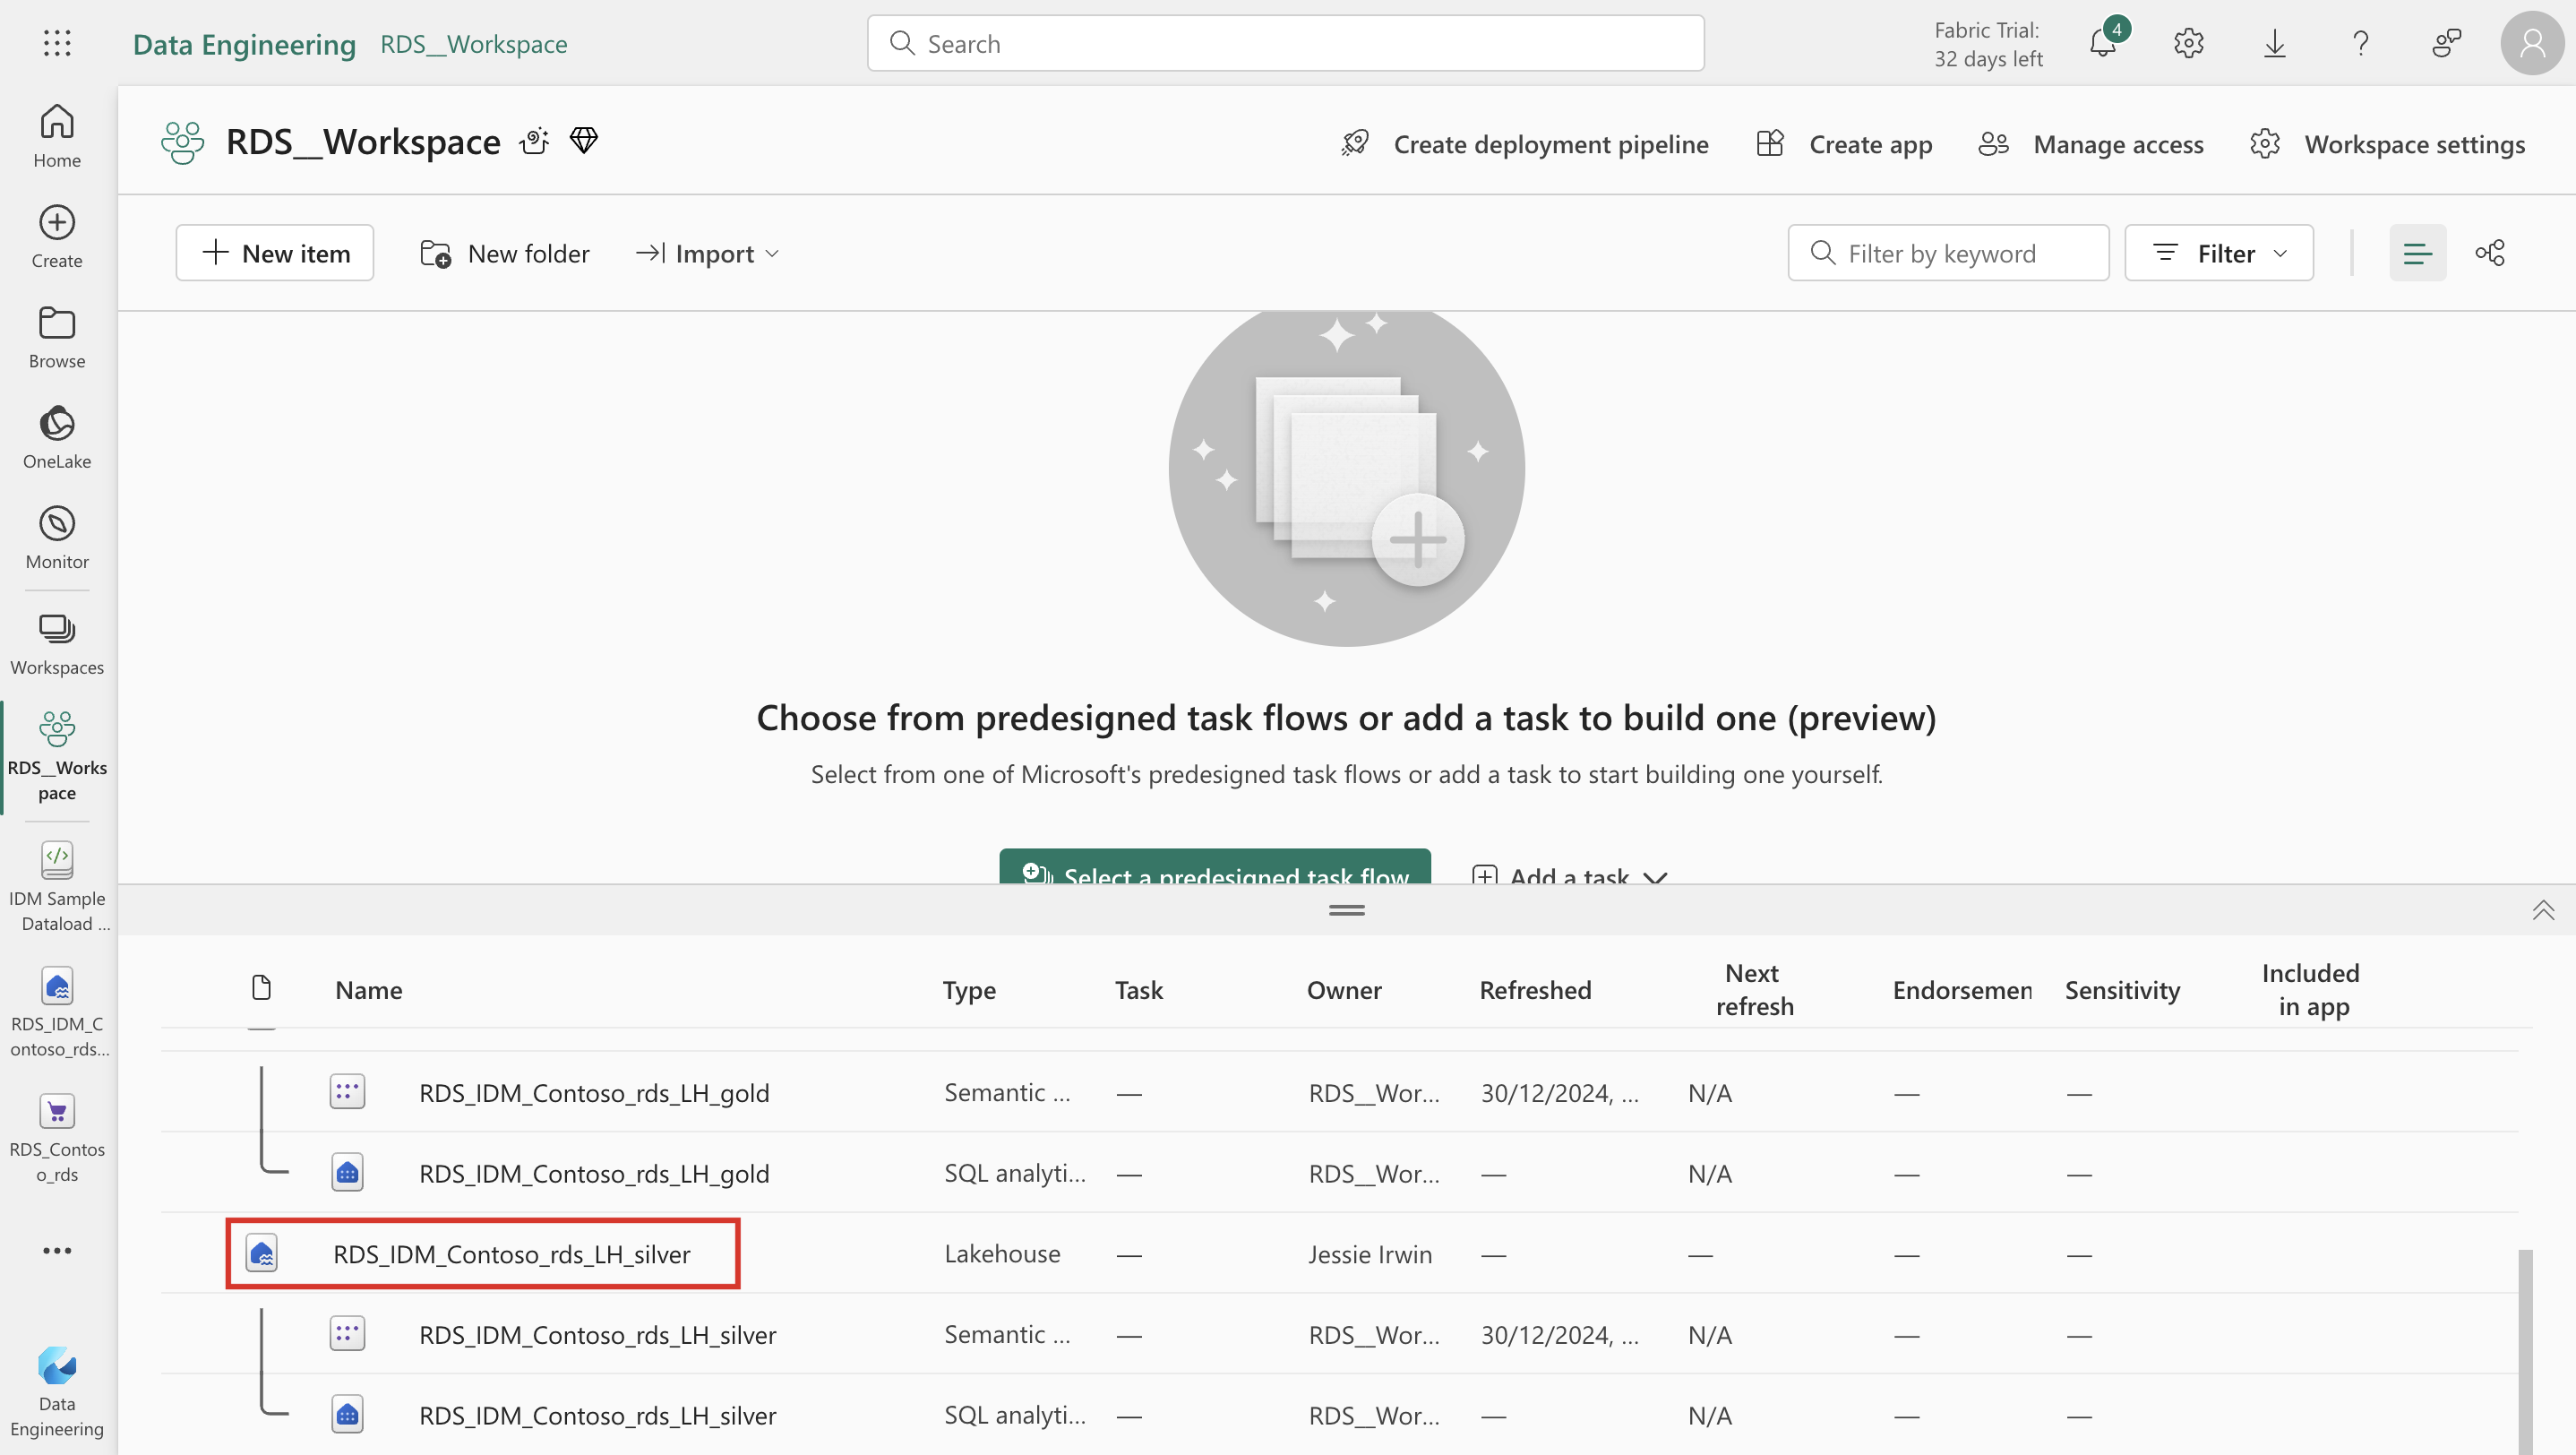
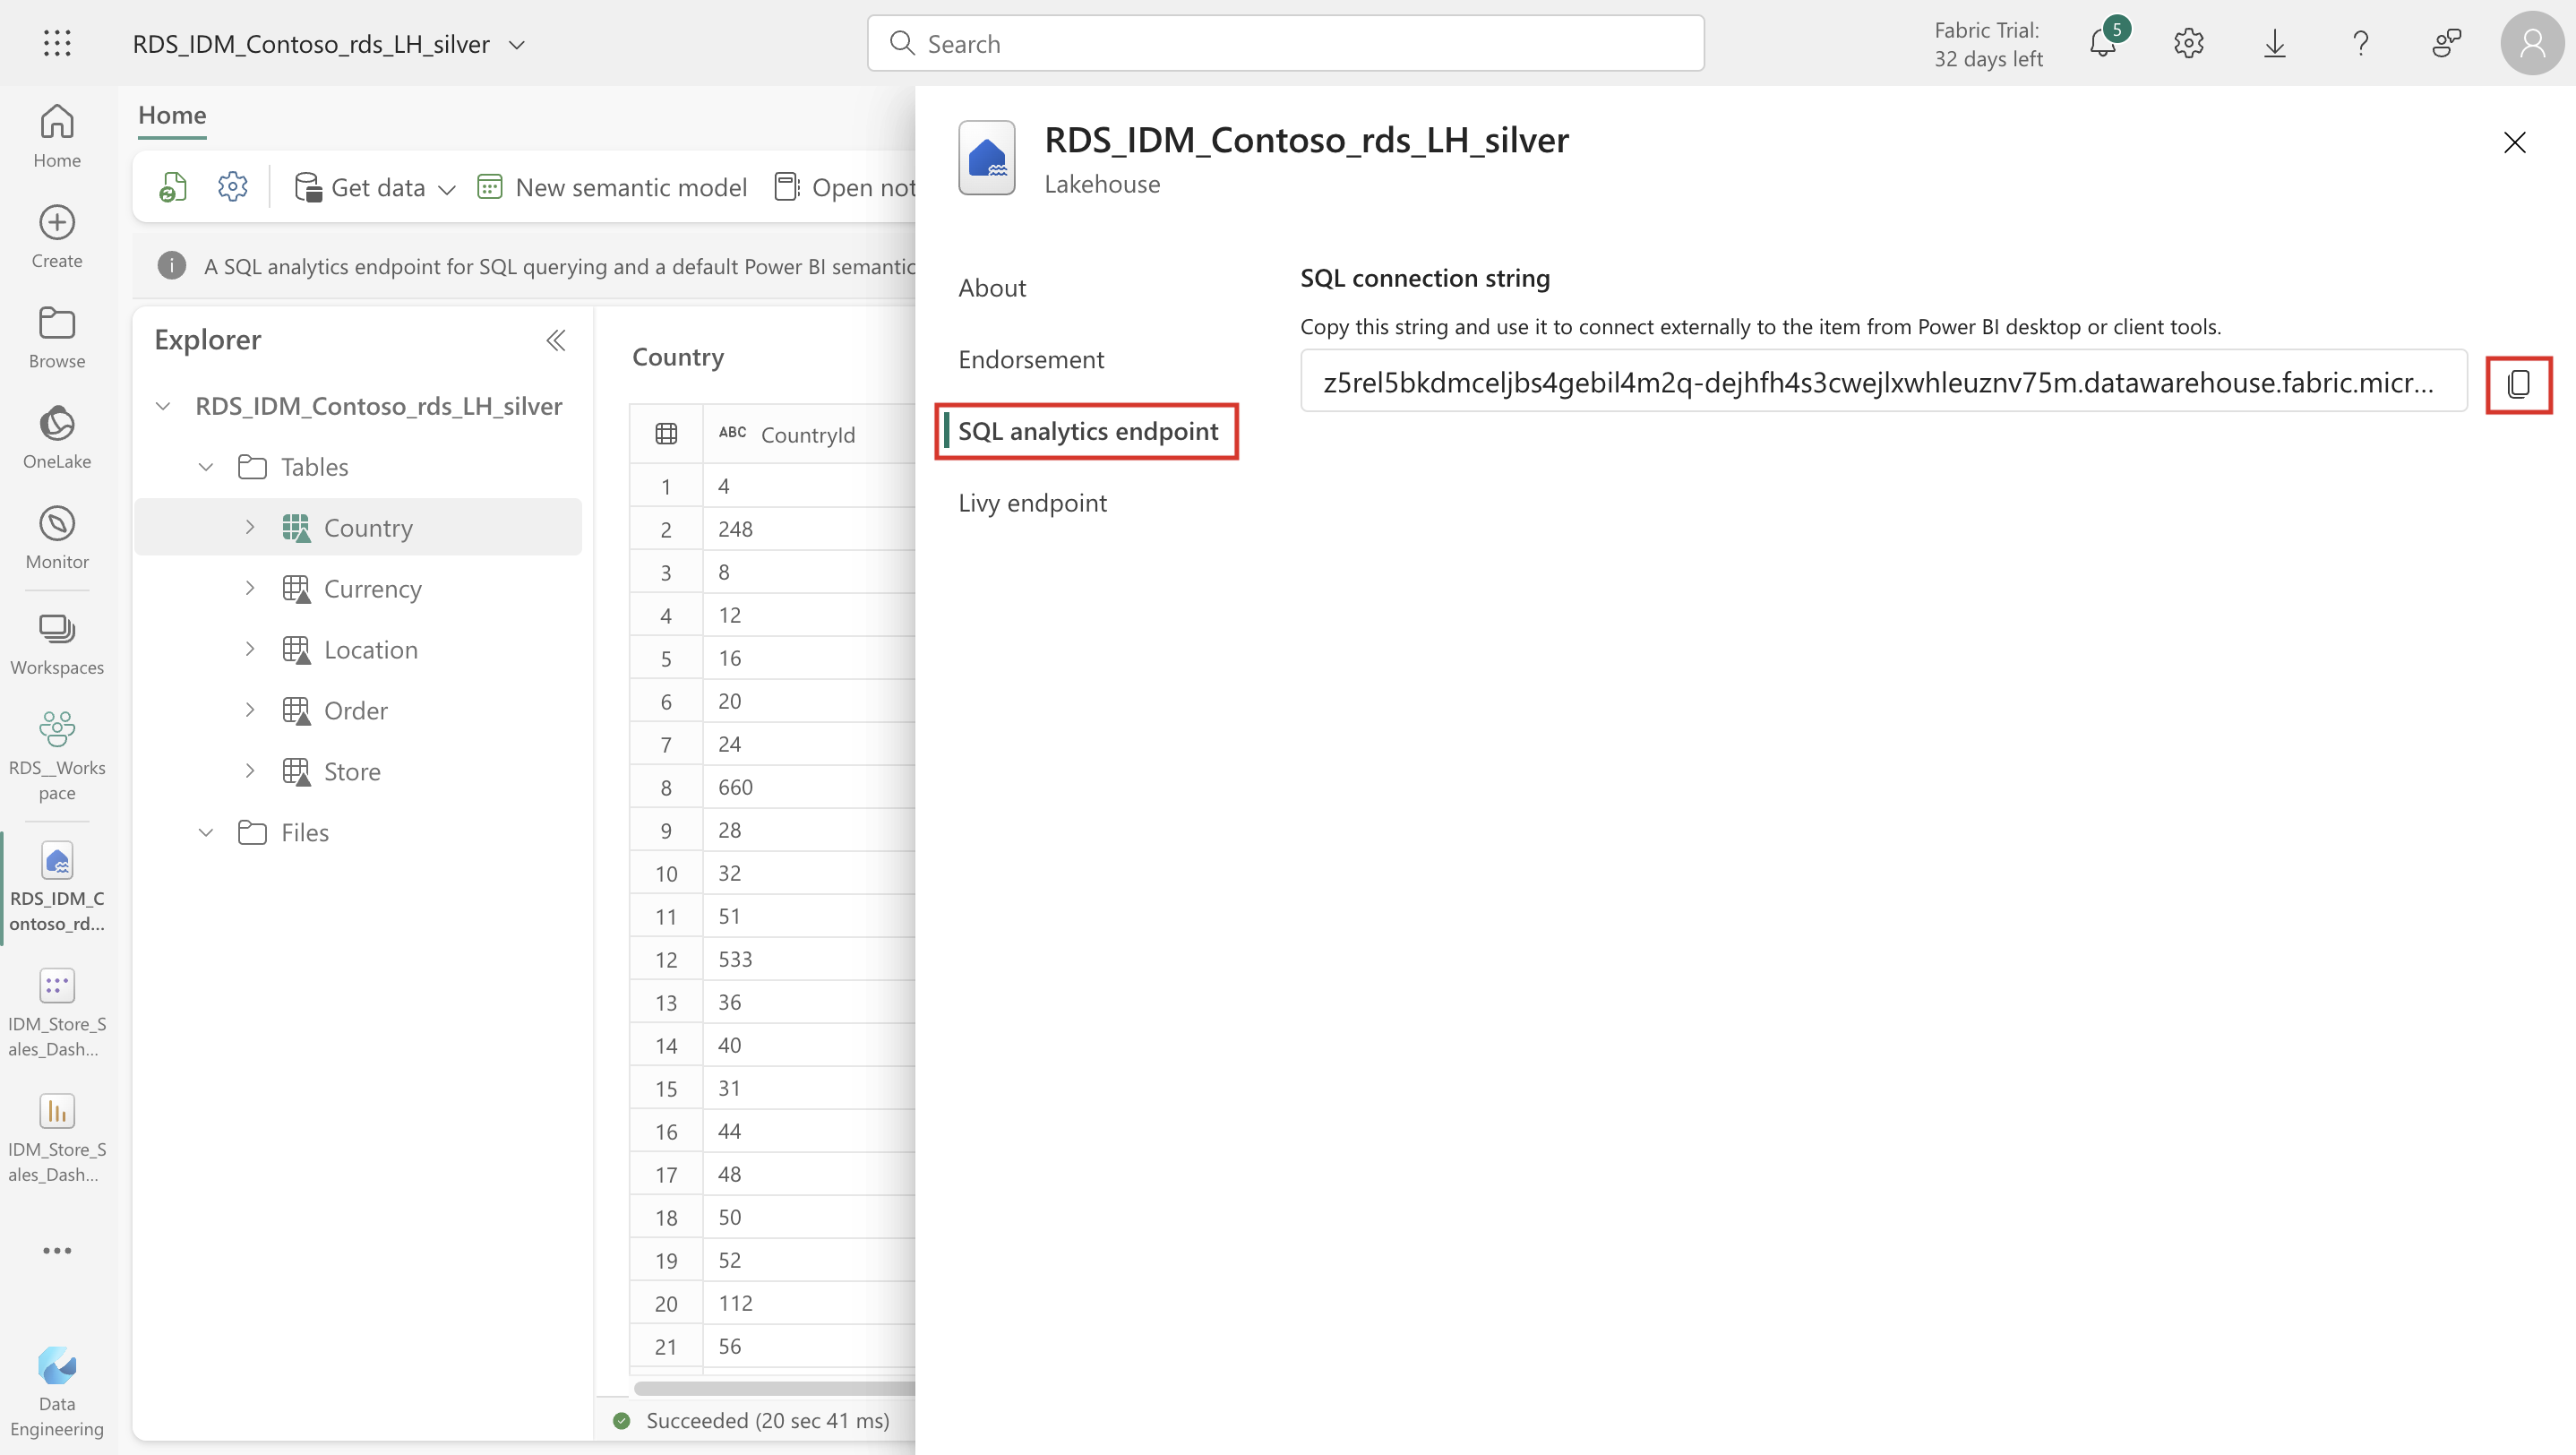
Select RDS_IDM_Contoso_rds_LH_silver.
Select the Settings icon.
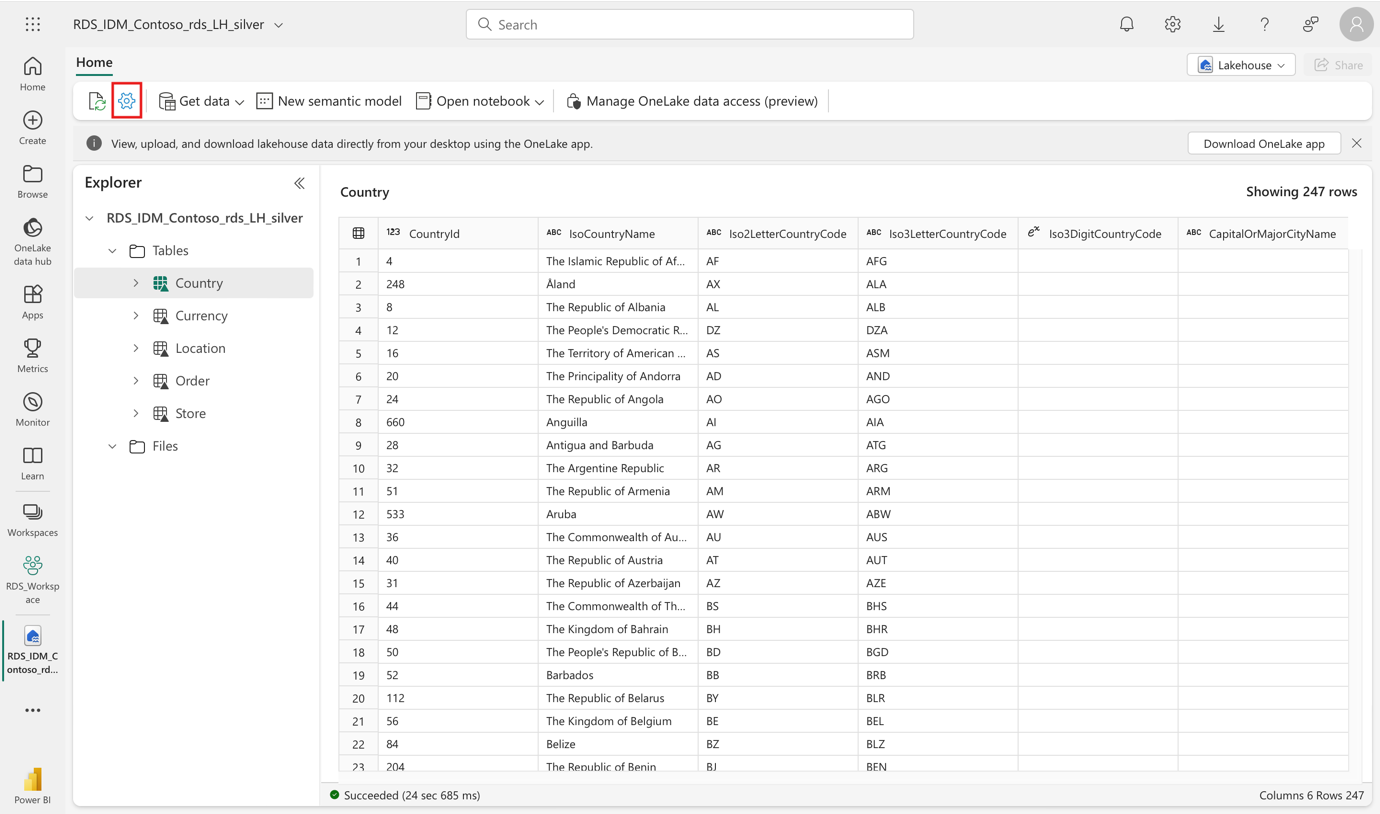
Copy the name of the lakehouse and then save it in a notepad. Select SQL analytics endpoint. Copy the SQL connection string and then save it in a notepad as well.
Important
Keep the browser with Settings tab open because you return to it after you import the report by using Power BI Desktop.
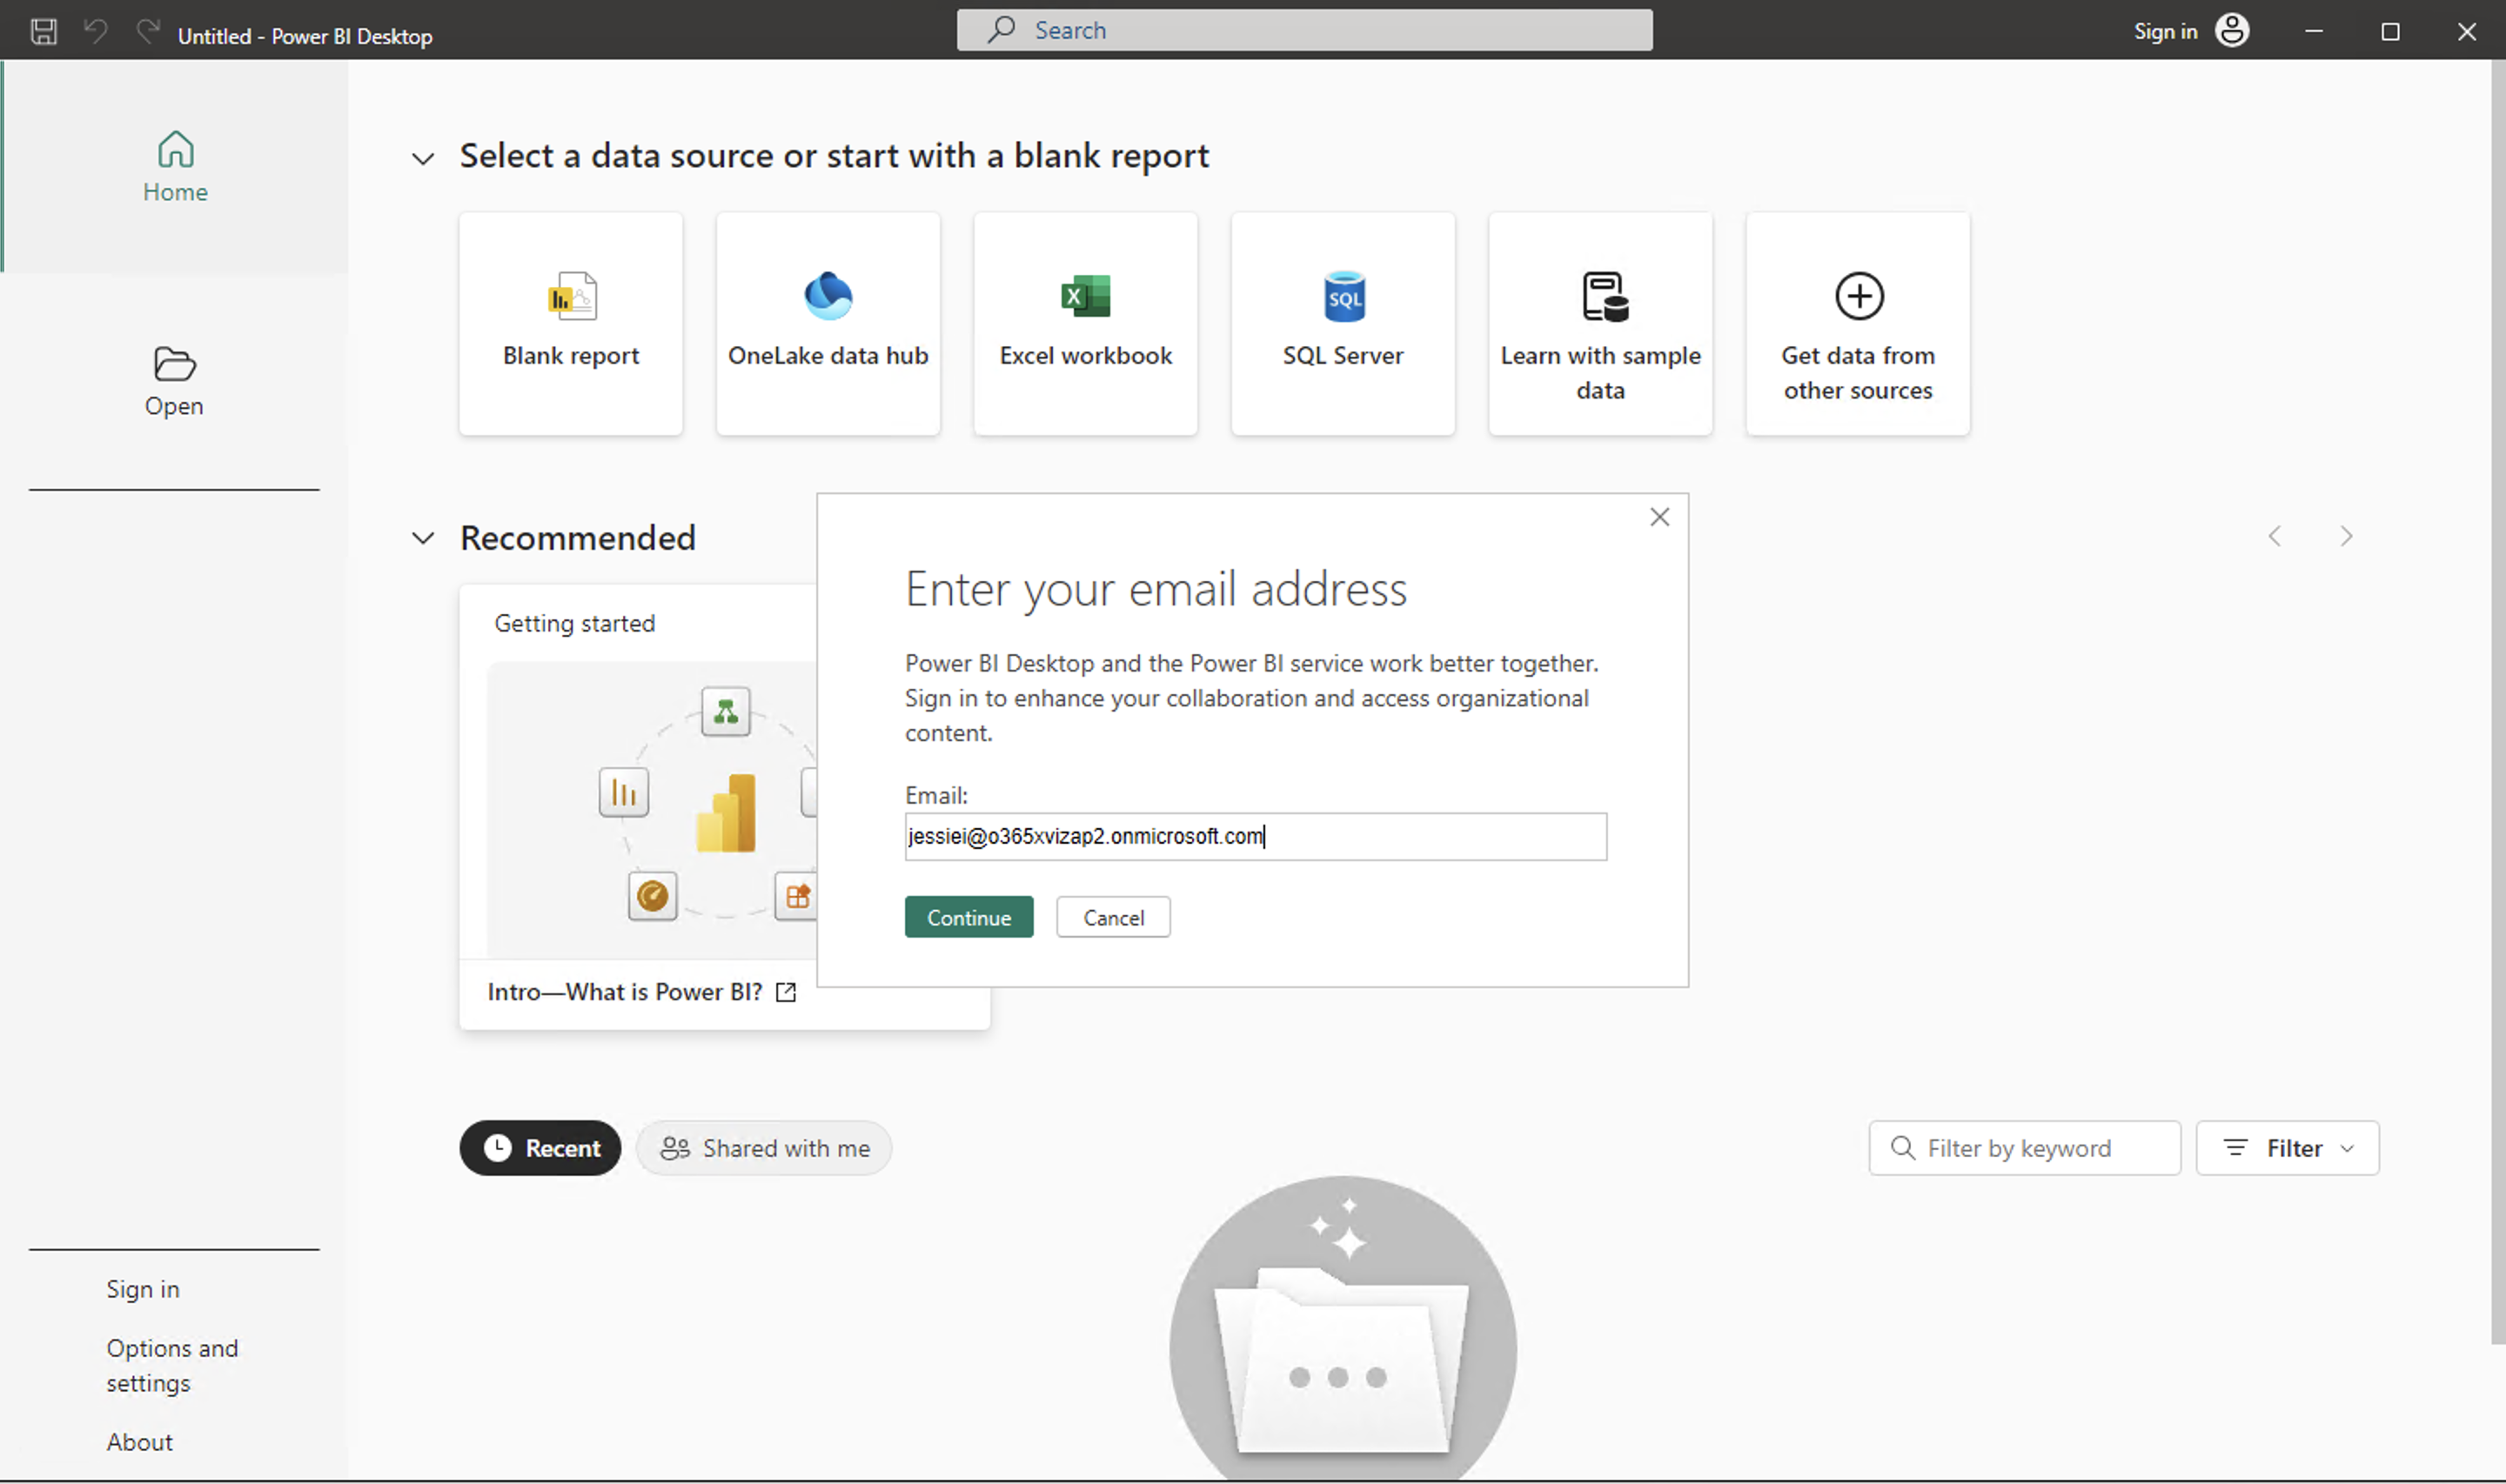
Open Power BI Desktop and sign in as Jessie Irwin.
Download the [IDM_Store_Sales_Dashboard.pbix] file.
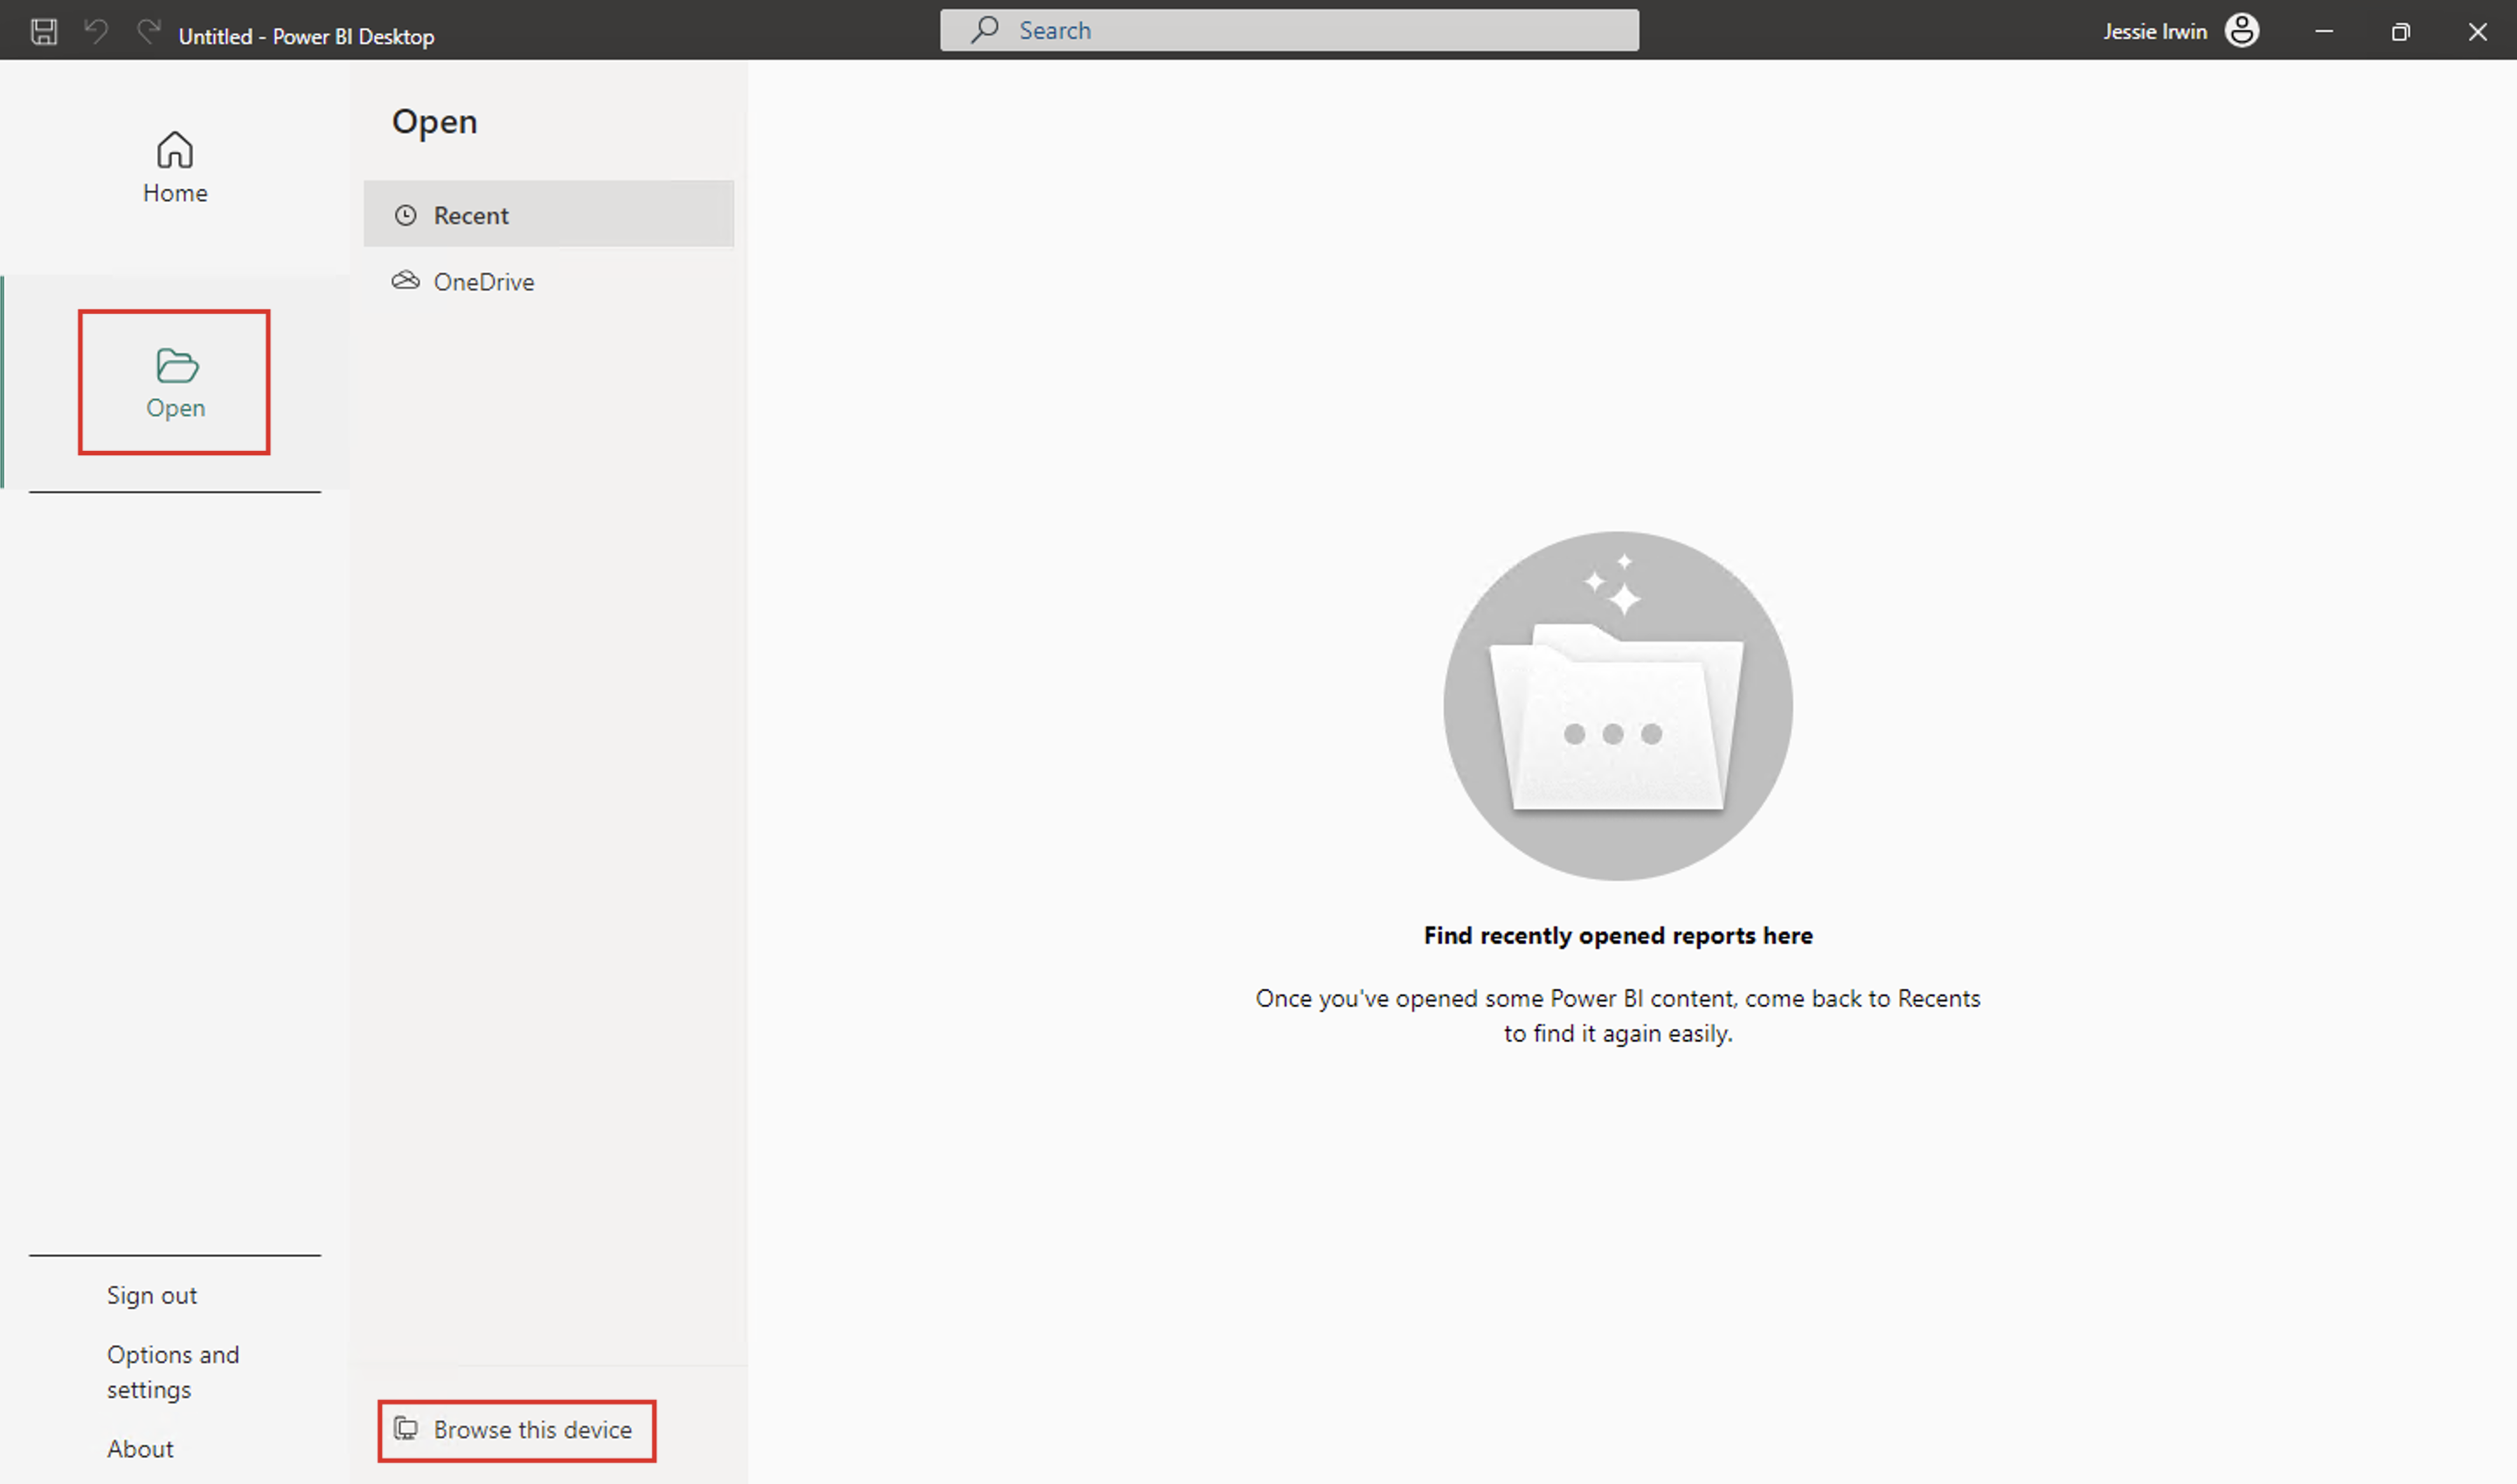
Select Open and then select Browse this device. Open the downloaded report.
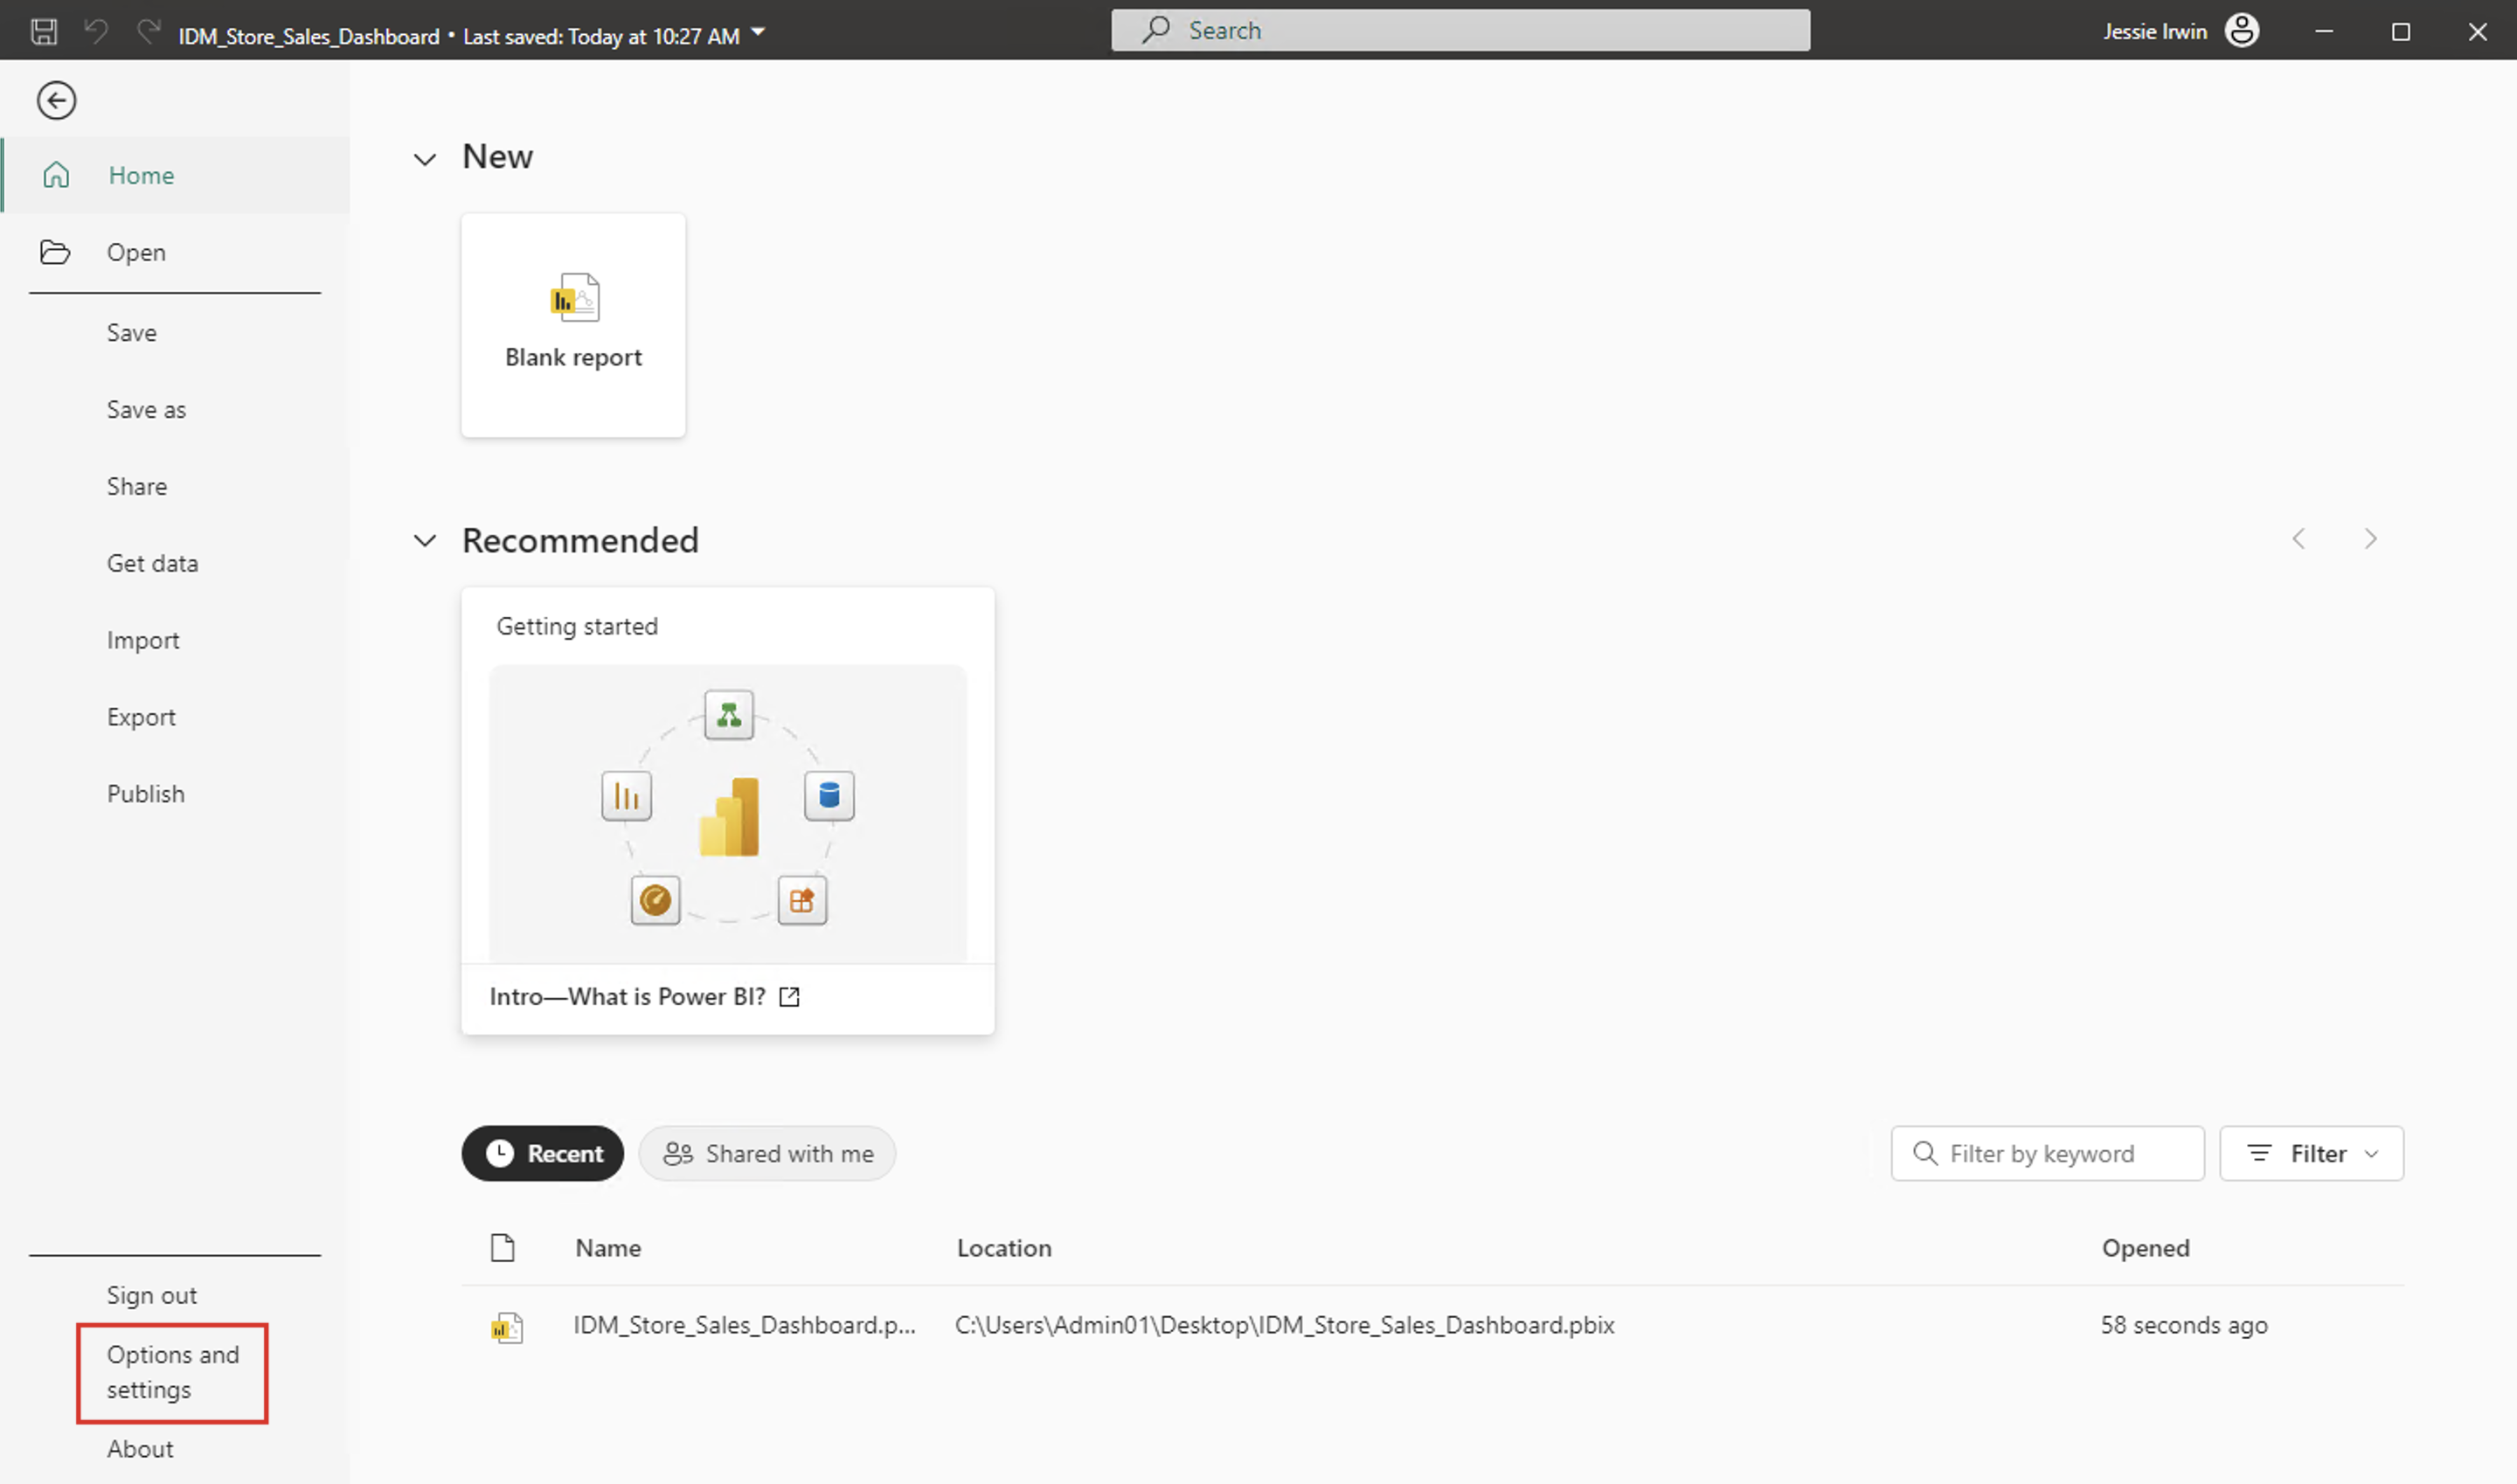
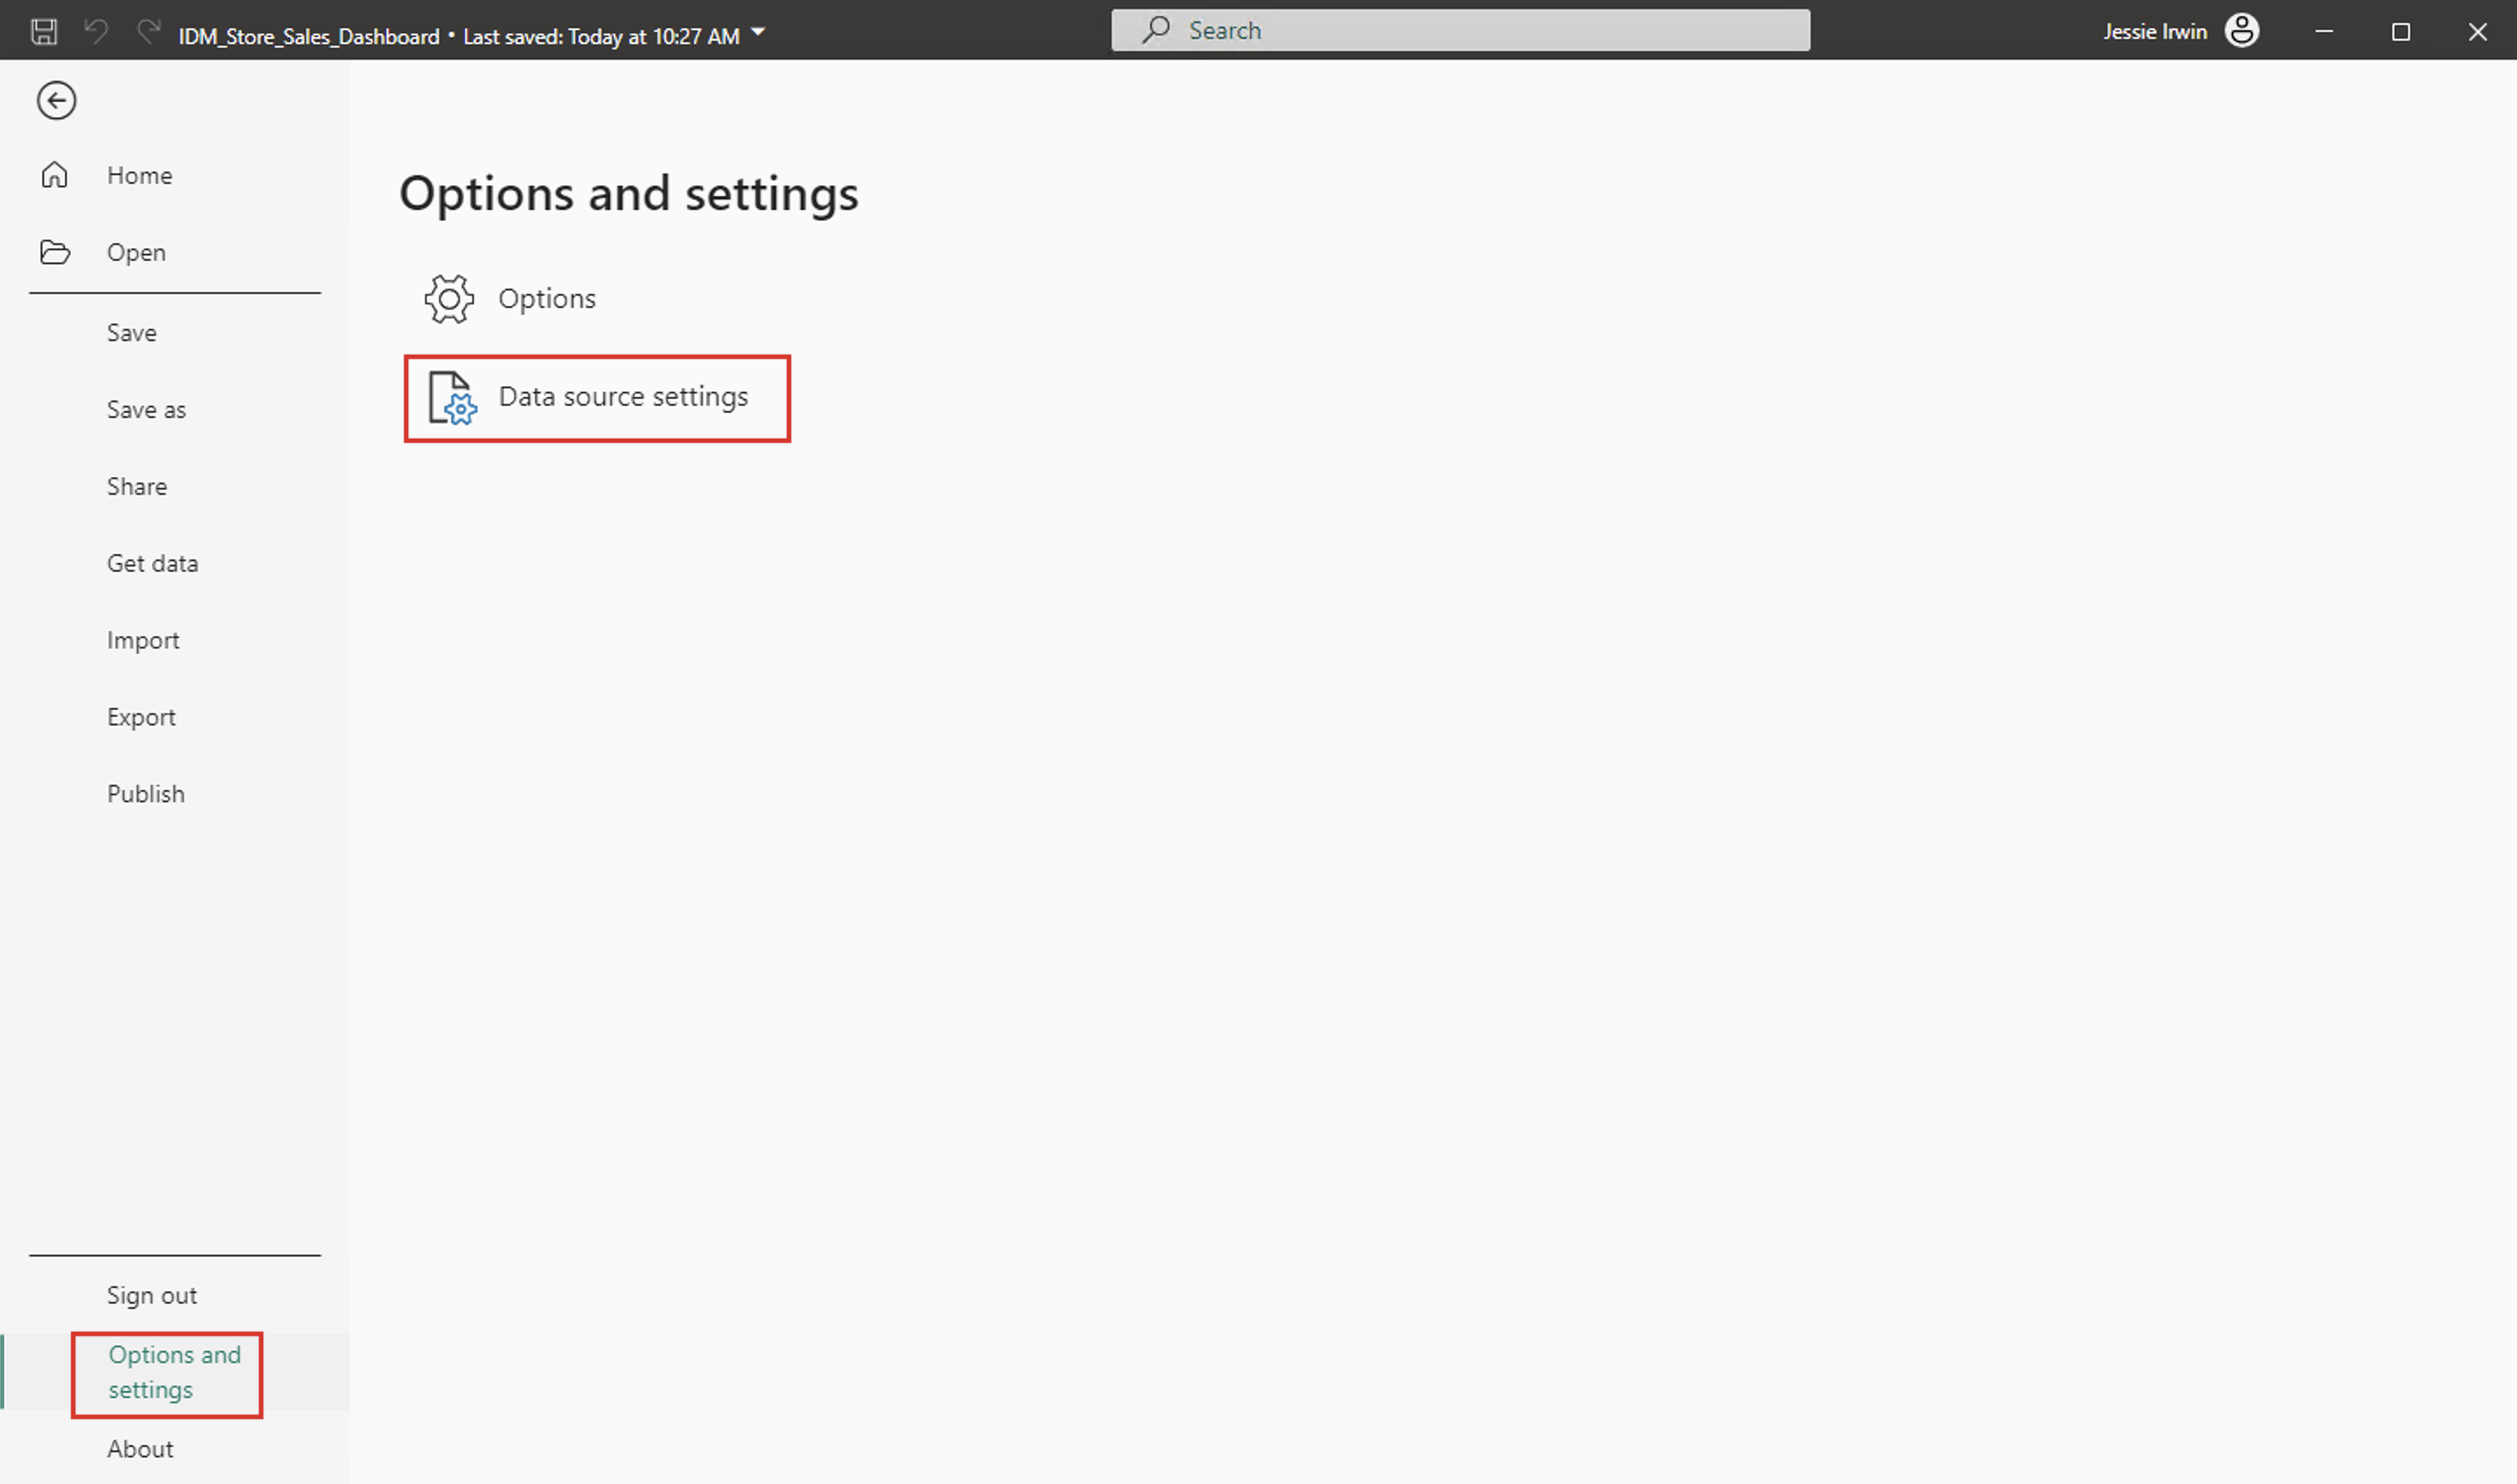
Select Files from the upper bar and then select Options and settings from the lower left.
Select Data source settings.
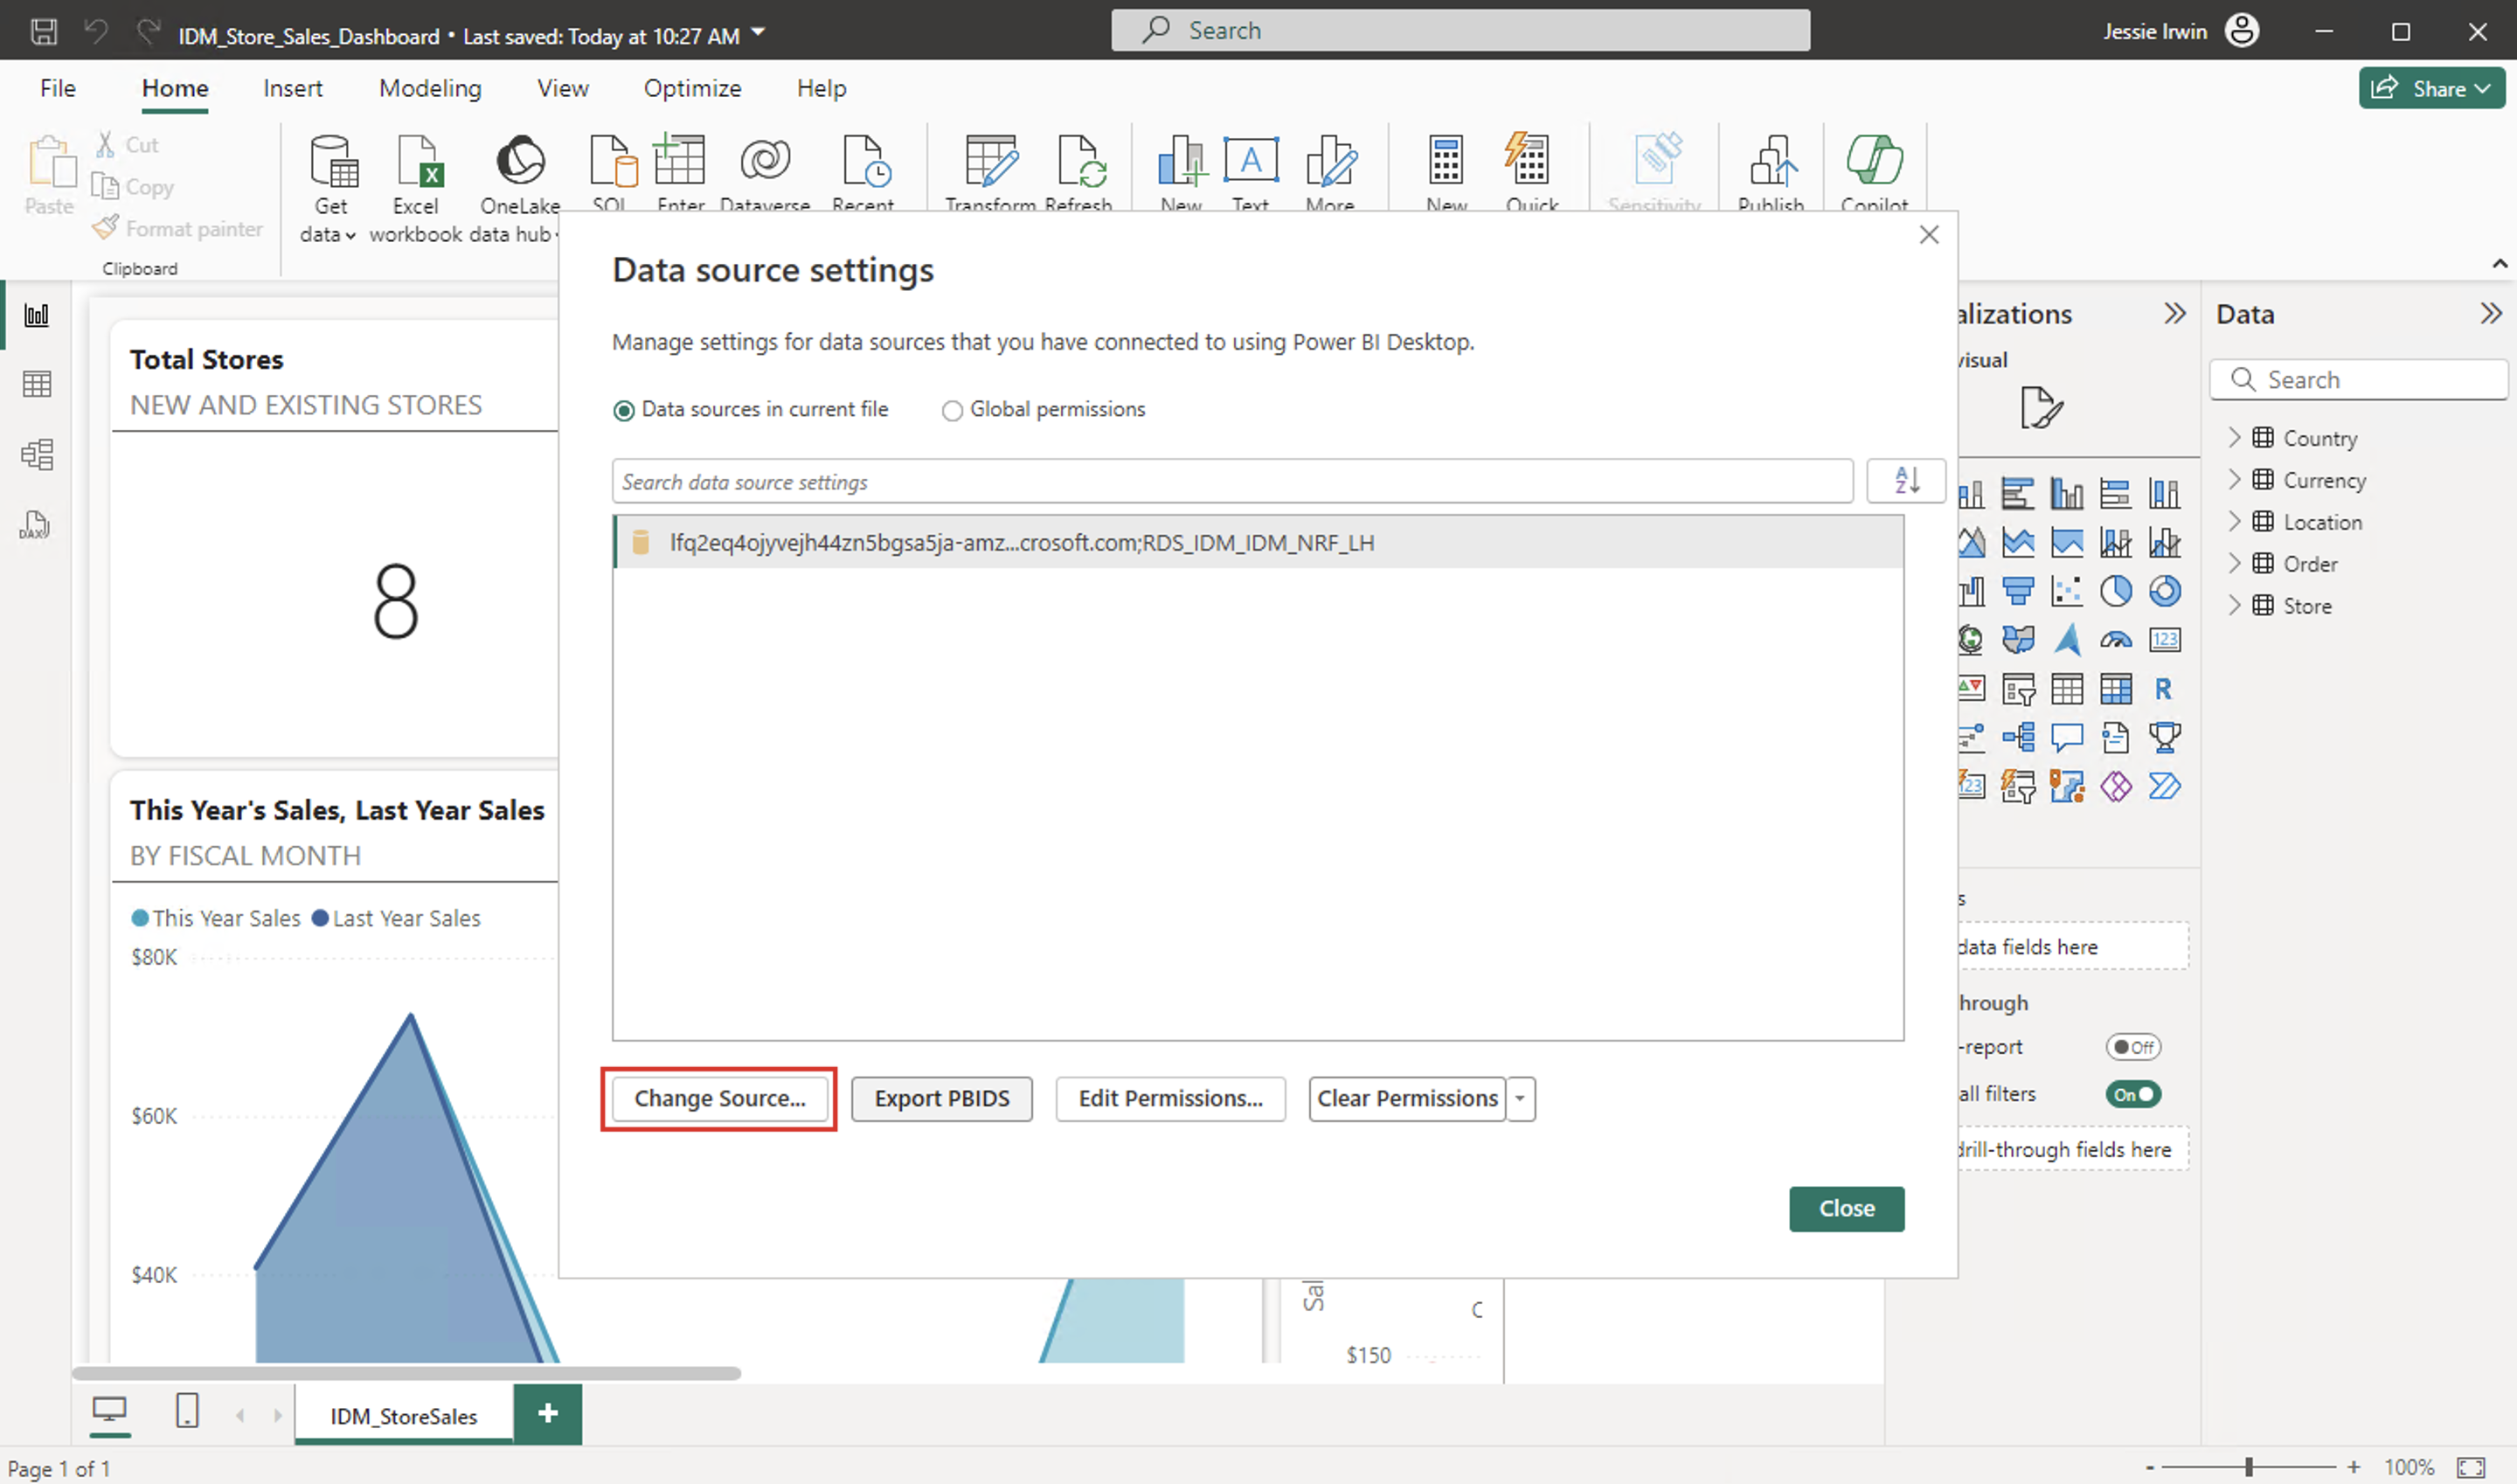
On the Data source settings dialog, select Change Source.
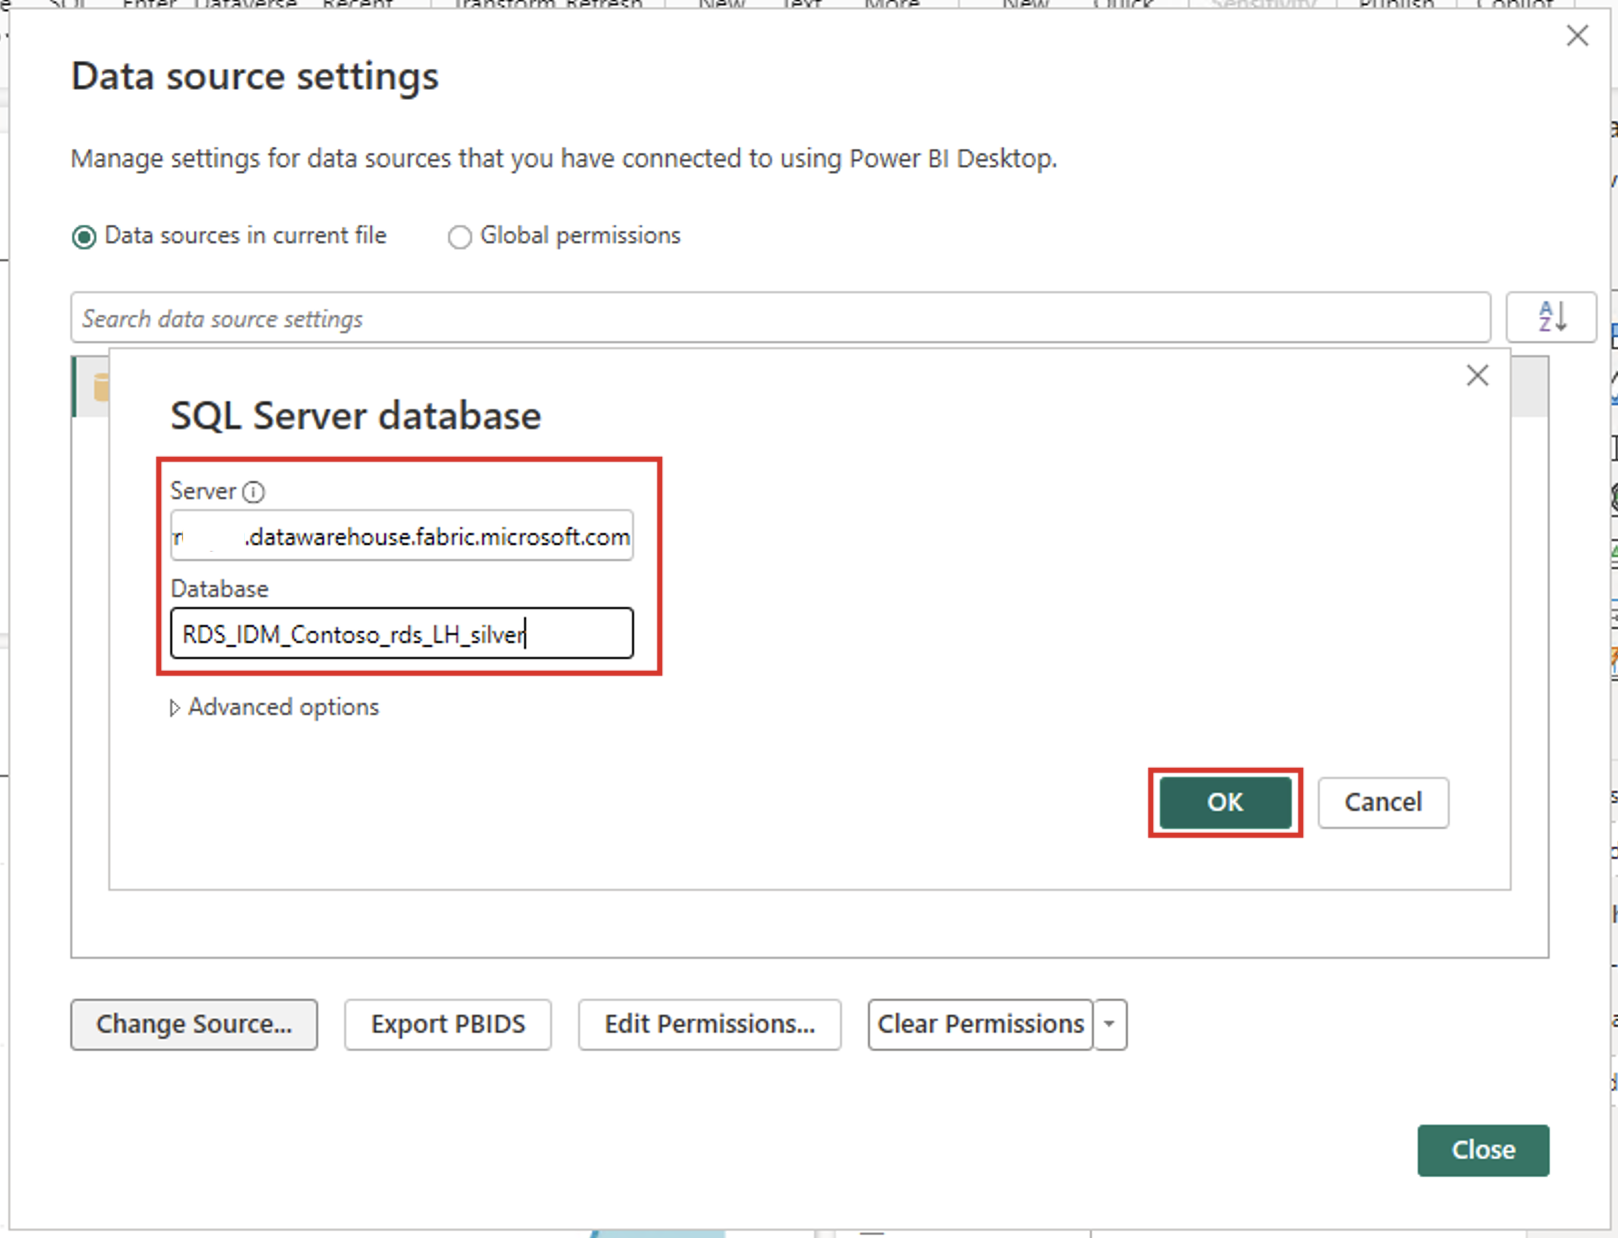
In the Server field, paste the SQL connection string that you copied and saved in the notepad. In the Database field, paste the name of the lakehouse. When you're done, select OK.
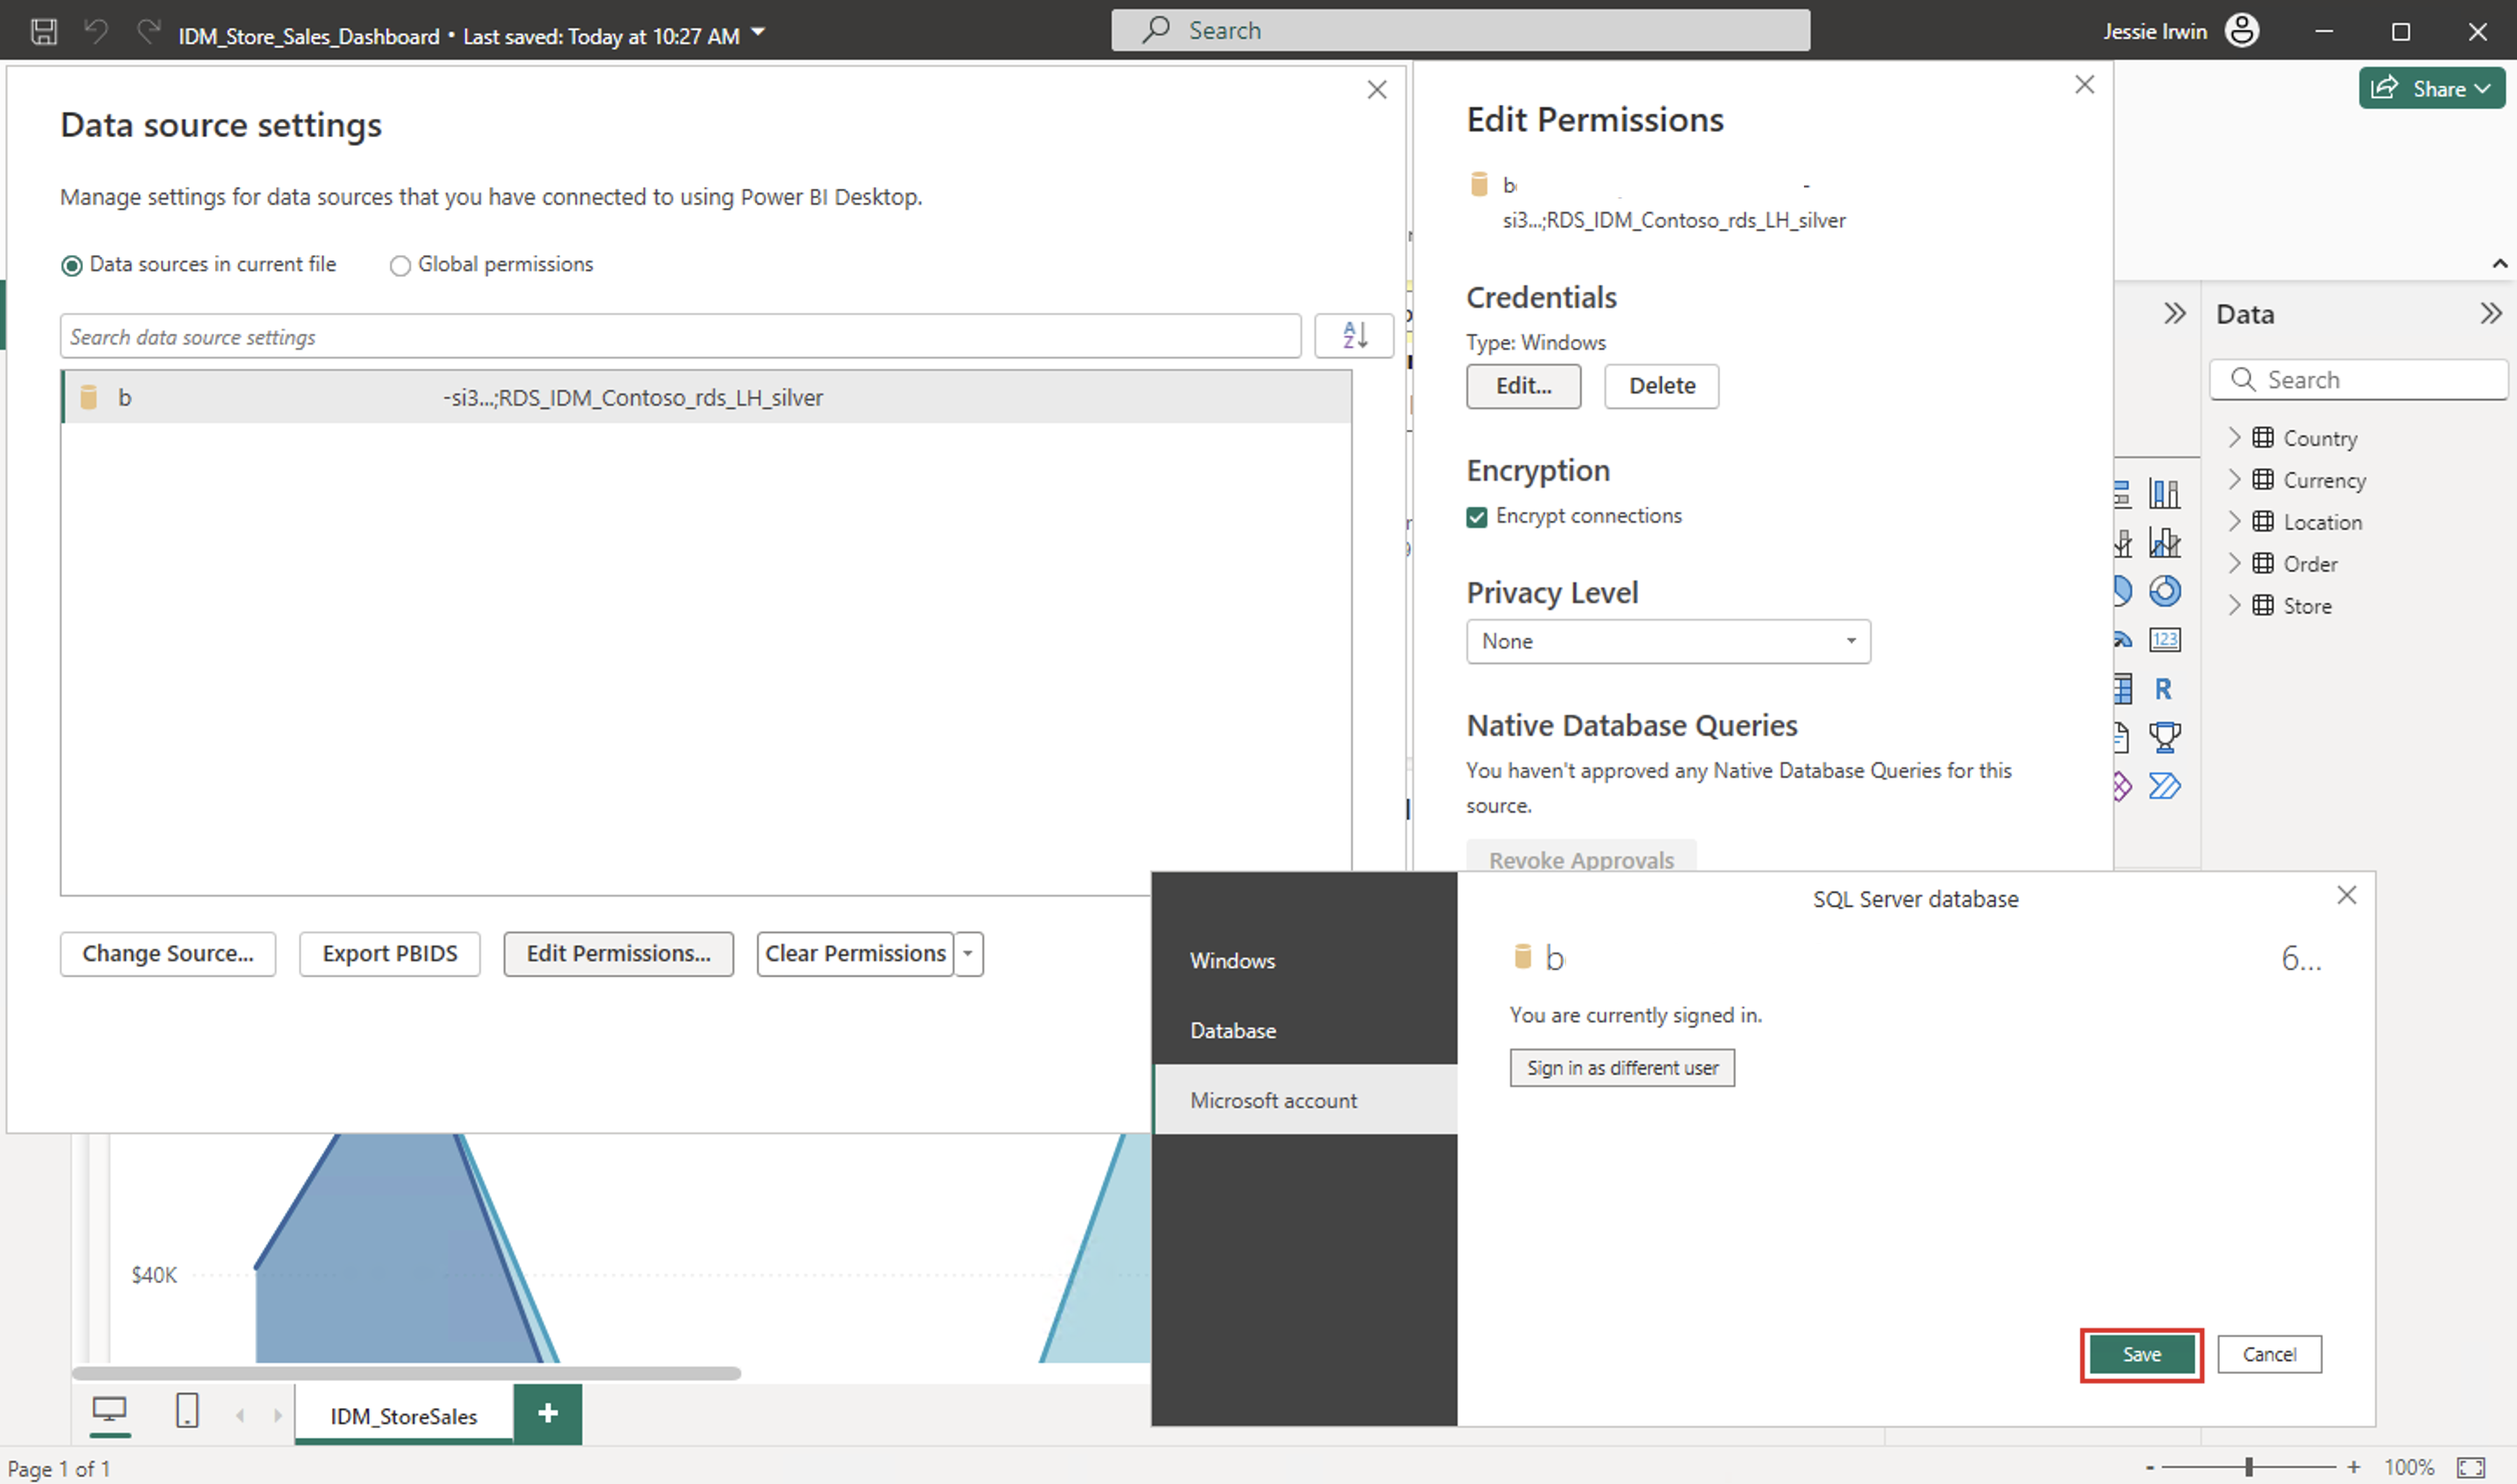
Select Edit Permissions on the Data source settings dialog. Select Edit > Microsoft account and then select Sign in.
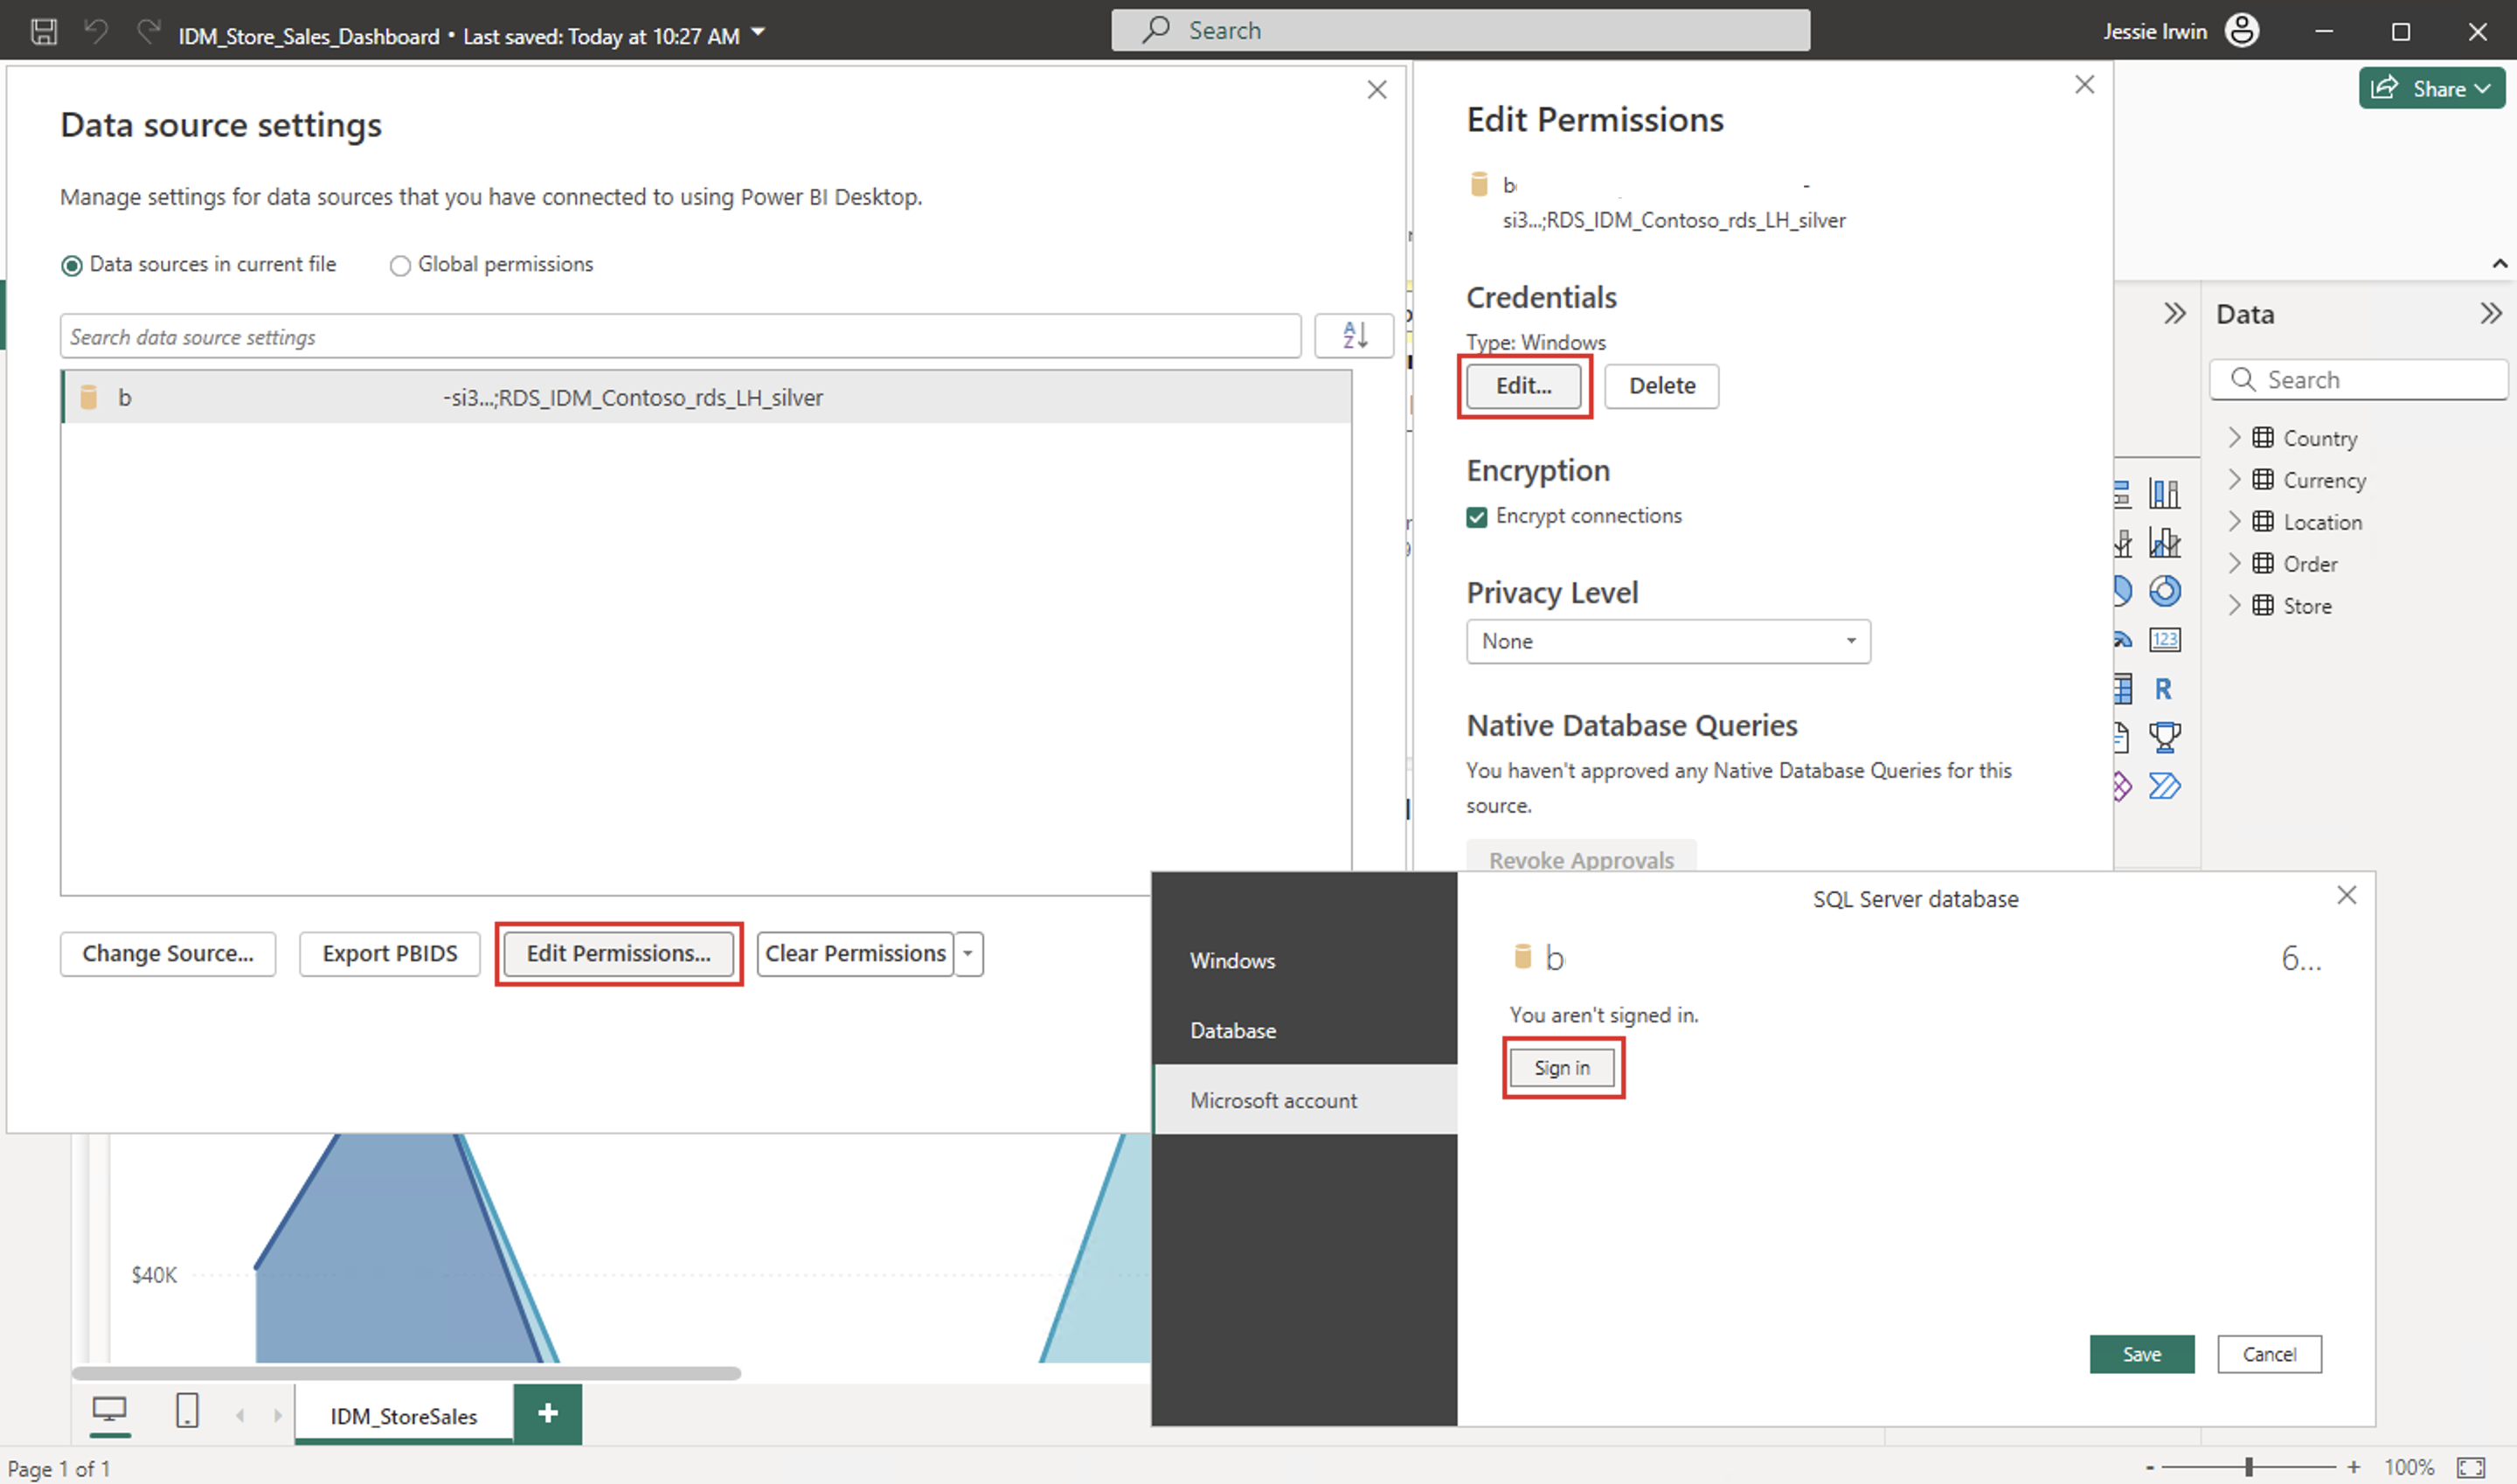
Sign in by using the credentials of Jessie Irwin and then select Save.
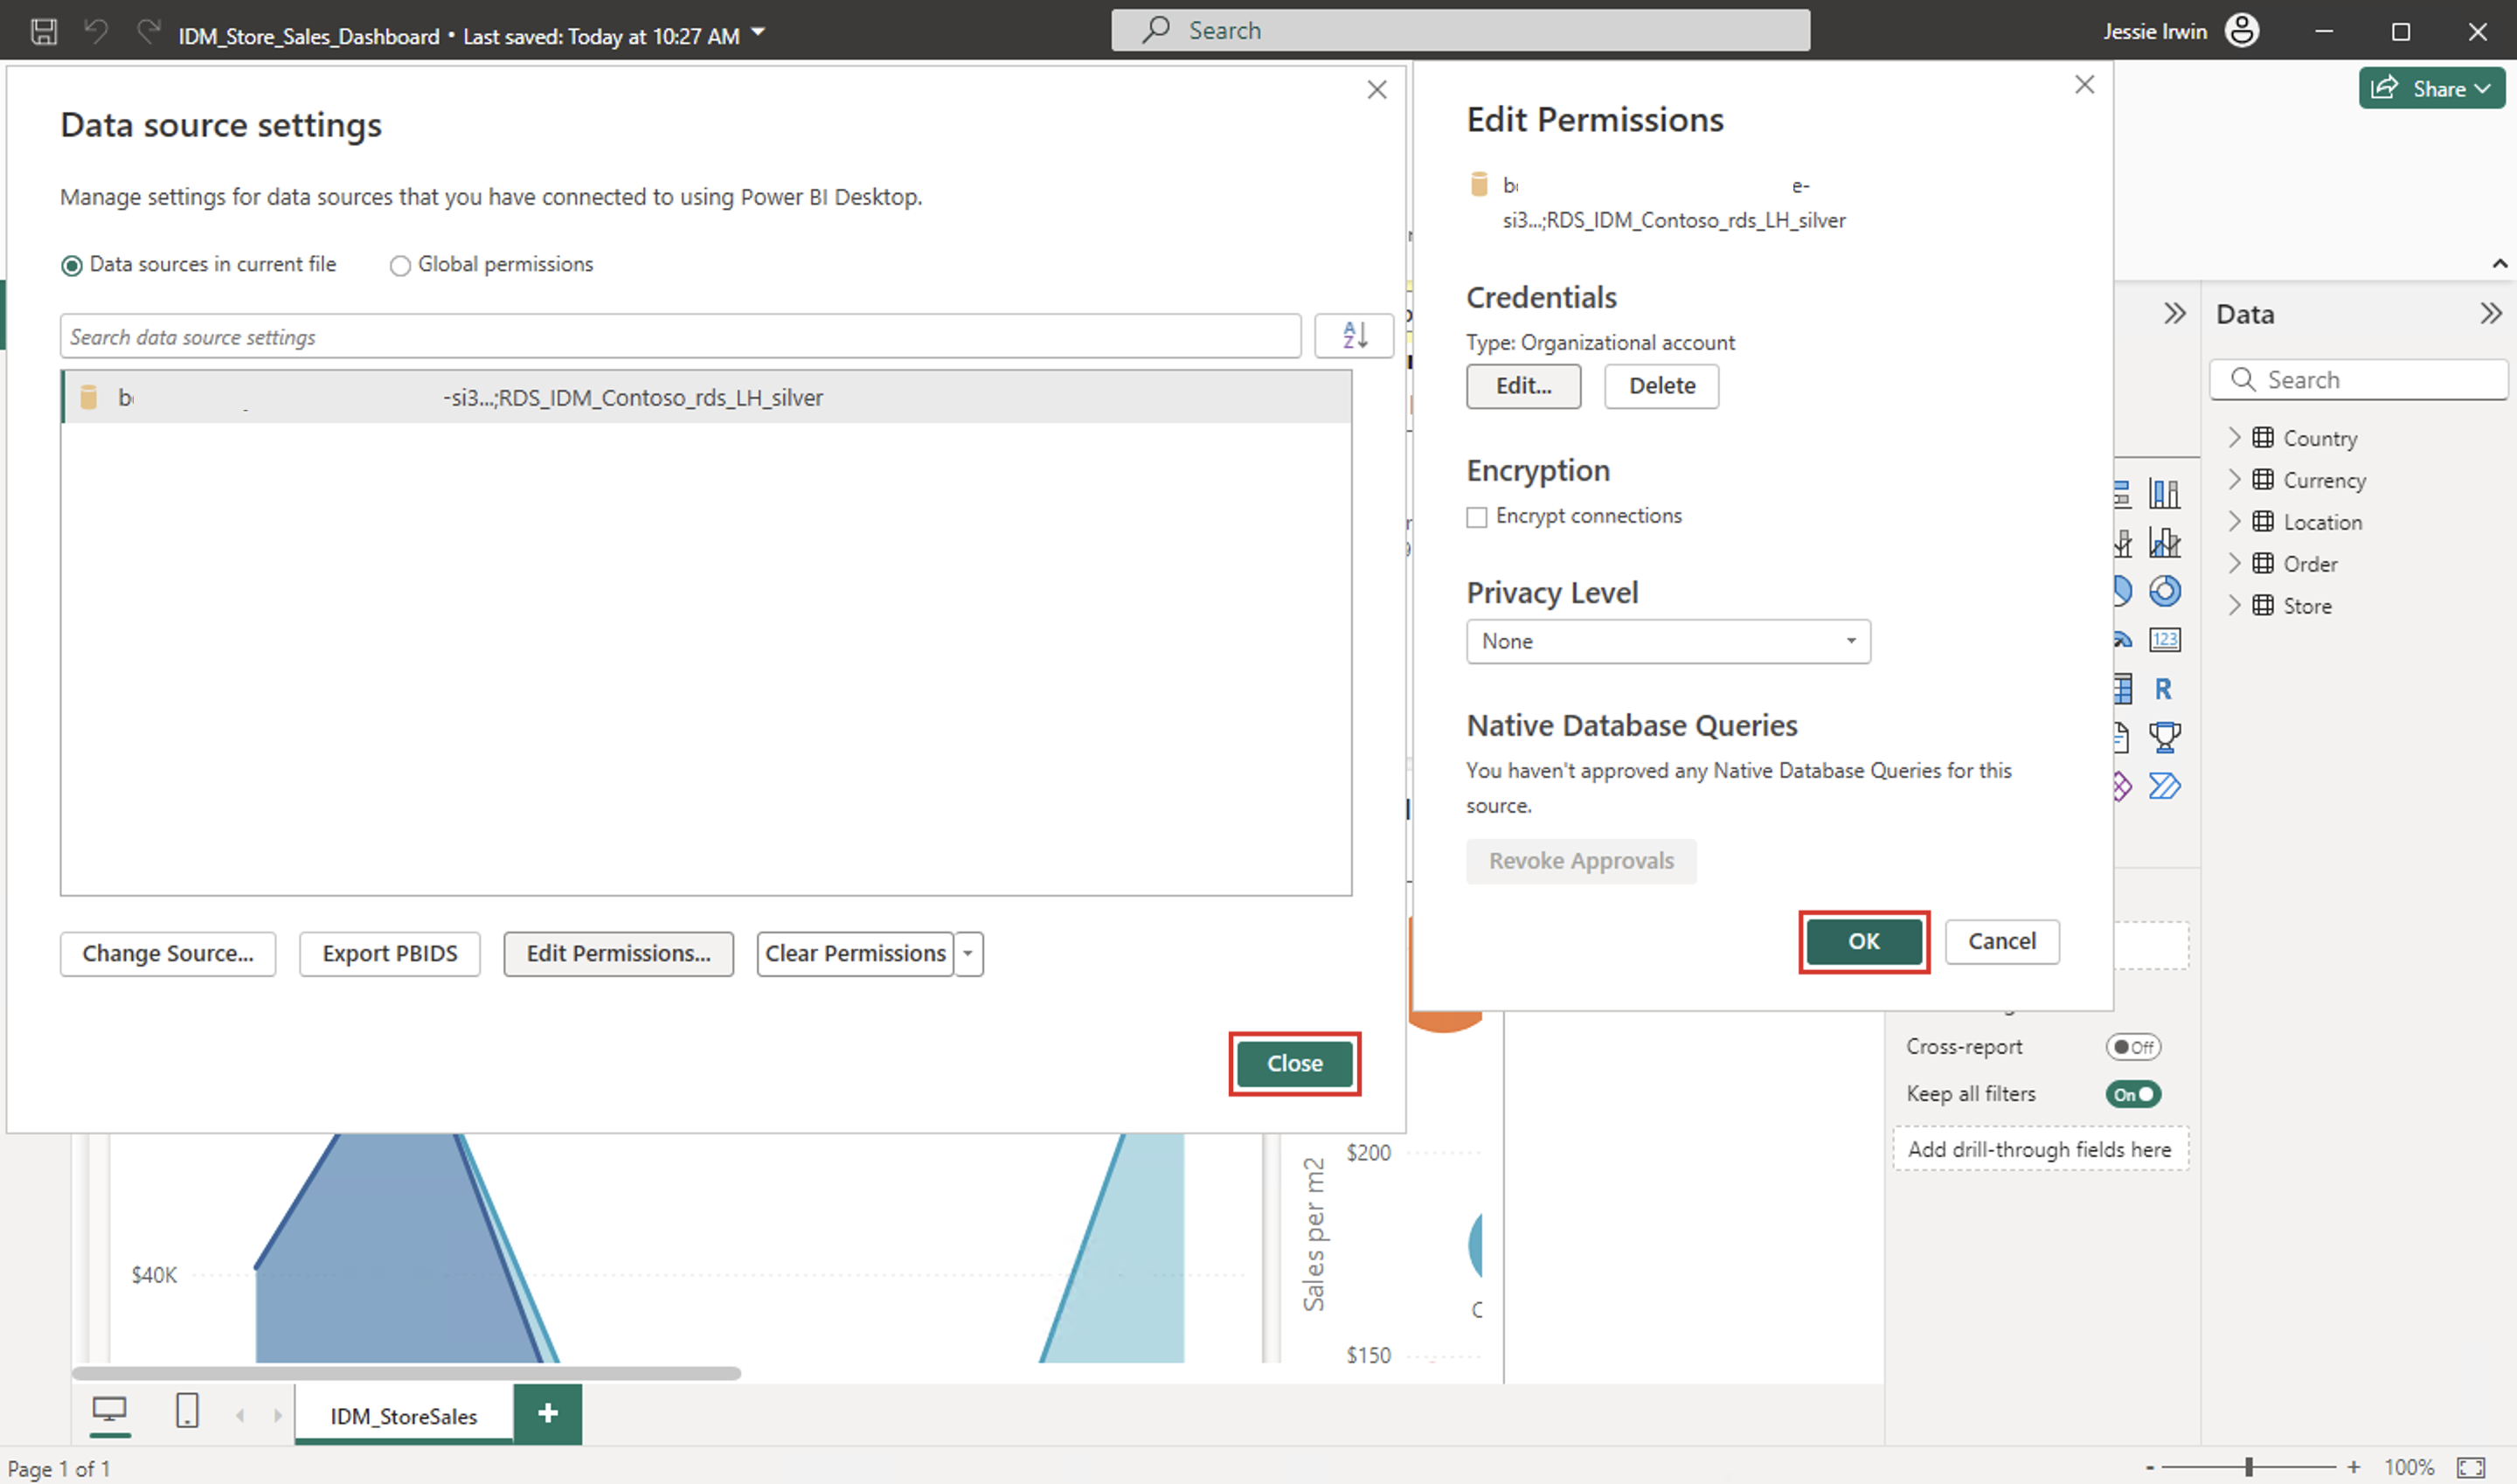
Select OK > Close to close the dialog boxes.
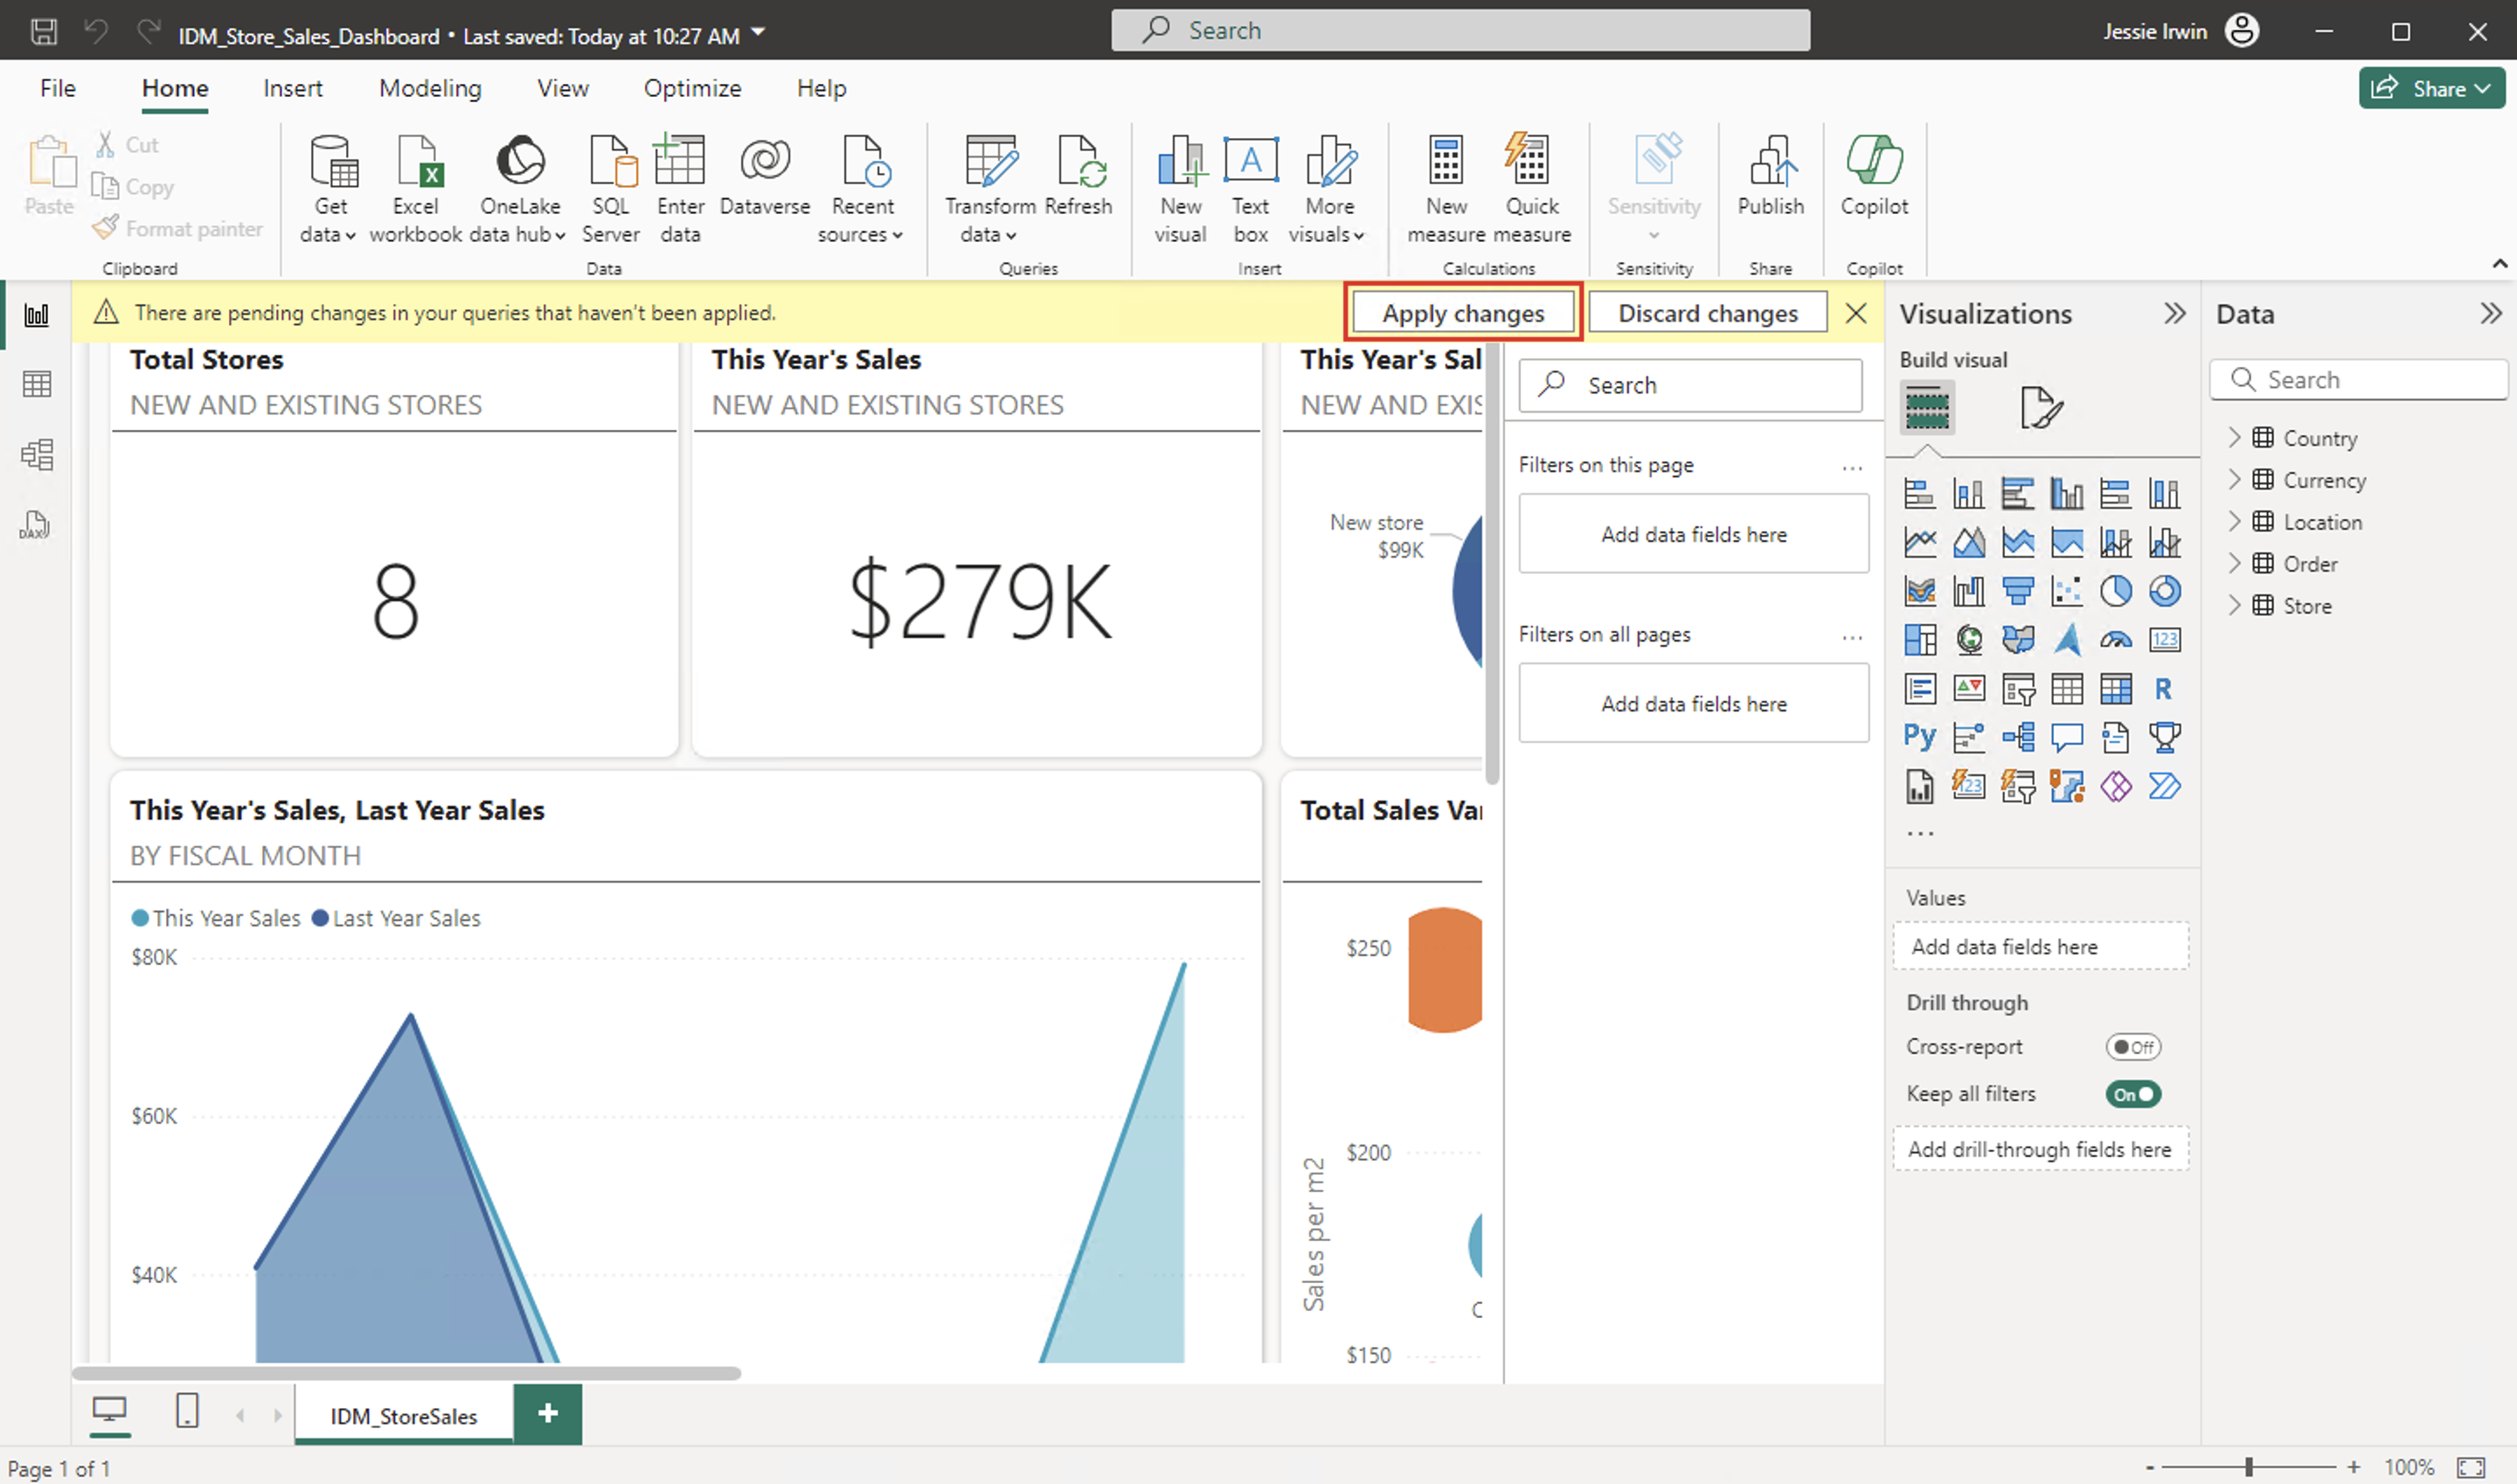
Select Apply changes in the notification bar.
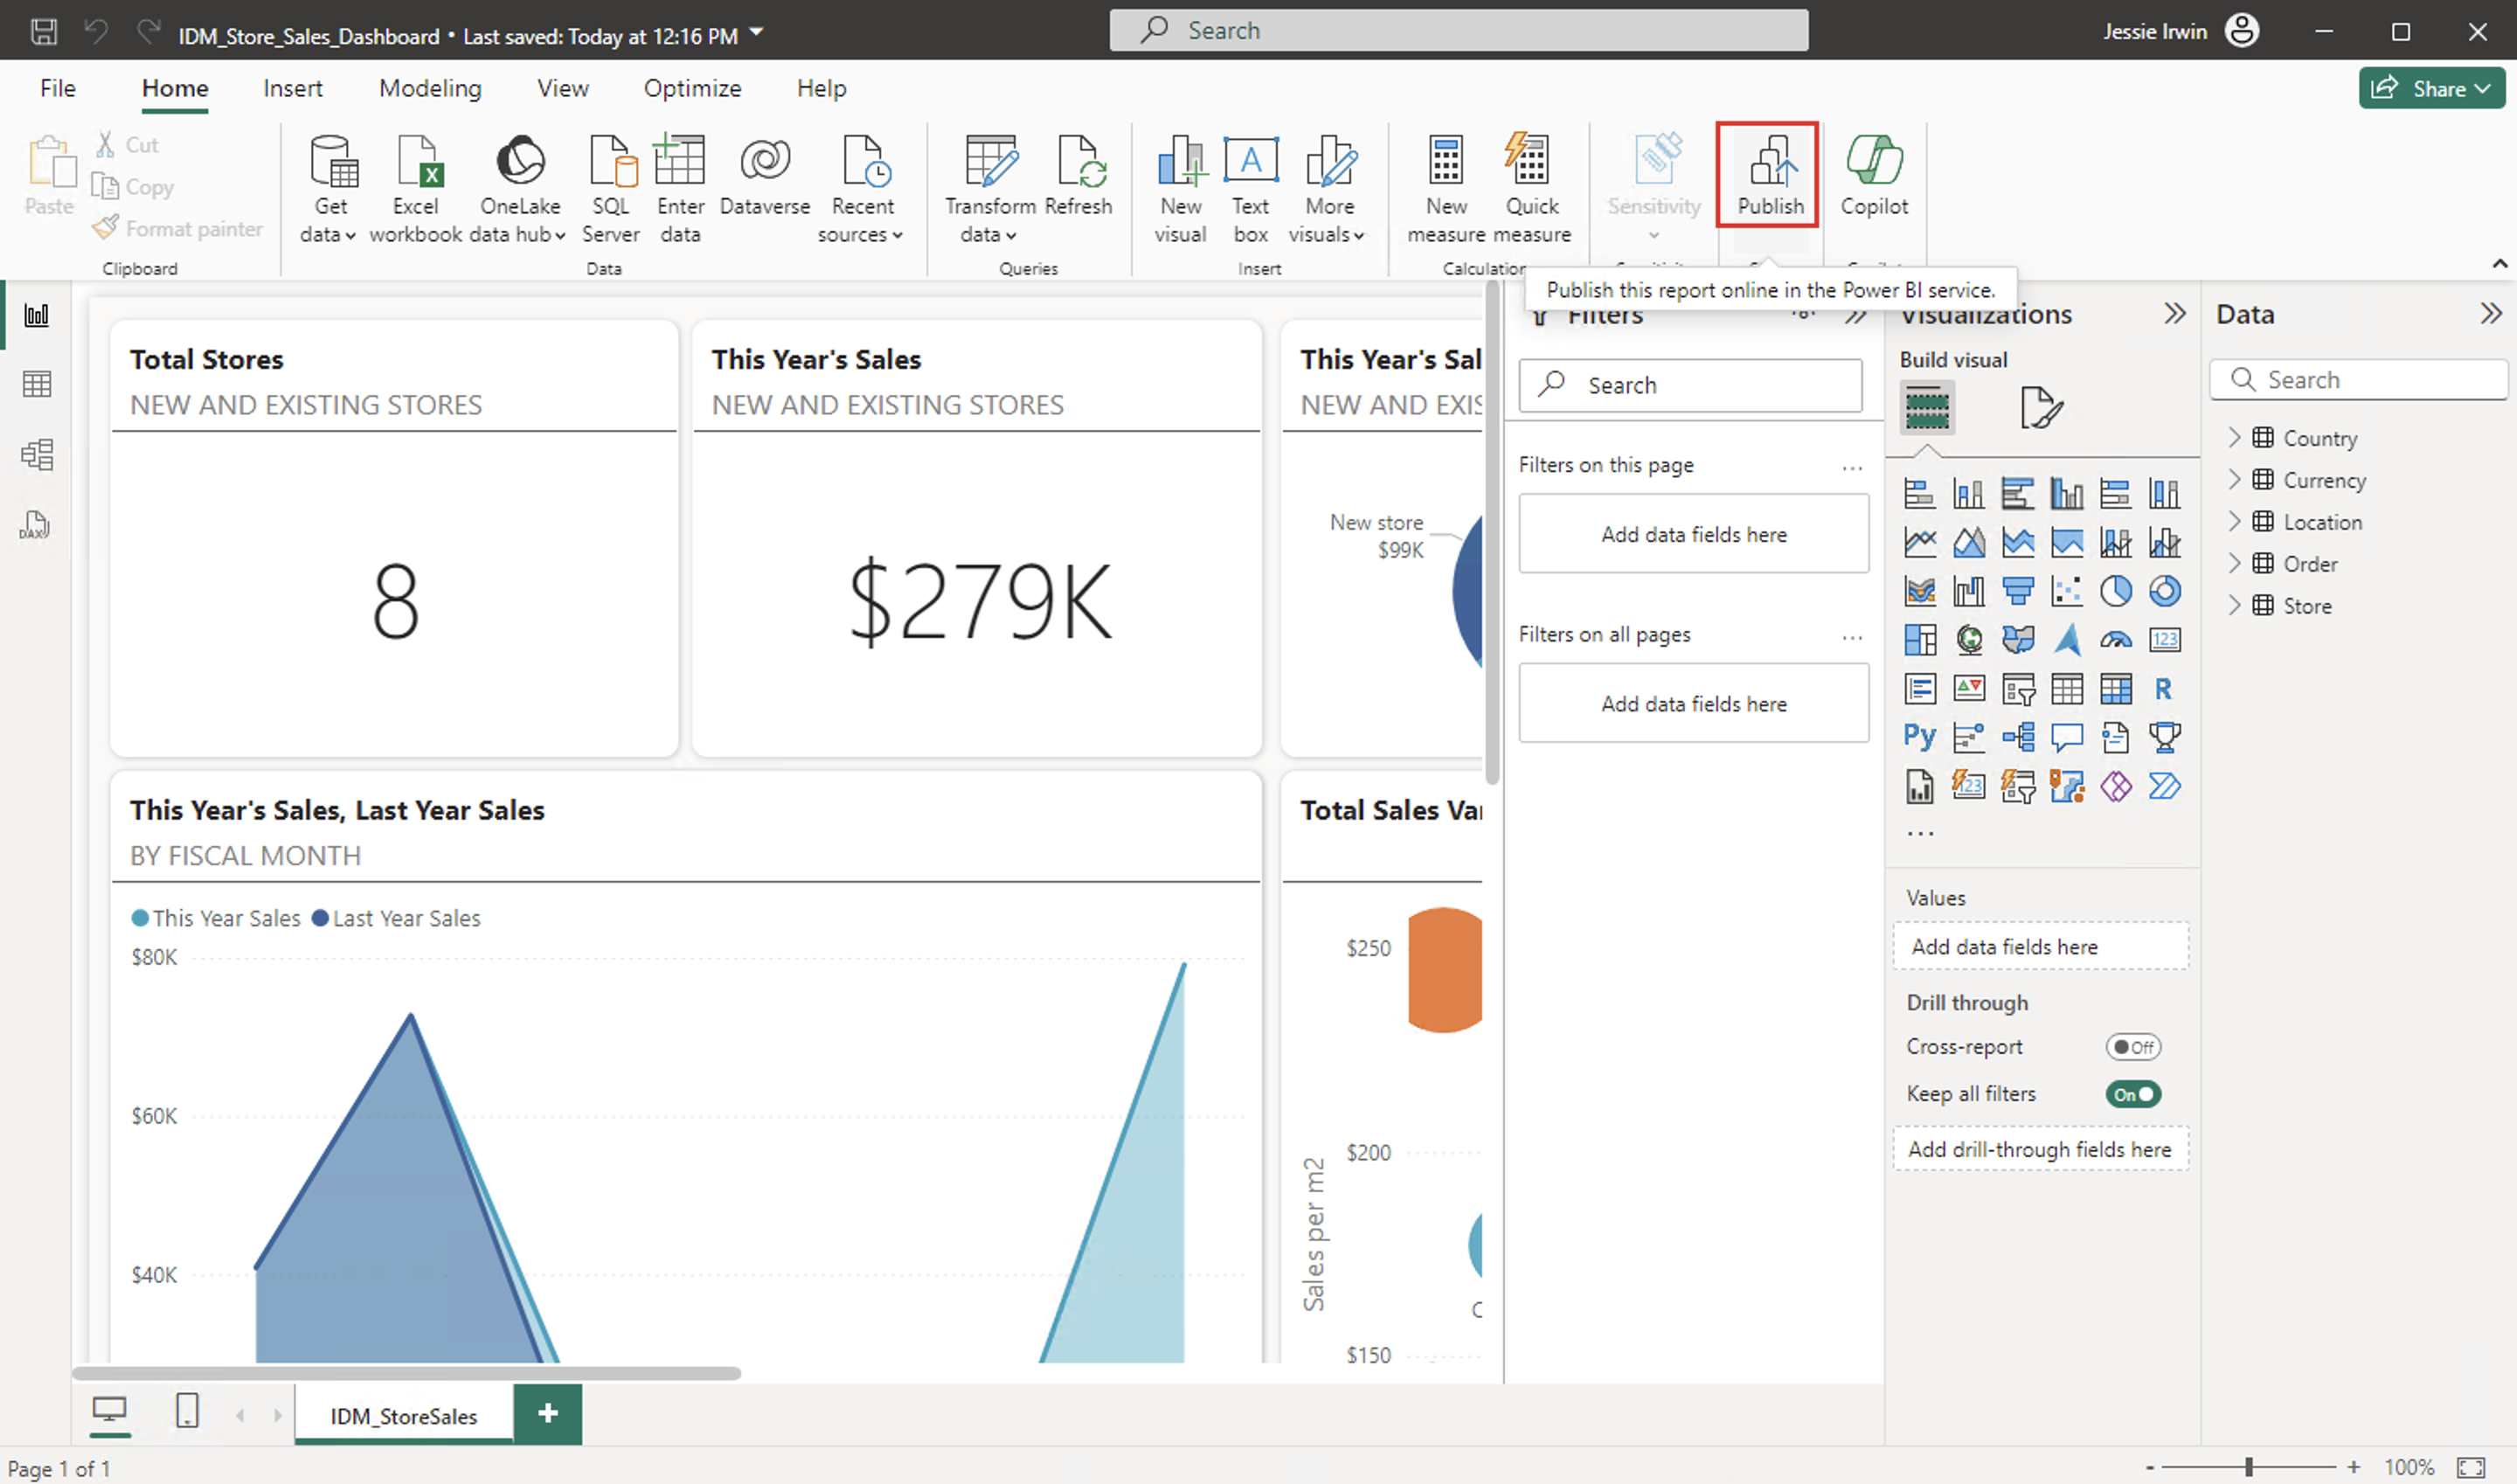
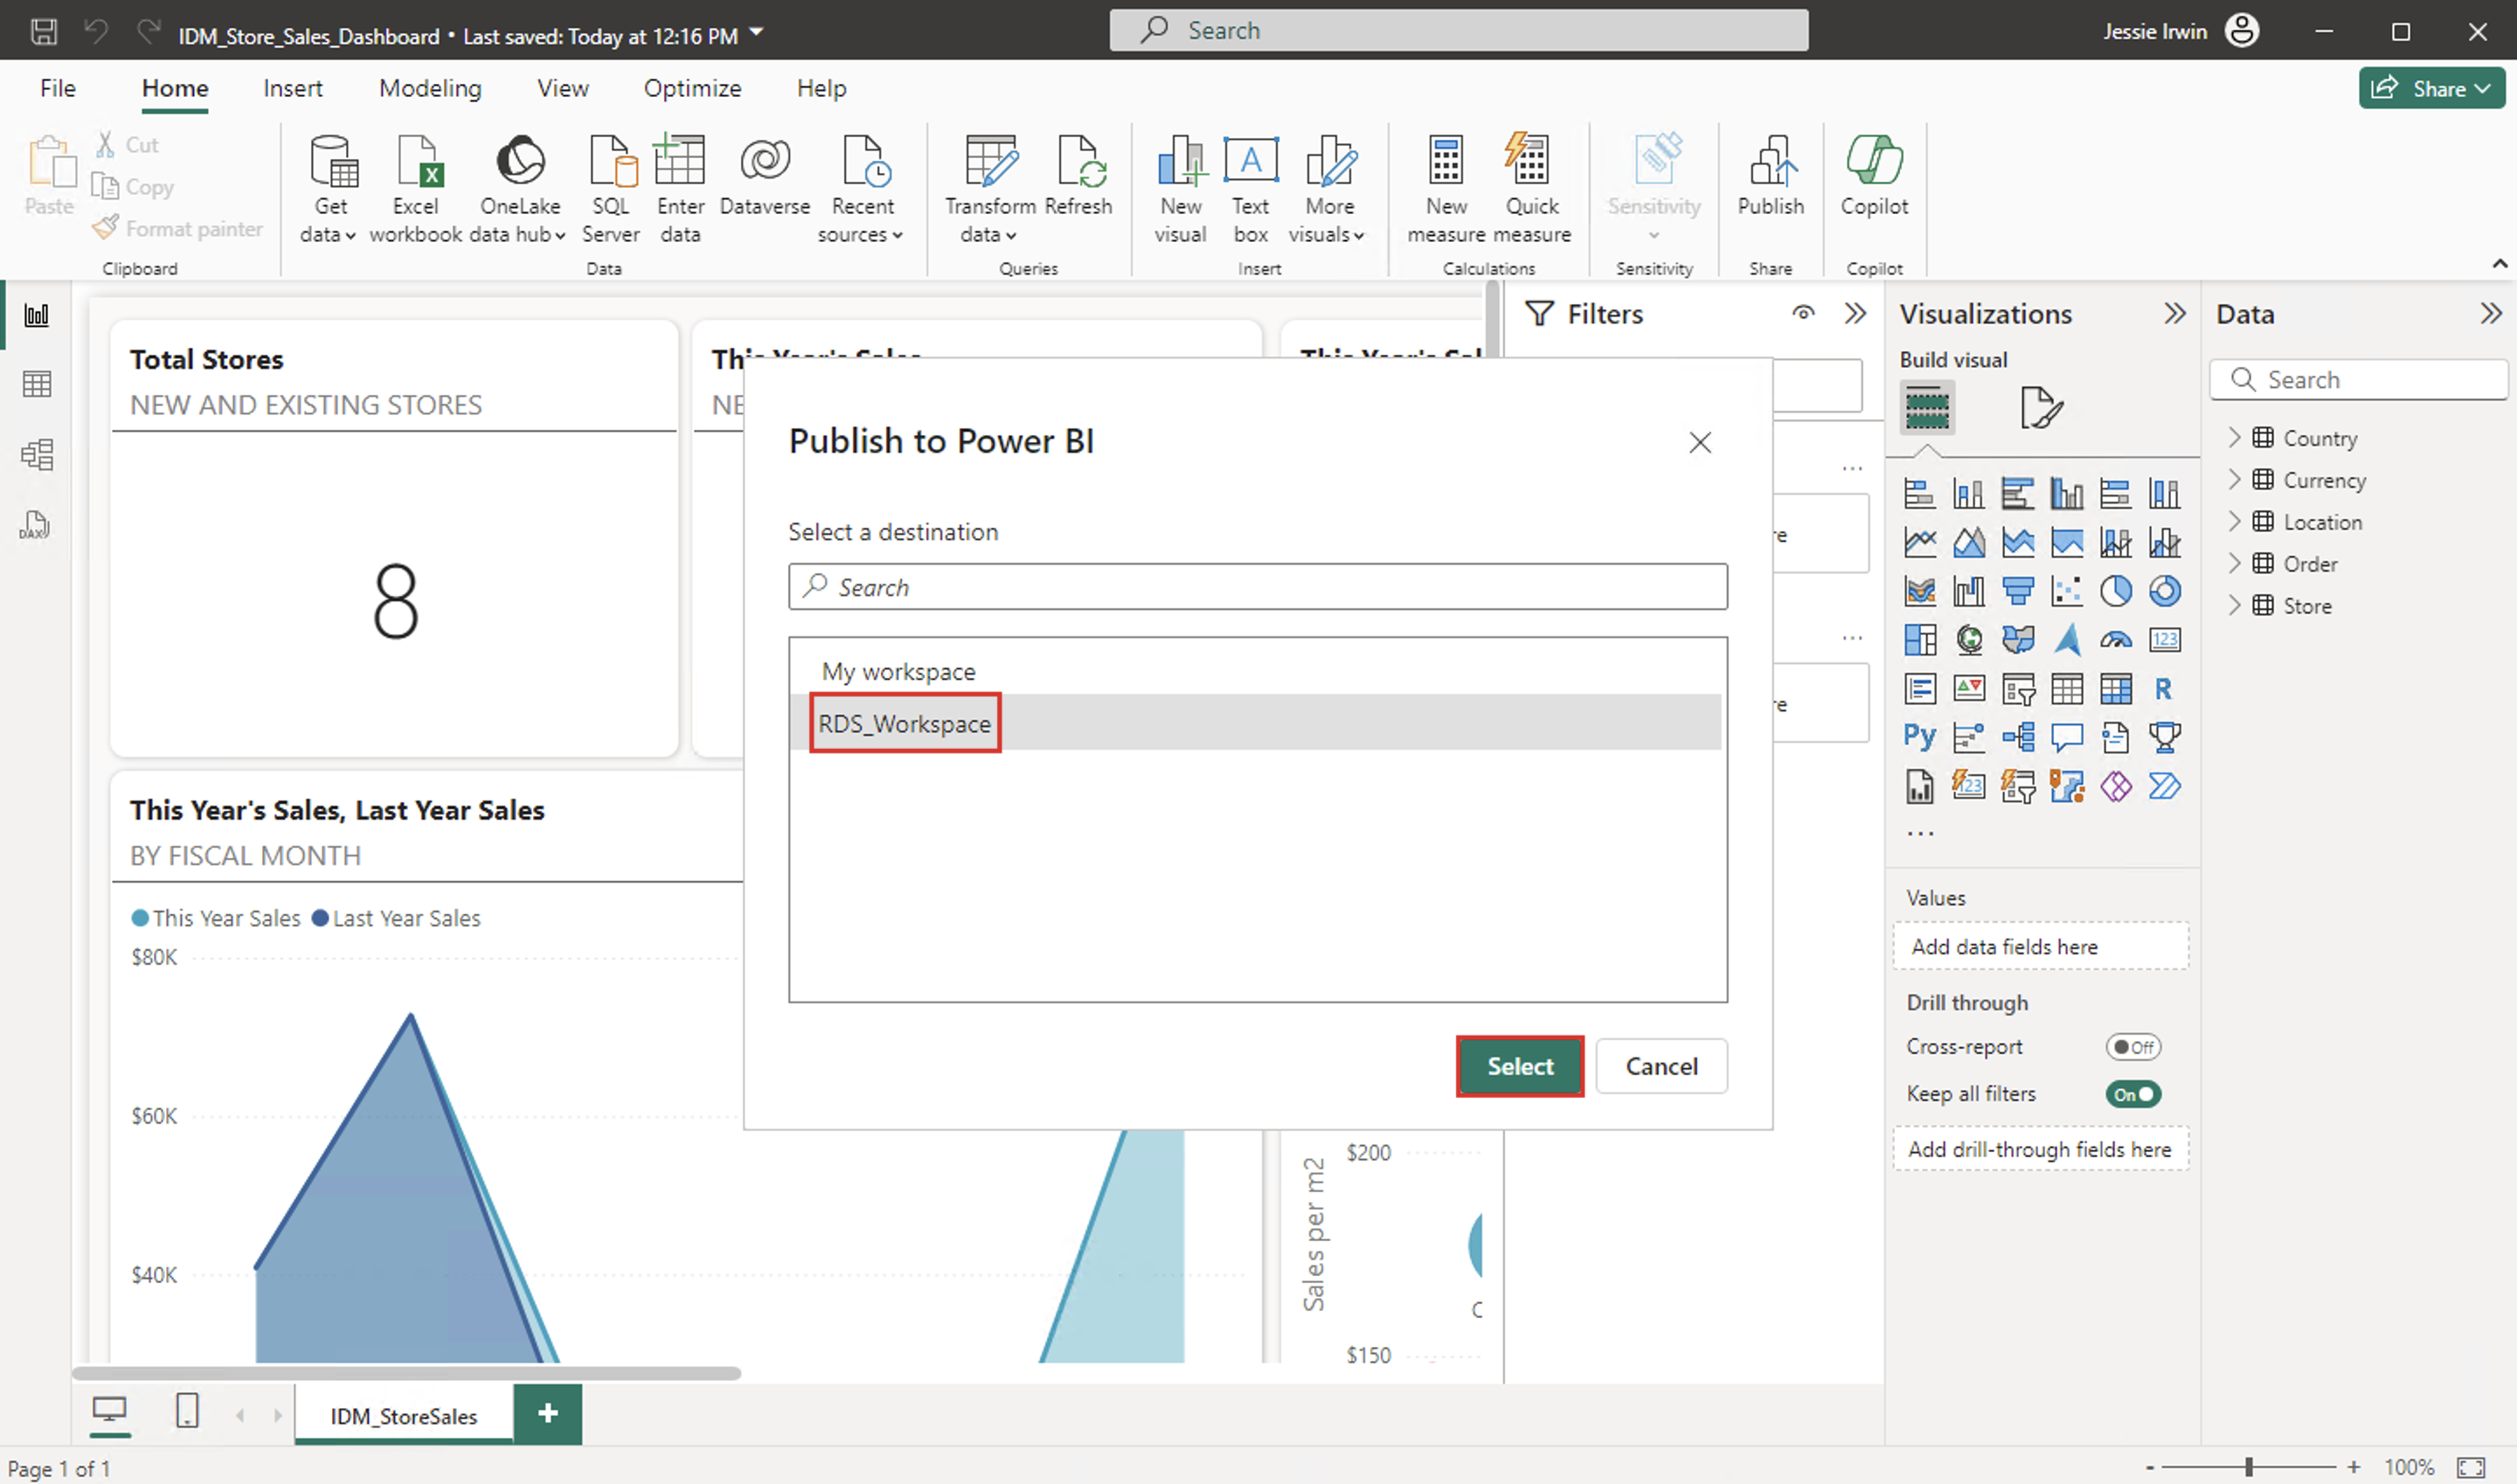
Select File > Save and then select Home > Publish.
Select RDS_Workspace and then select Save.
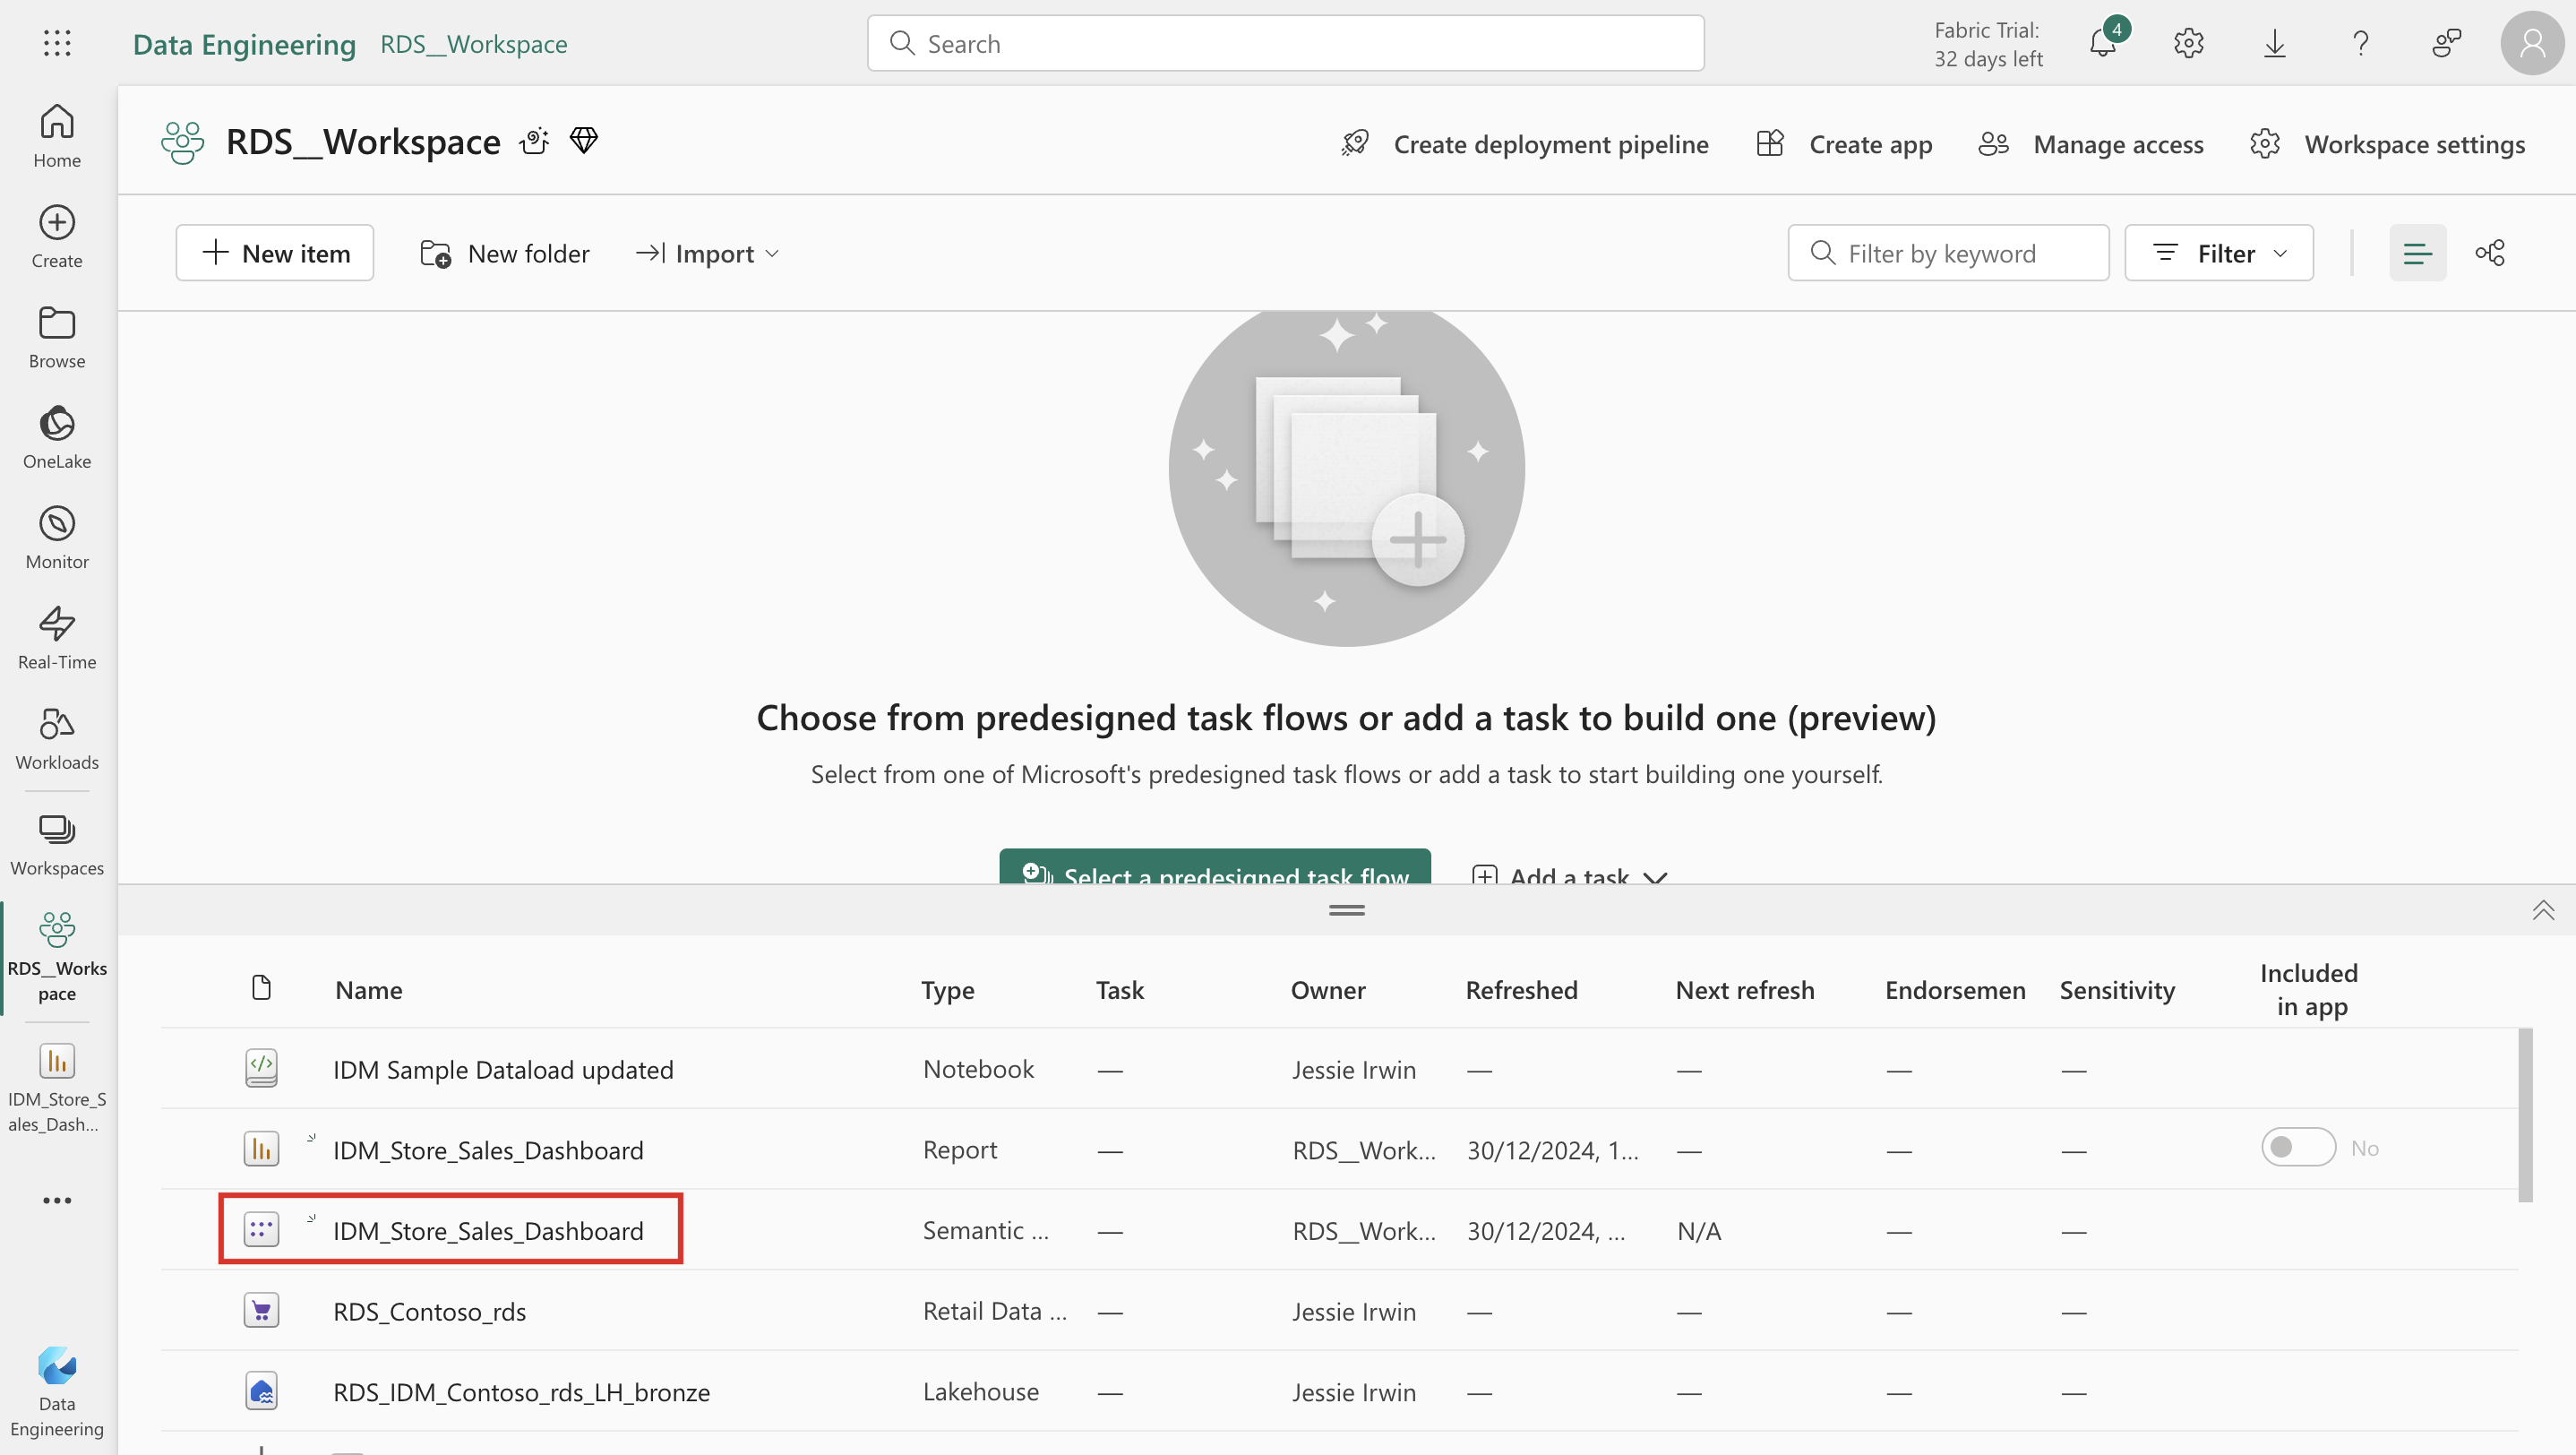
After the report publishes, go to the tab with RDS_Workspace in your browser. Select the IDM_Store_Sales_Dashboard semantic model.
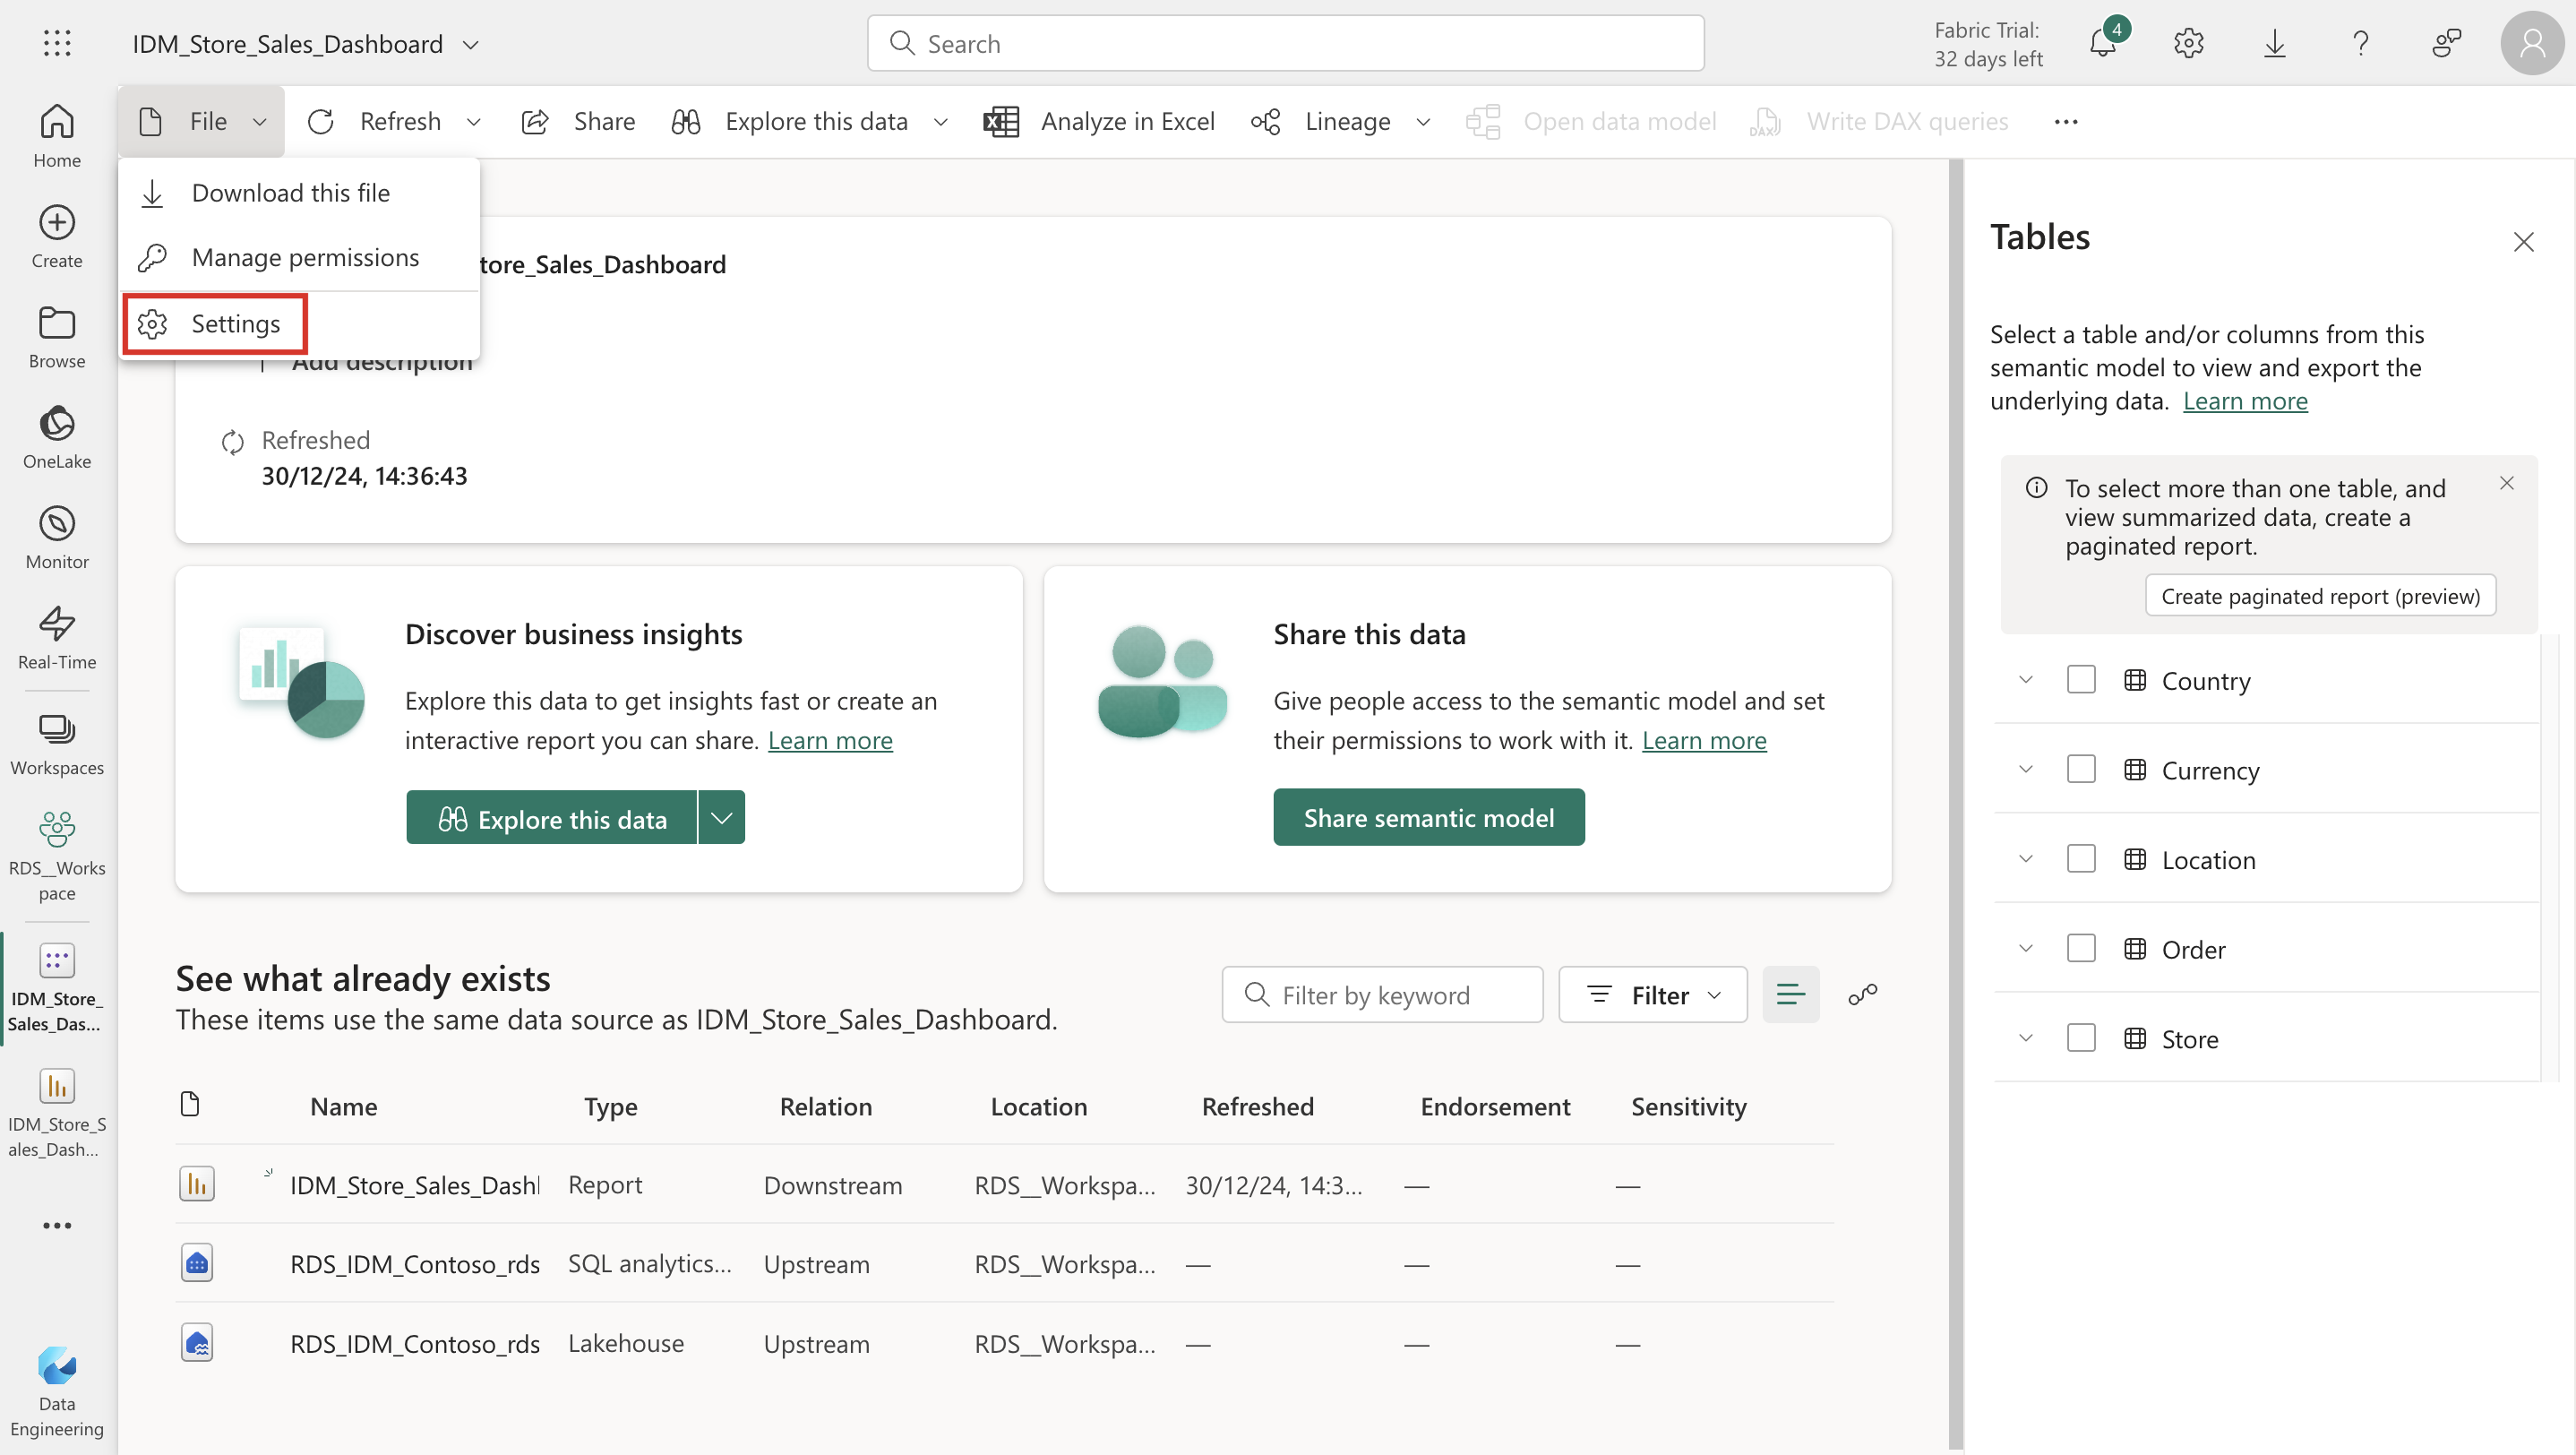
Select File > Settings from the upper menu bar.
Under Settings for IDM_Store_Sales_Dashboard, select Take over.
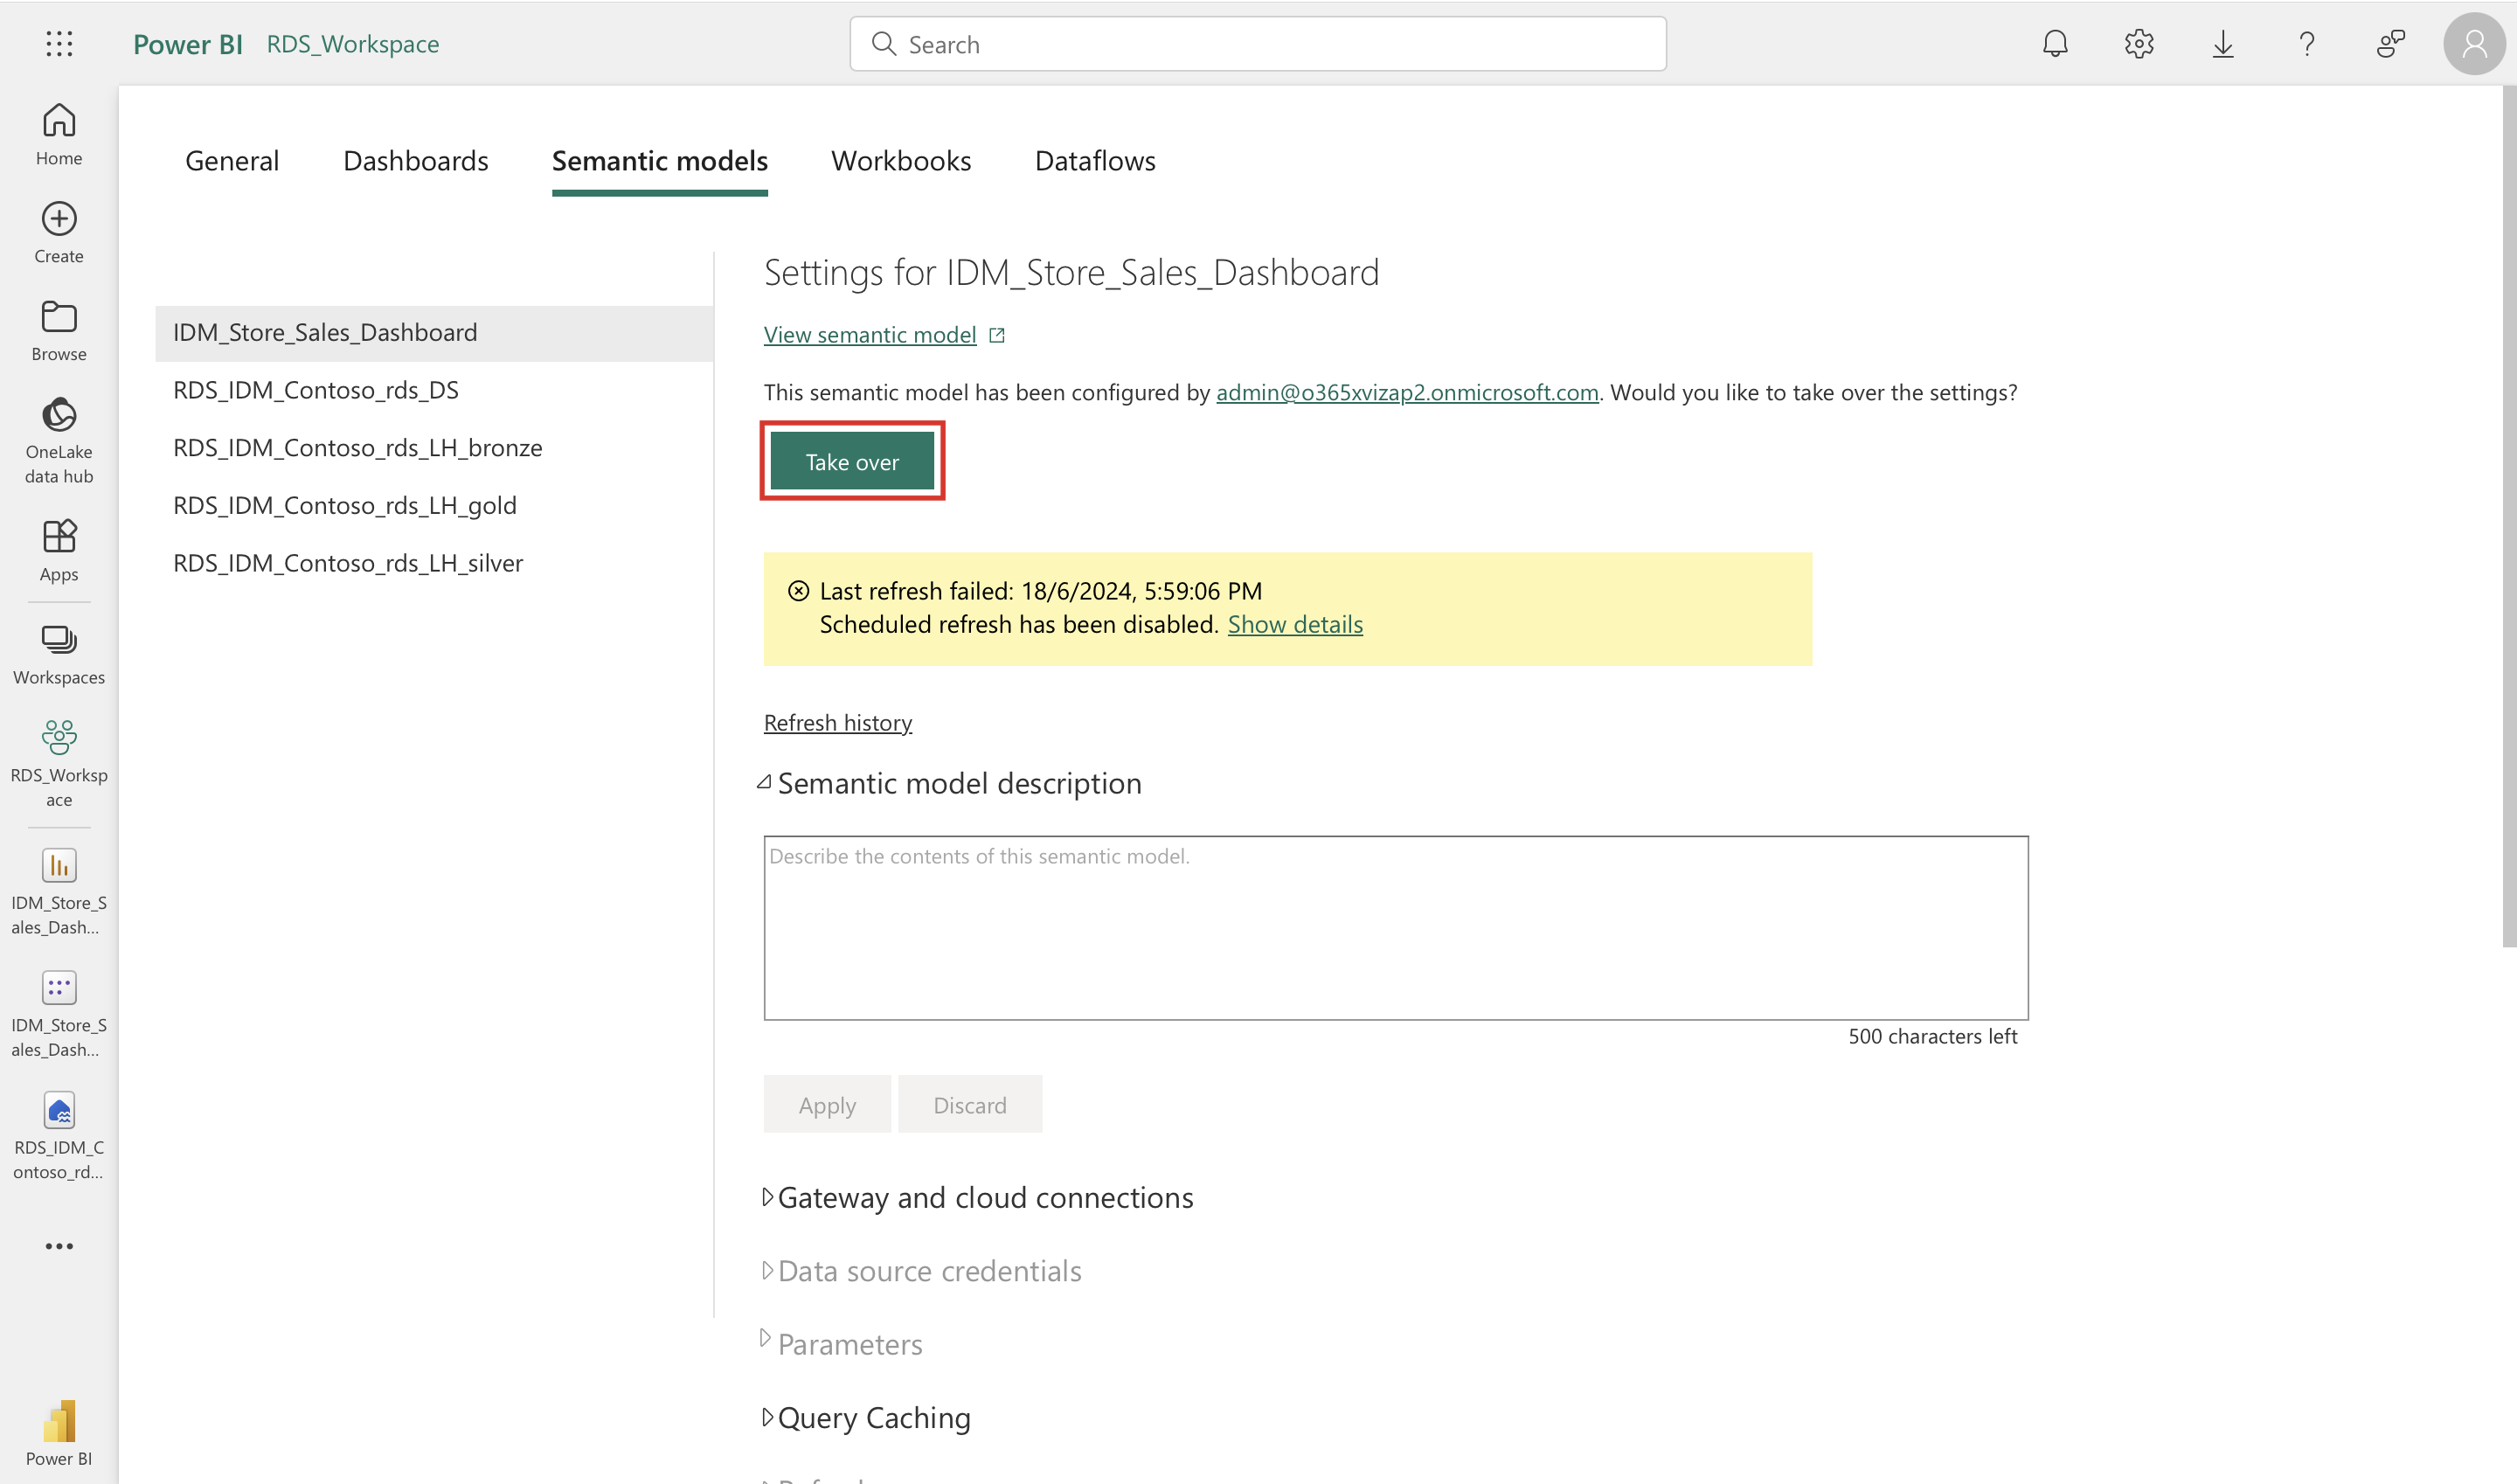
On the Take over dataset settings pop-up window, select Take over again.
Under Gateway and cloud connections, from the dropdown, select Create a connection.
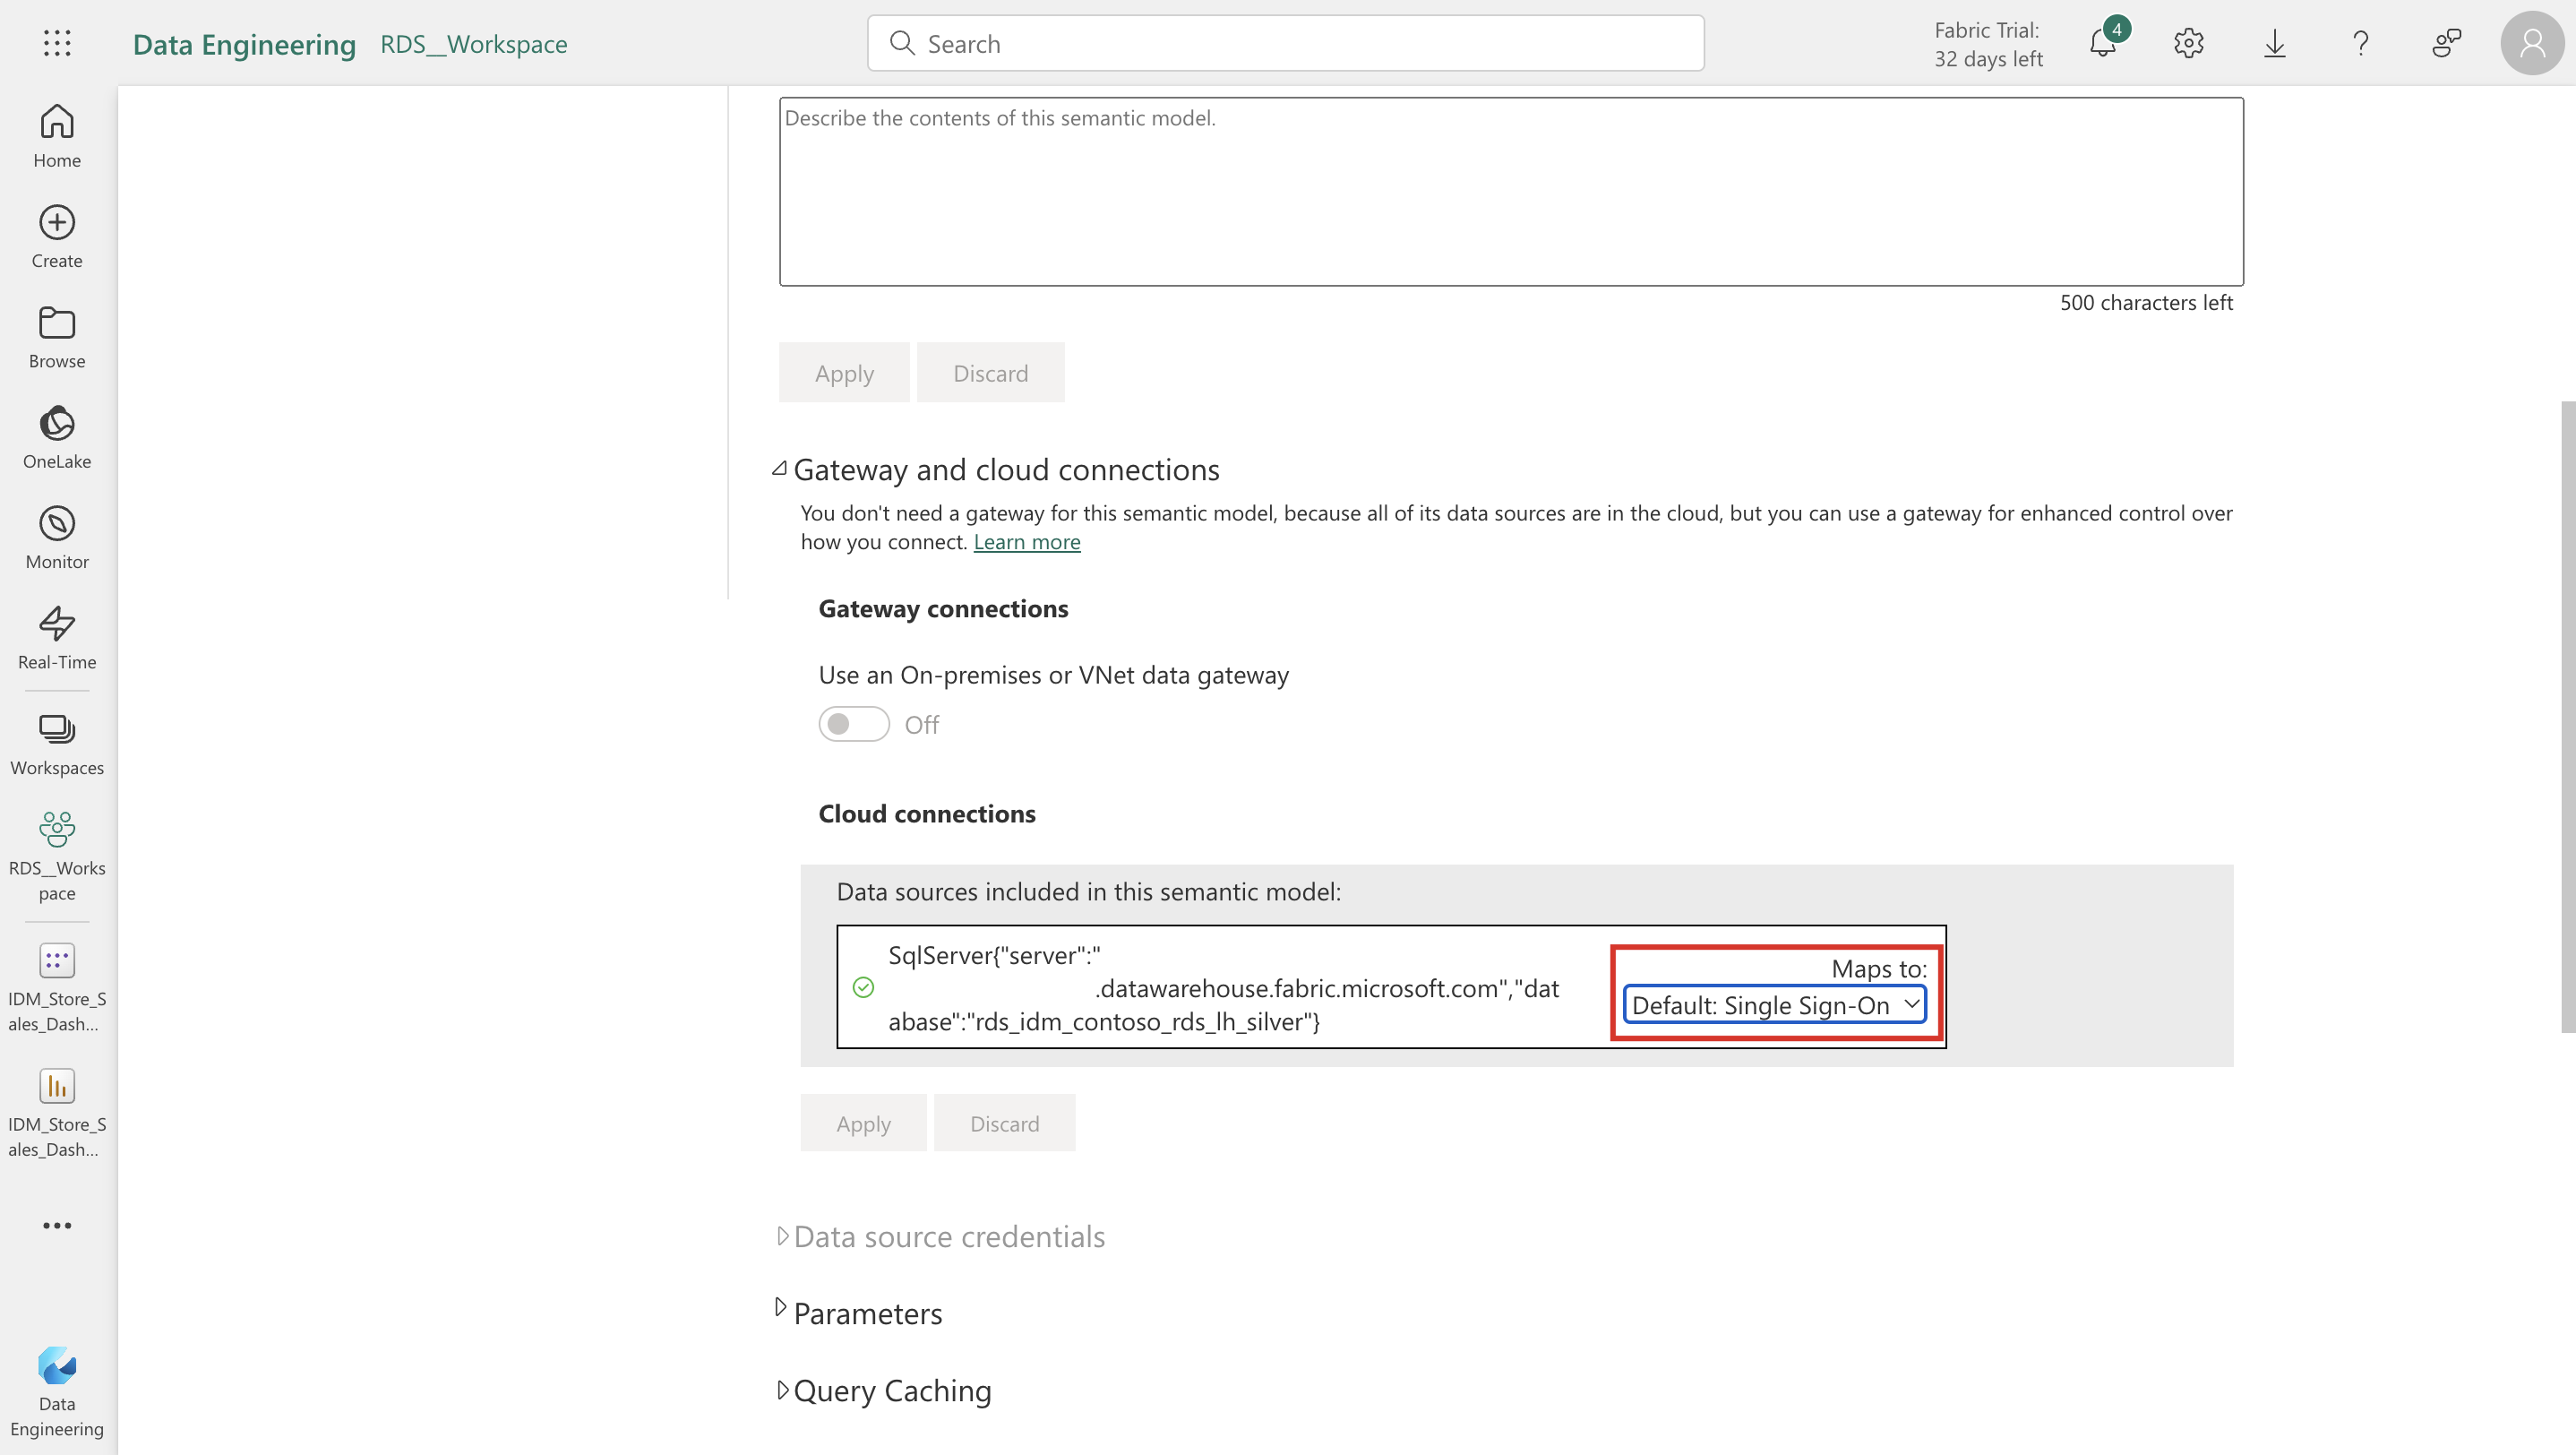
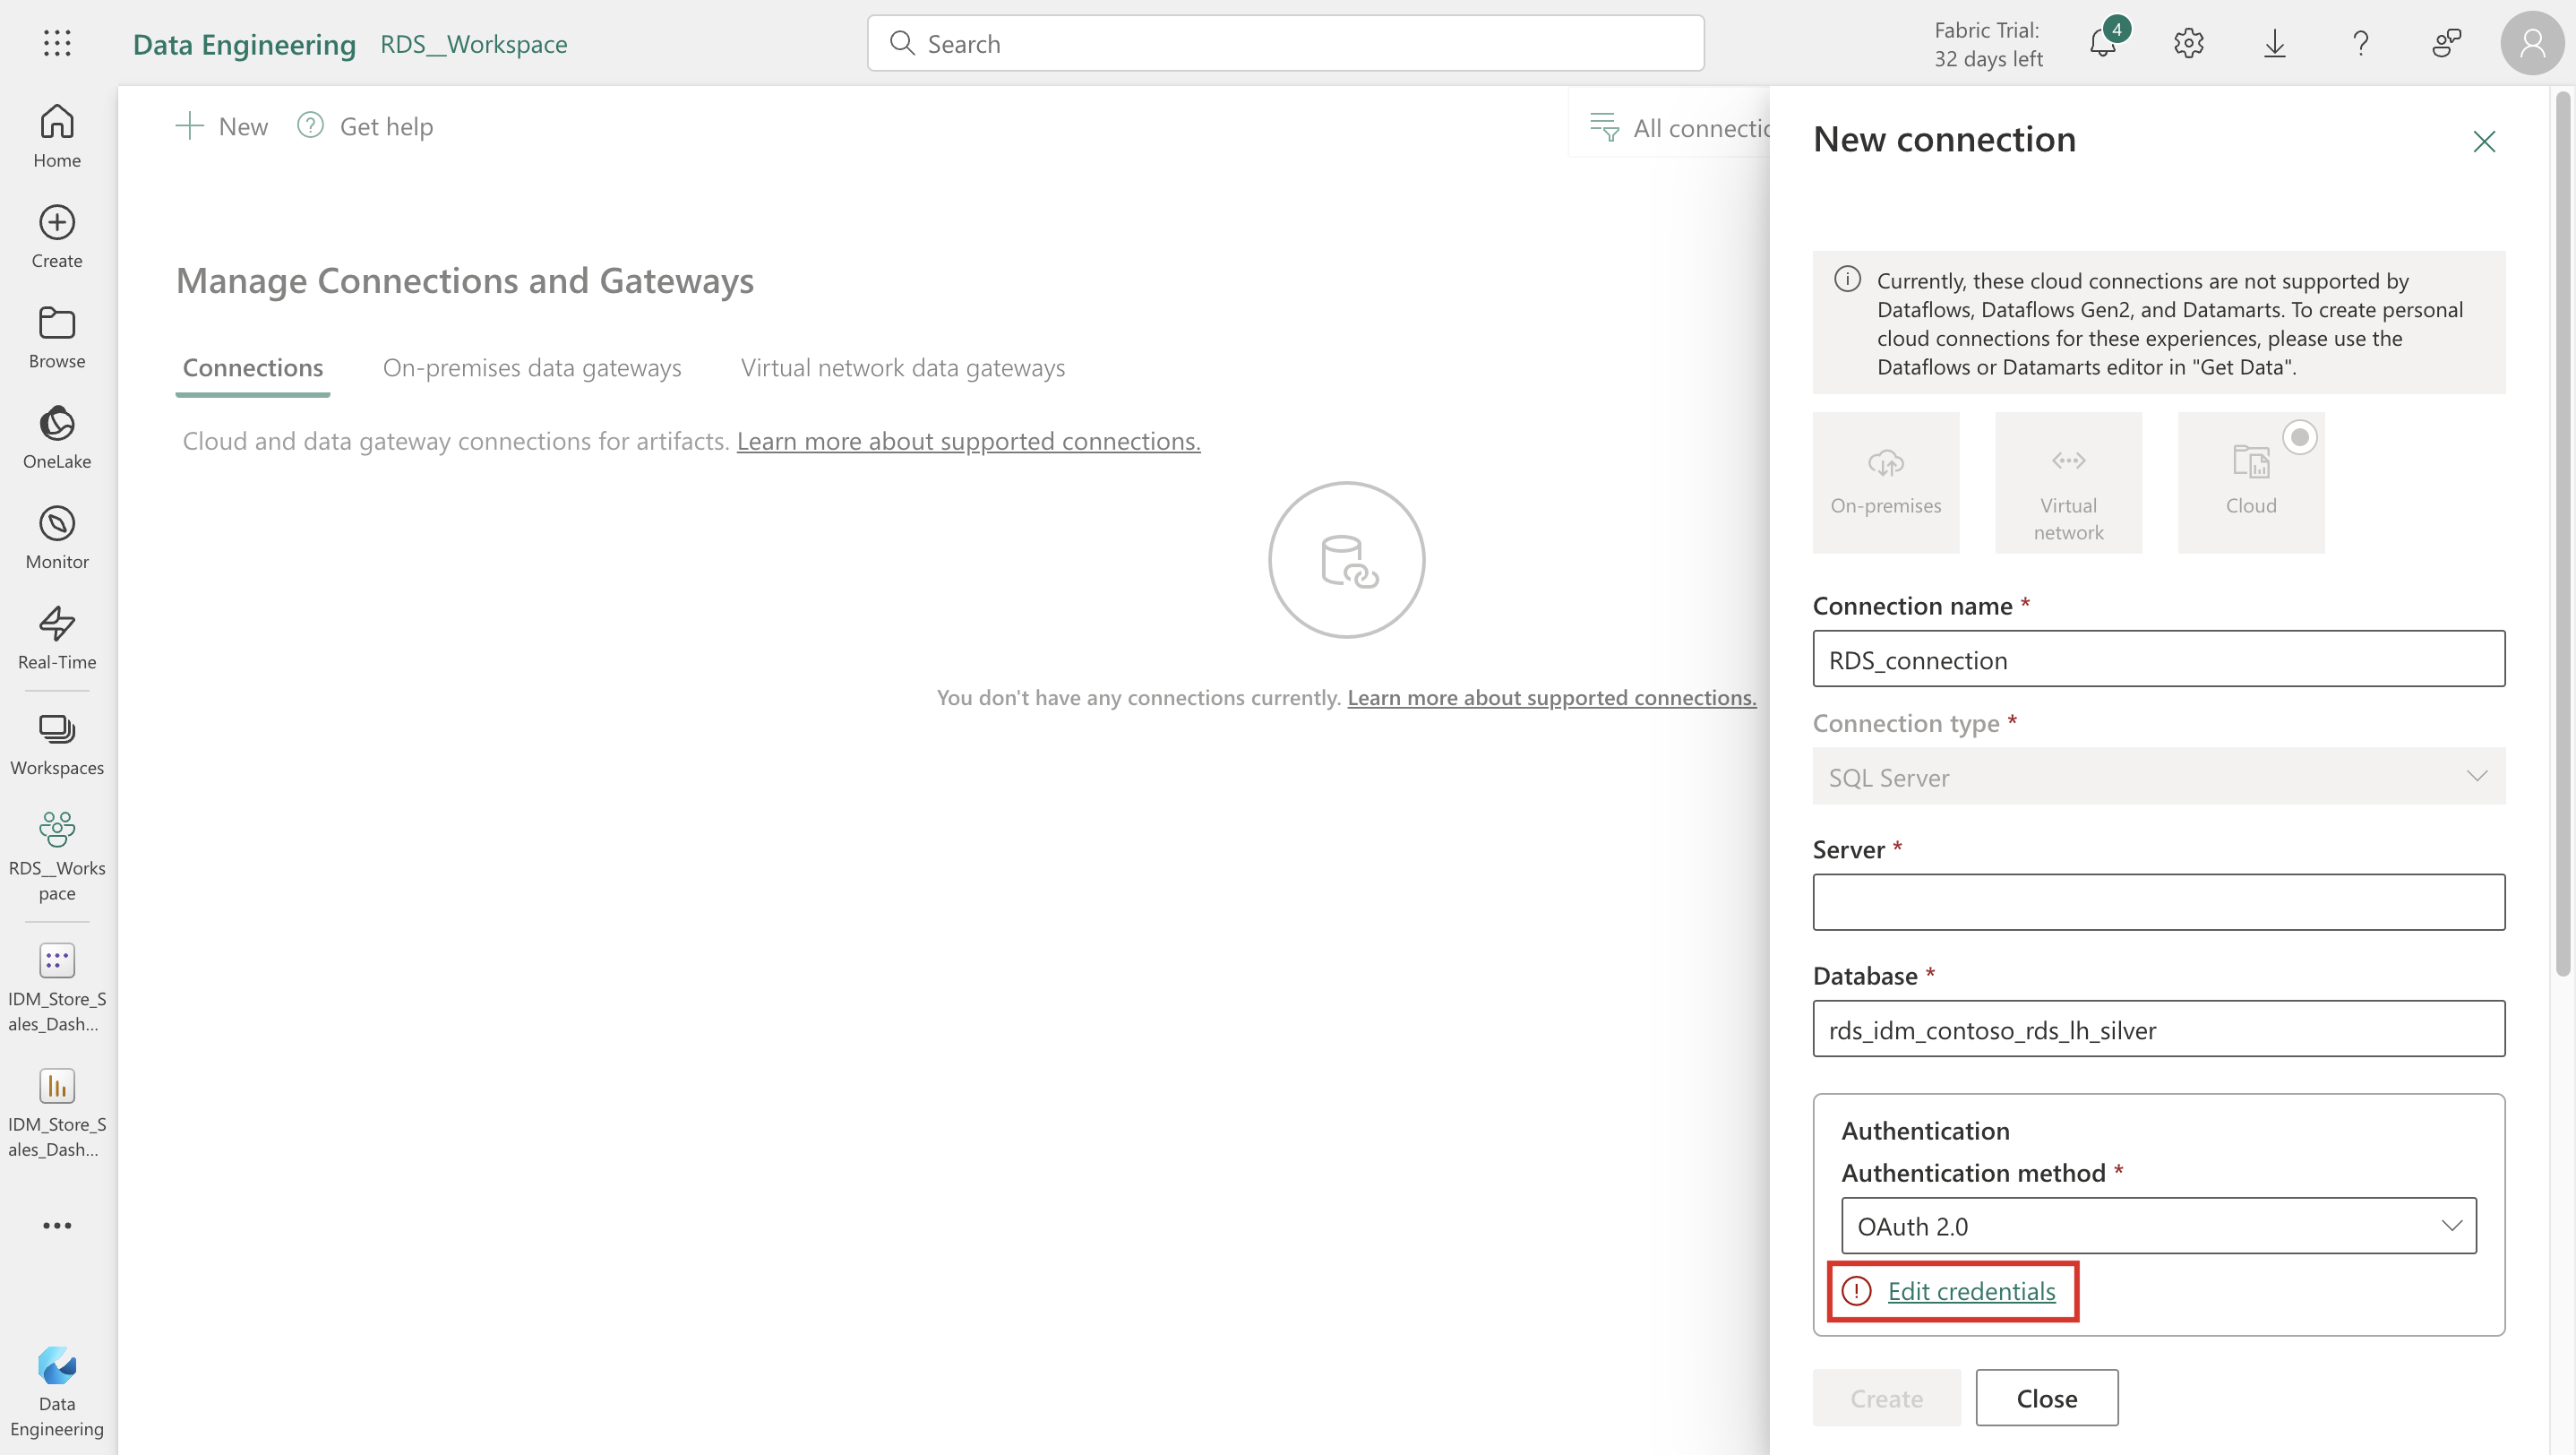
Enter the following information in the New connection window and select Create.
Connection name: RDS_connection
Authentication method: OAuth 2.0
Select Edit credentials. Sign in using the credentials of Jessie Irwin.
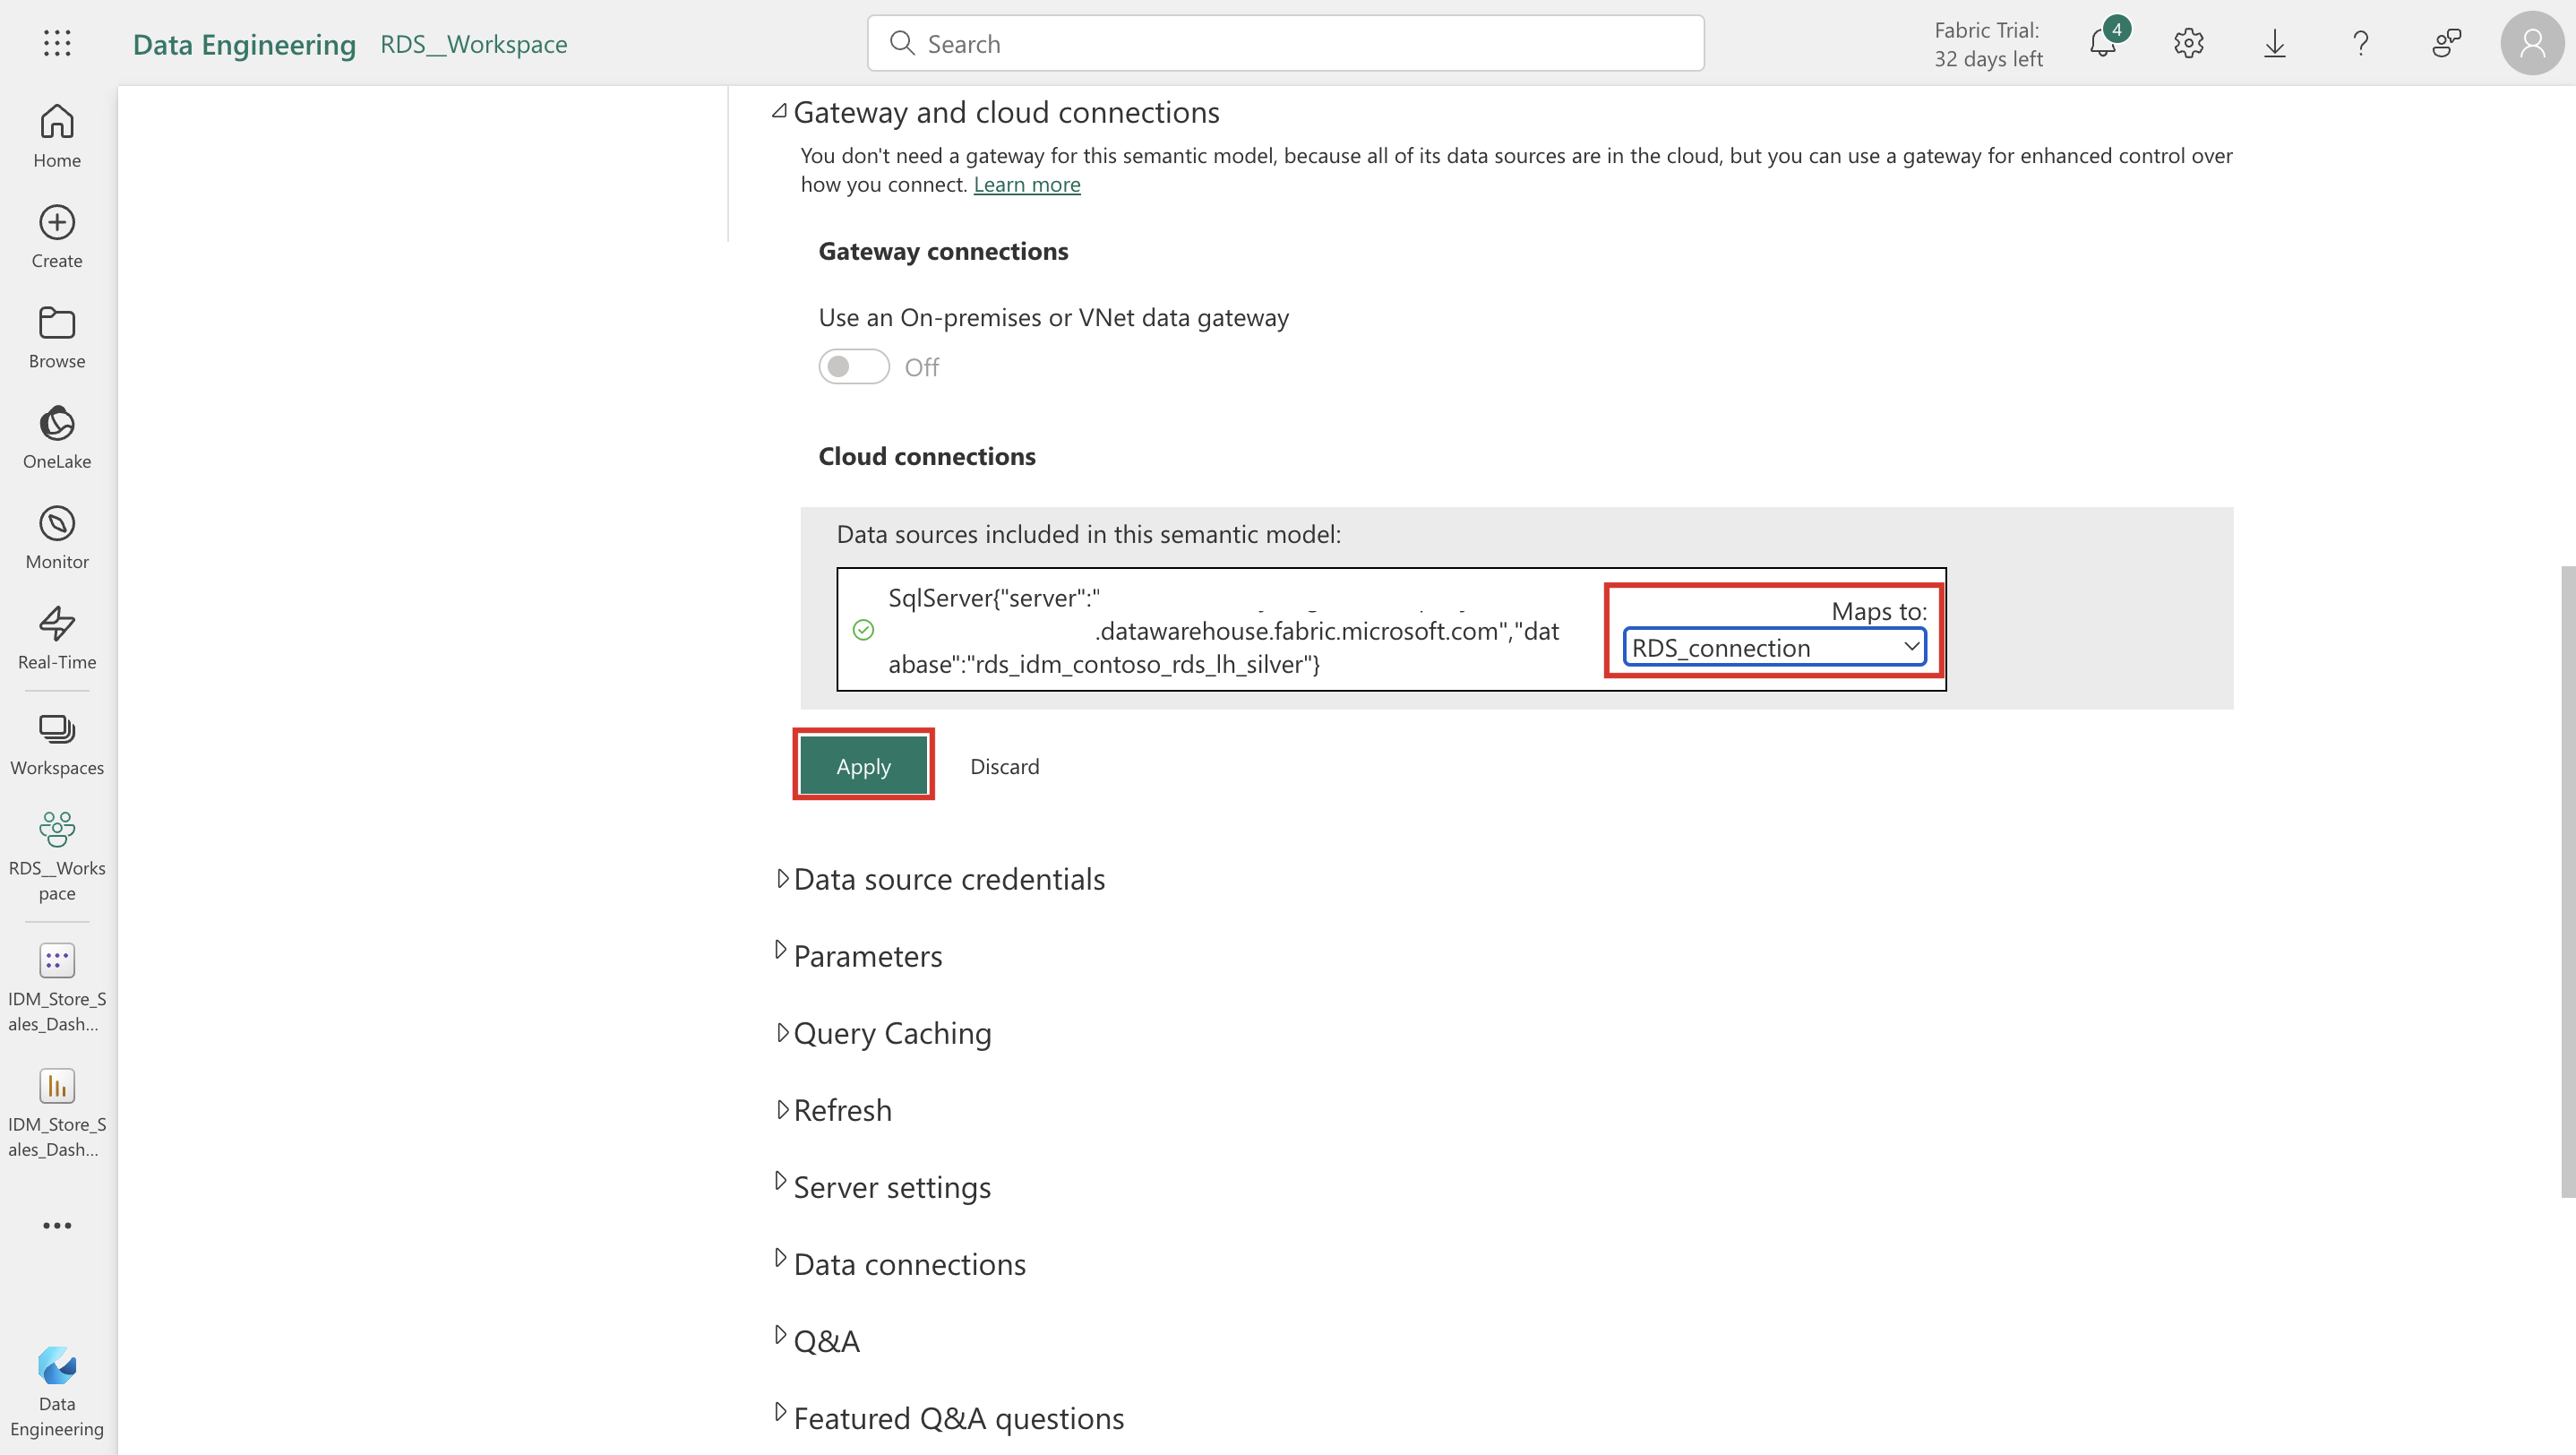
Under Gateway and cloud connections, select RDS_connection. Then select Apply.
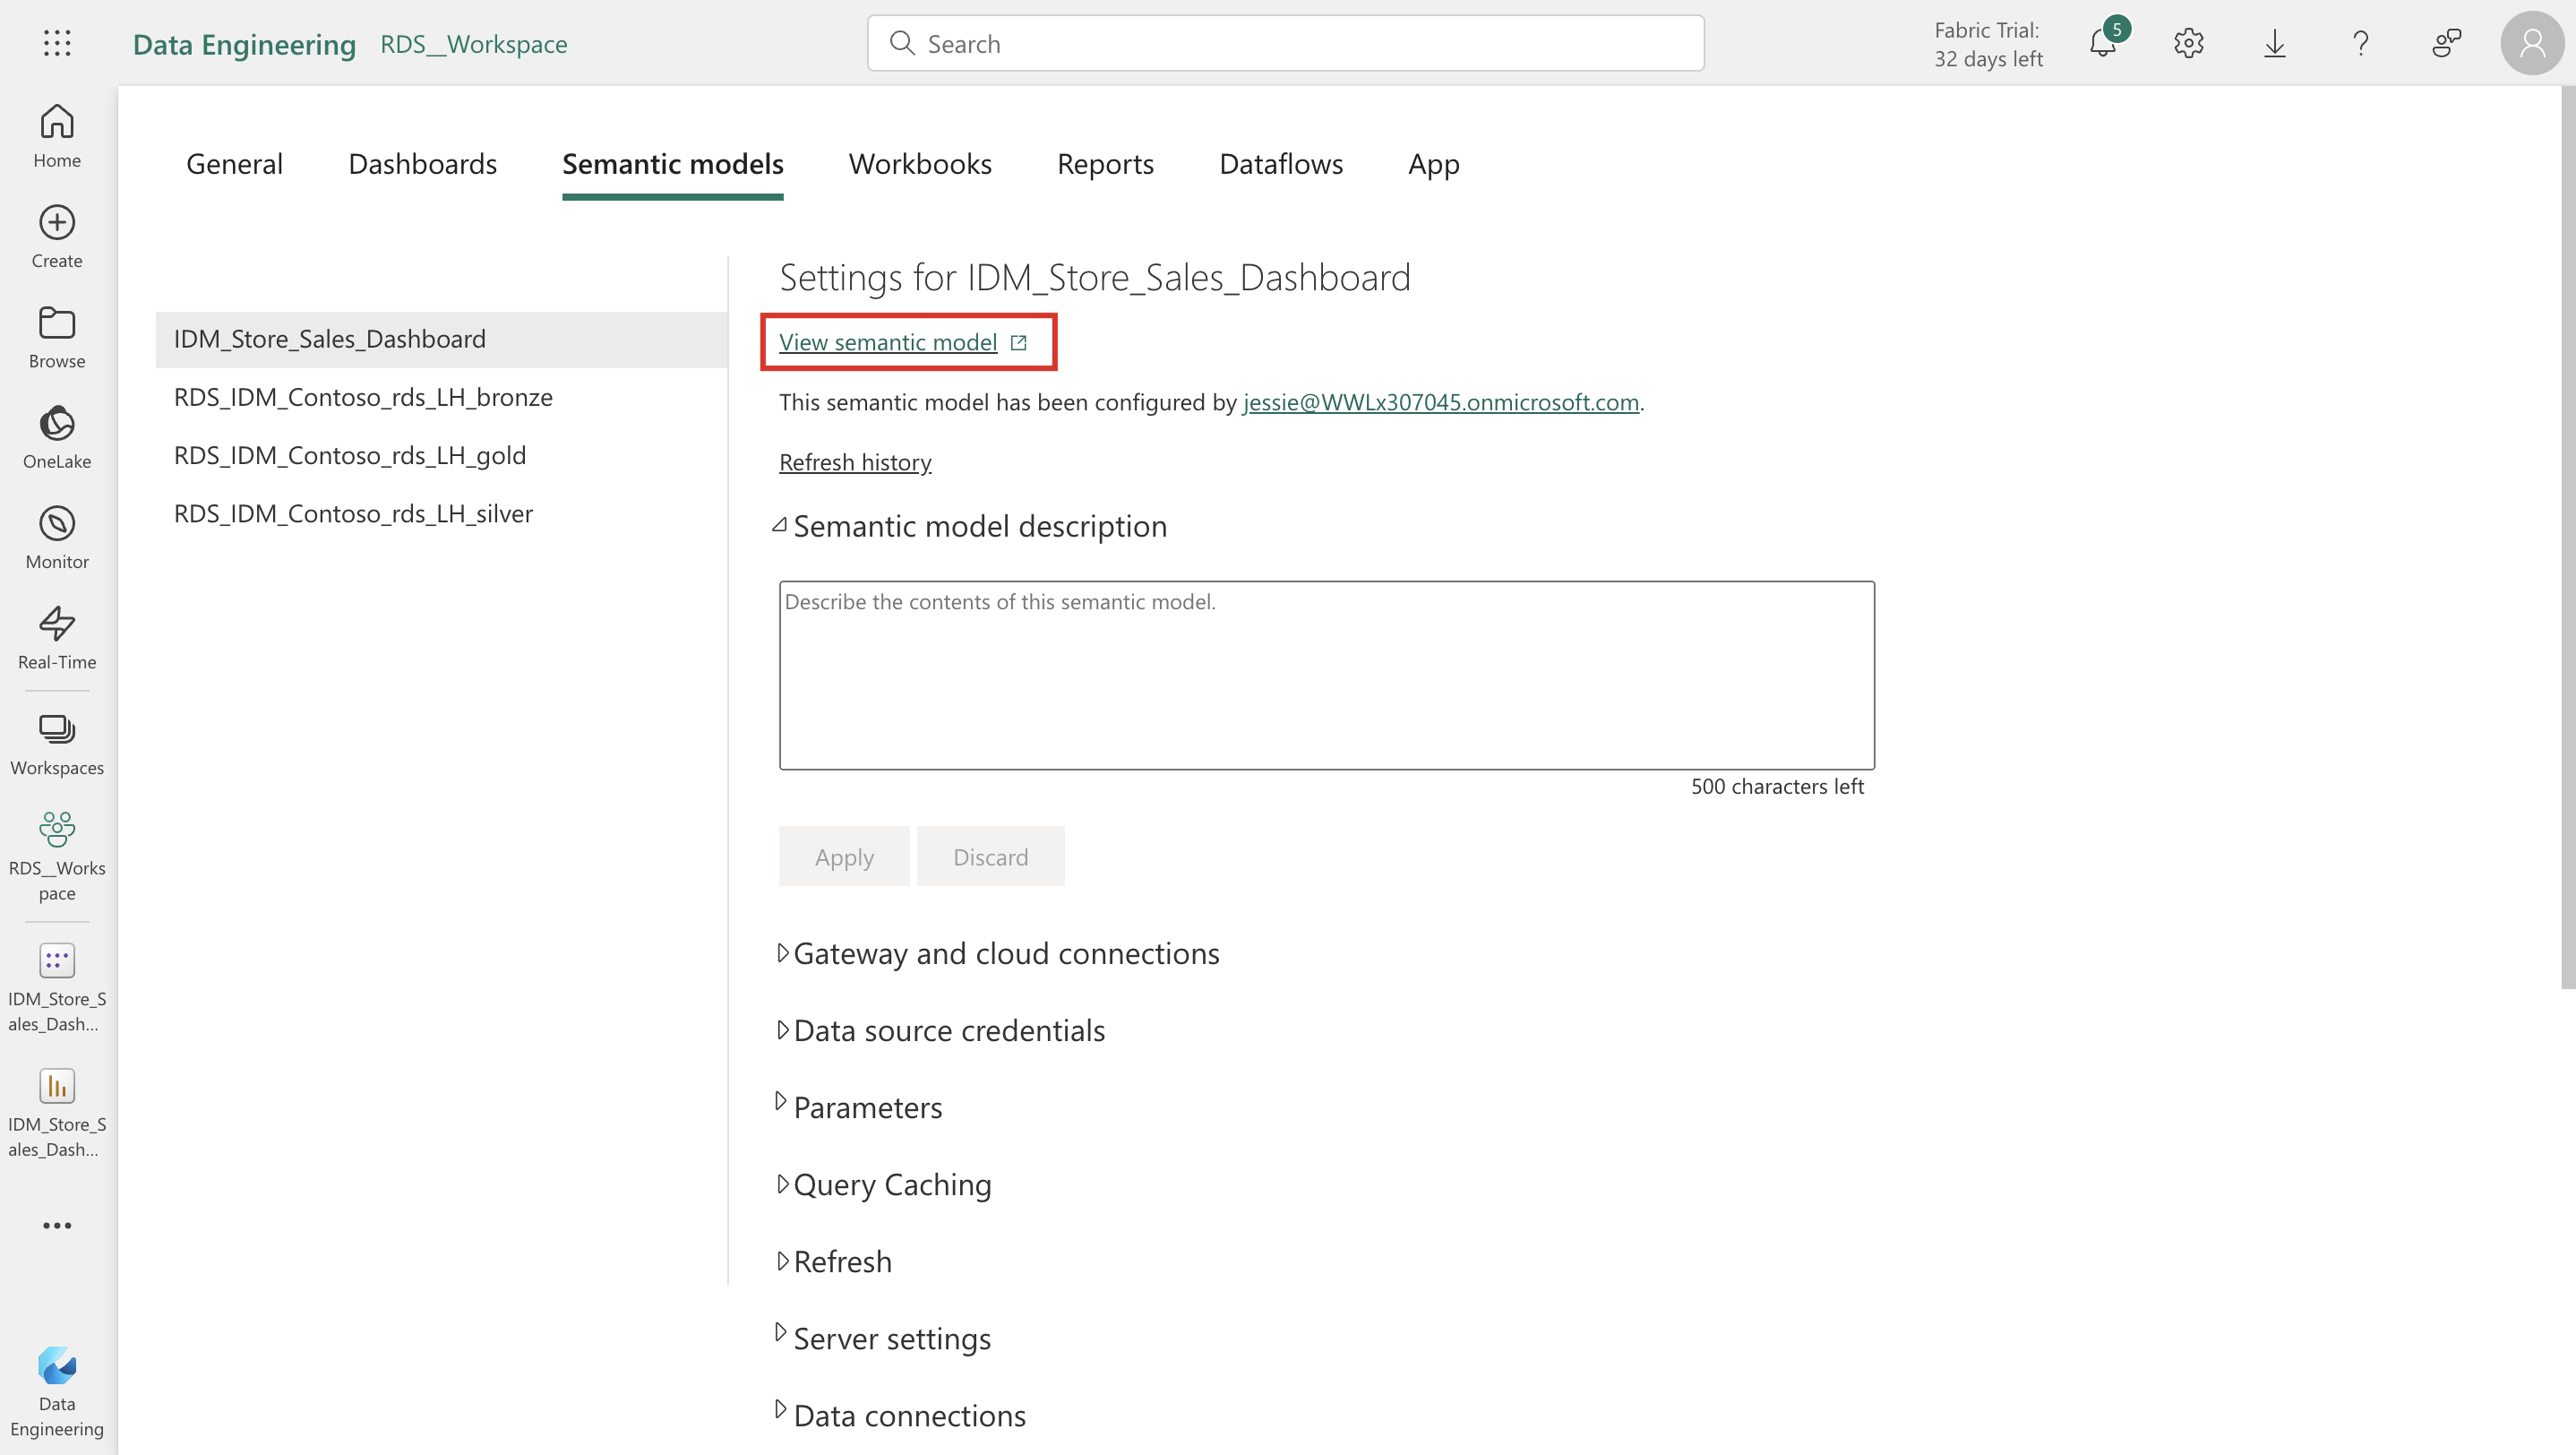
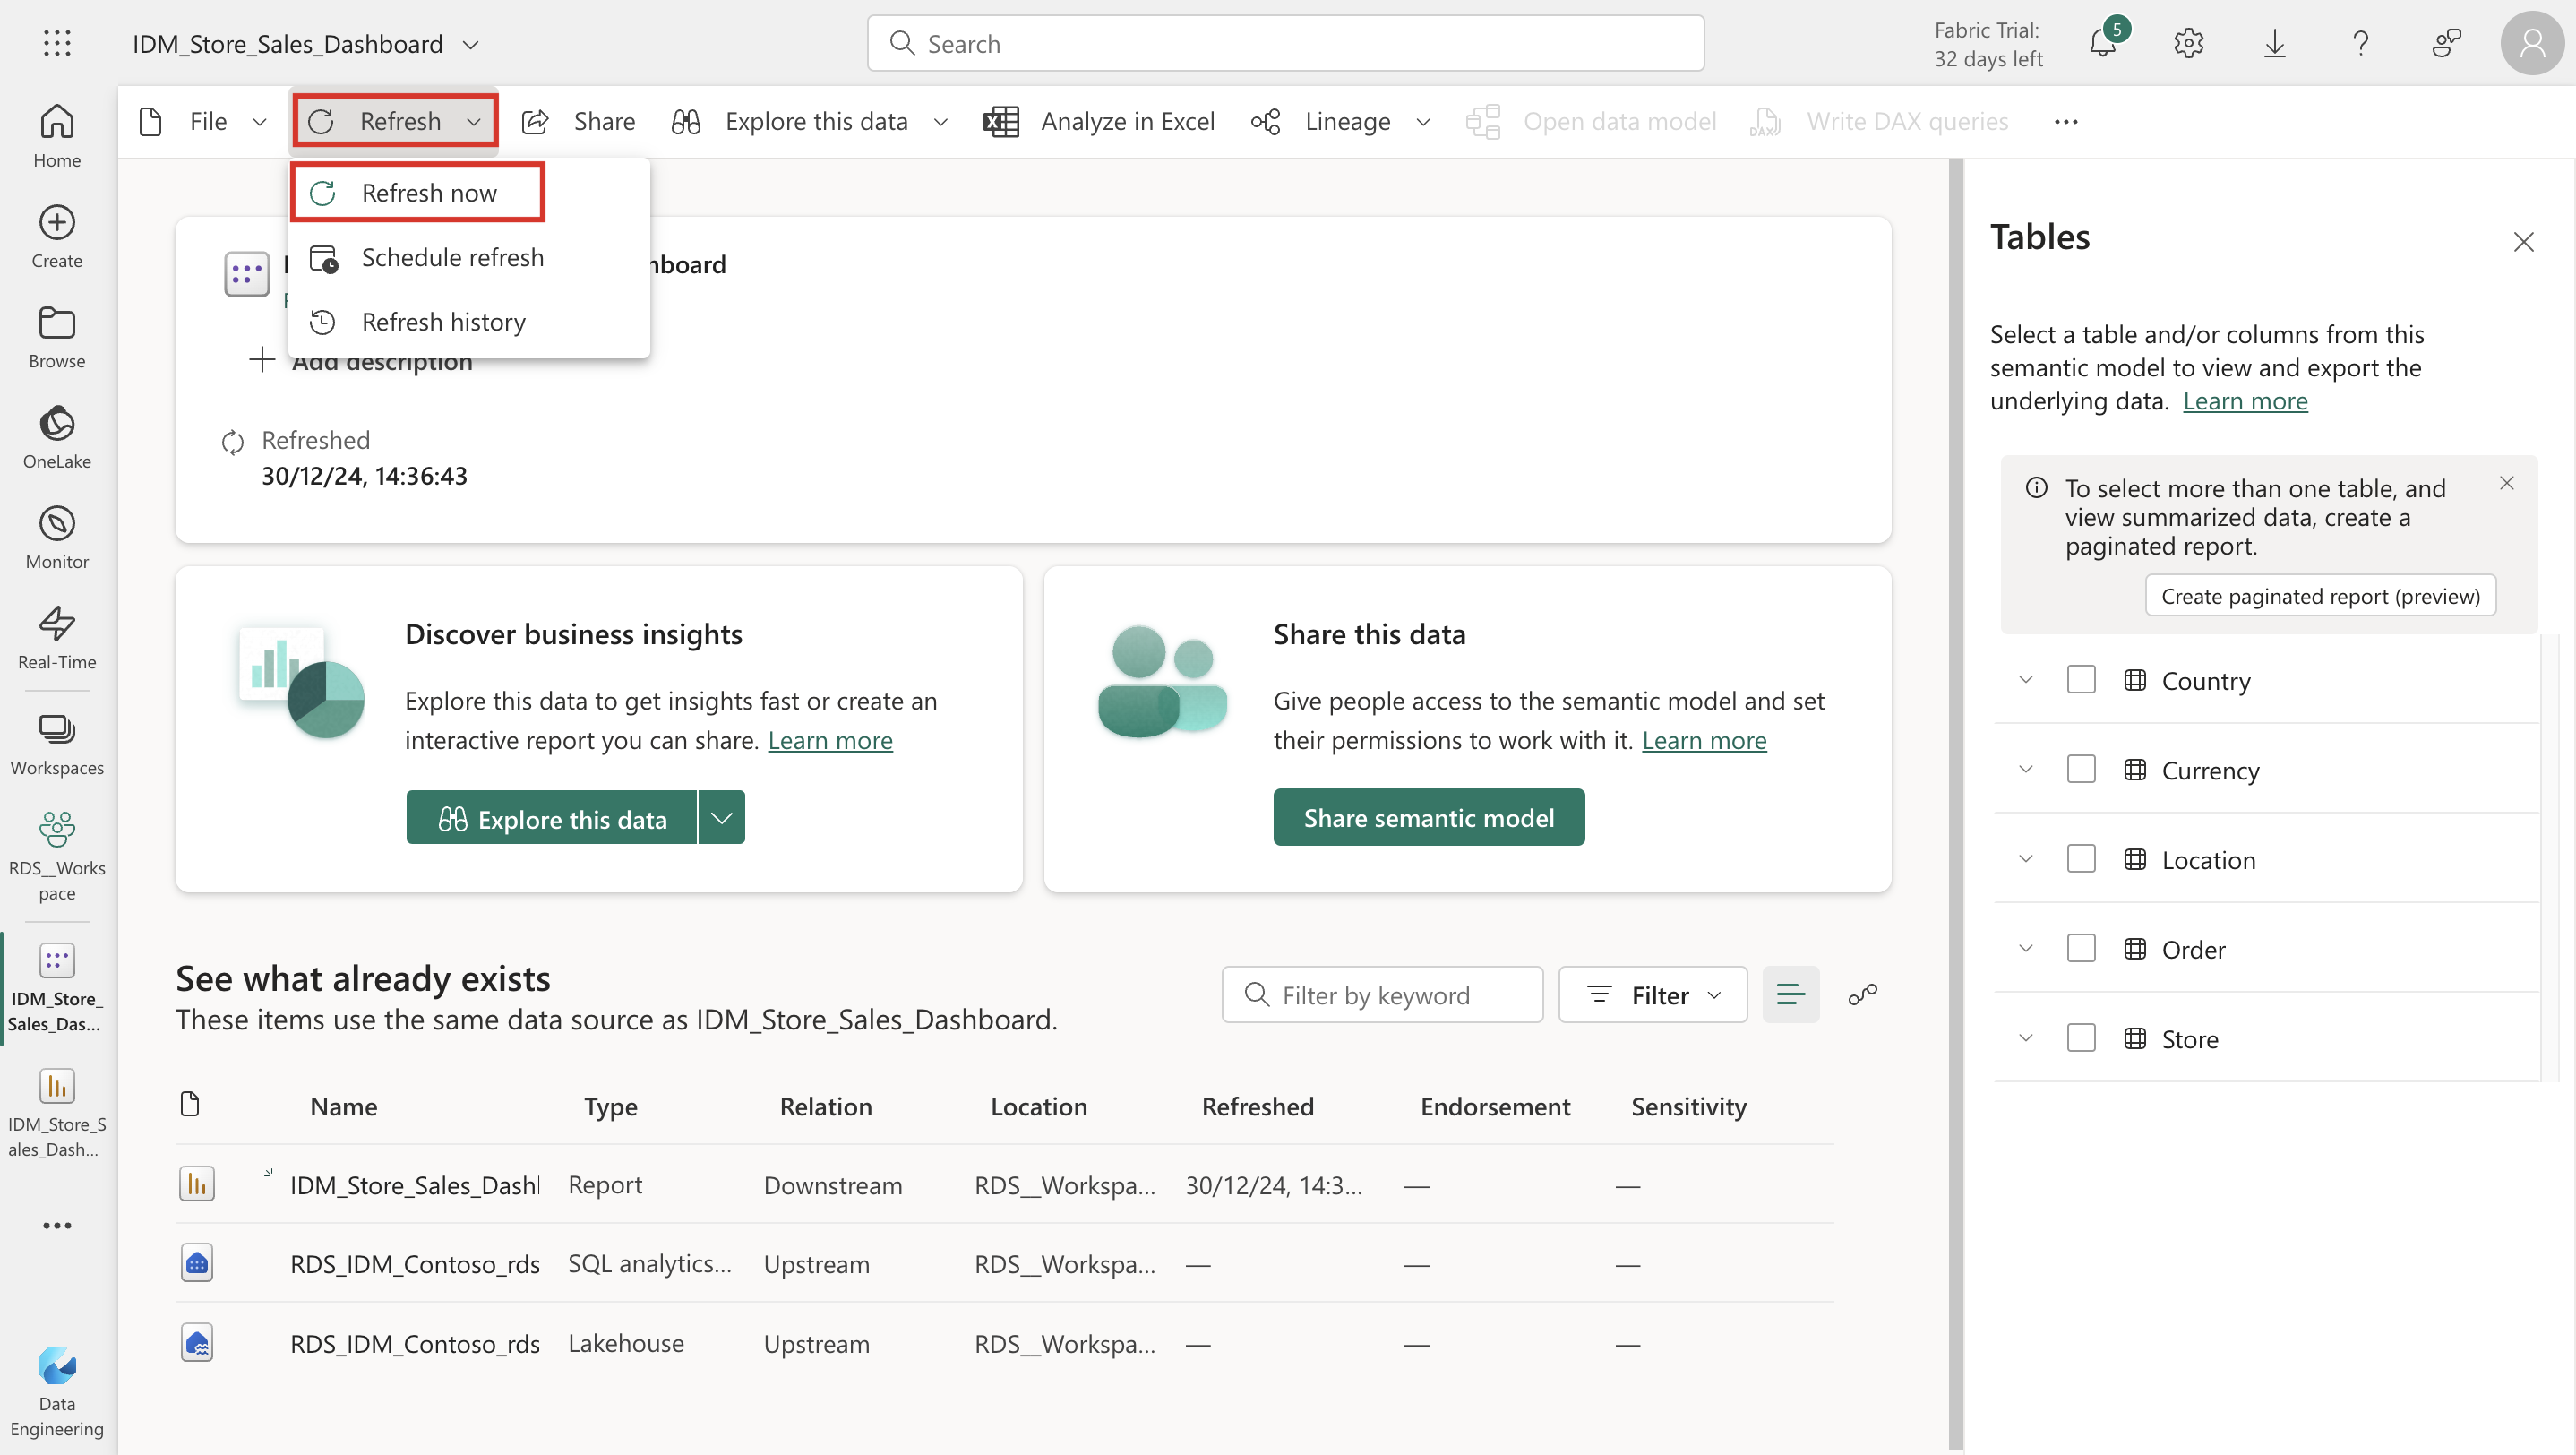
Go to the semantic model by using the link in the settings called View semantic model.
Select Refresh > Refresh now to refresh the semantic model.


Congratulations, you successfully uploaded a report that visualizes the data in Retail industry data model.