Exercise - Add a testing widget to your dashboard
In this unit, you'll add a widget to your dashboard to help visualize your test runs over time.
Add the widget to the dashboard
In your Azure DevOps project, select Overview, and then select Dashboards.
Note
If you ran the template to create the Azure DevOps project, you won't see the dashboard widgets you set up in previous modules.
Select Add a widget.
In the Add Widget pane, search for Test Results Trend.
Drag Test Results Trend to the canvas.
Select the Gear icon to configure the widget.
a. Under Build pipeline, select your pipeline.
b. Keep the other default settings.
Select Save.
Select Done Editing.
Although the widget displays only one test run, you now have a way to visualize and track test runs over time. Here's an example that shows a few successful test runs.
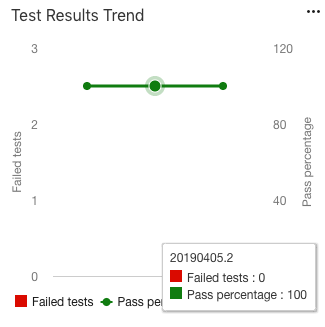
If you begin to see test failures, you can select a point on the graph to navigate directly to that build.