Enhanced cash flow forecasting
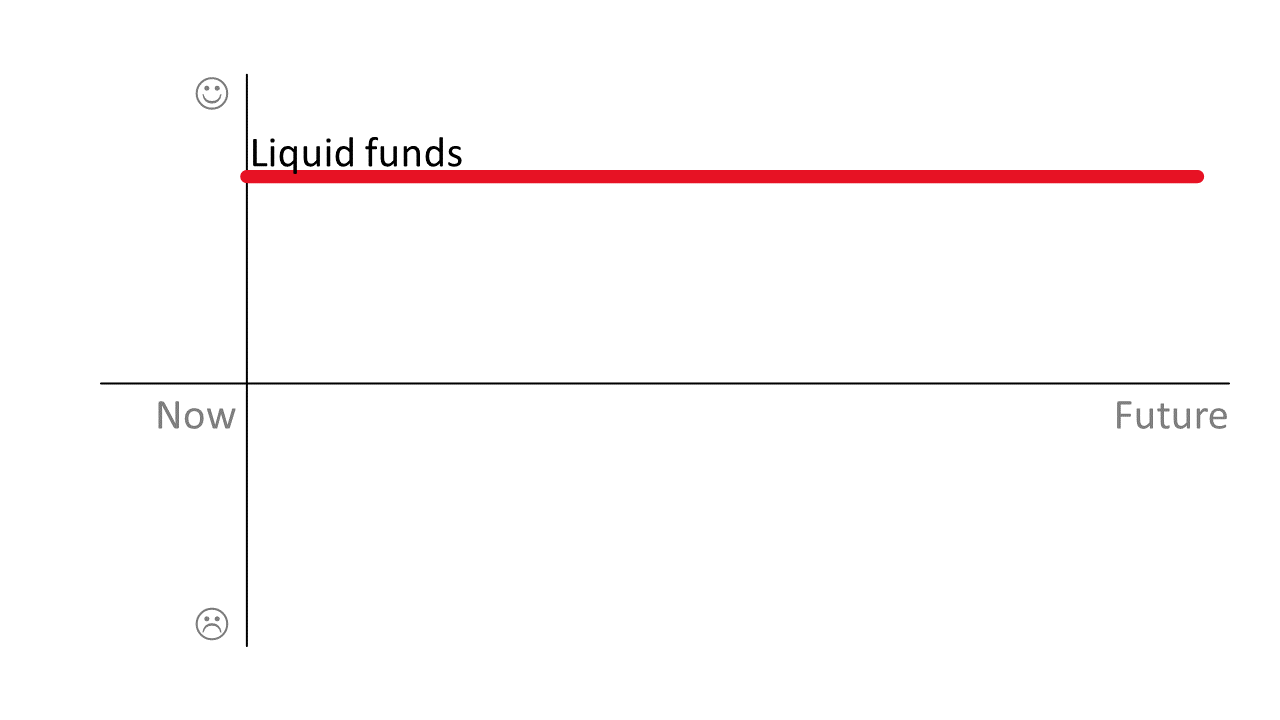
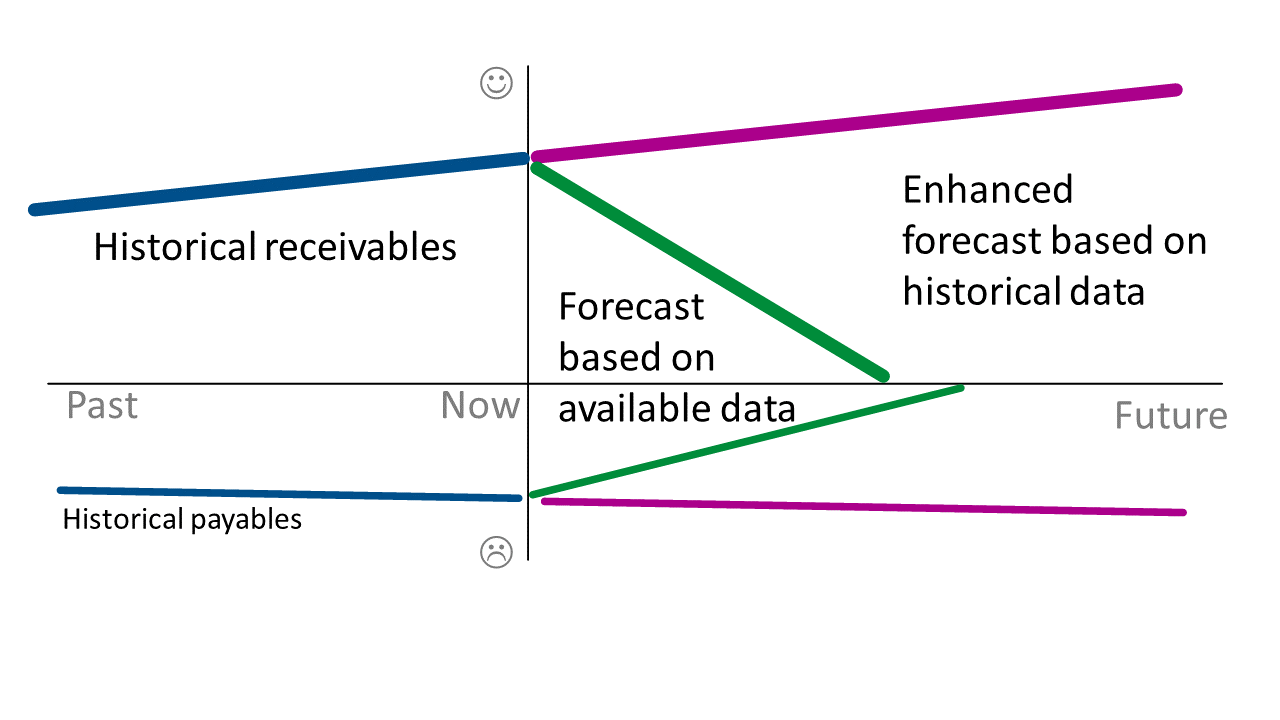
A basic cash flow forecast is based on known facts. First, the forecast determines the current state of your liquid funds. Typically, this data comes from balances in bank and cash accounts, but it can also include other accounts.
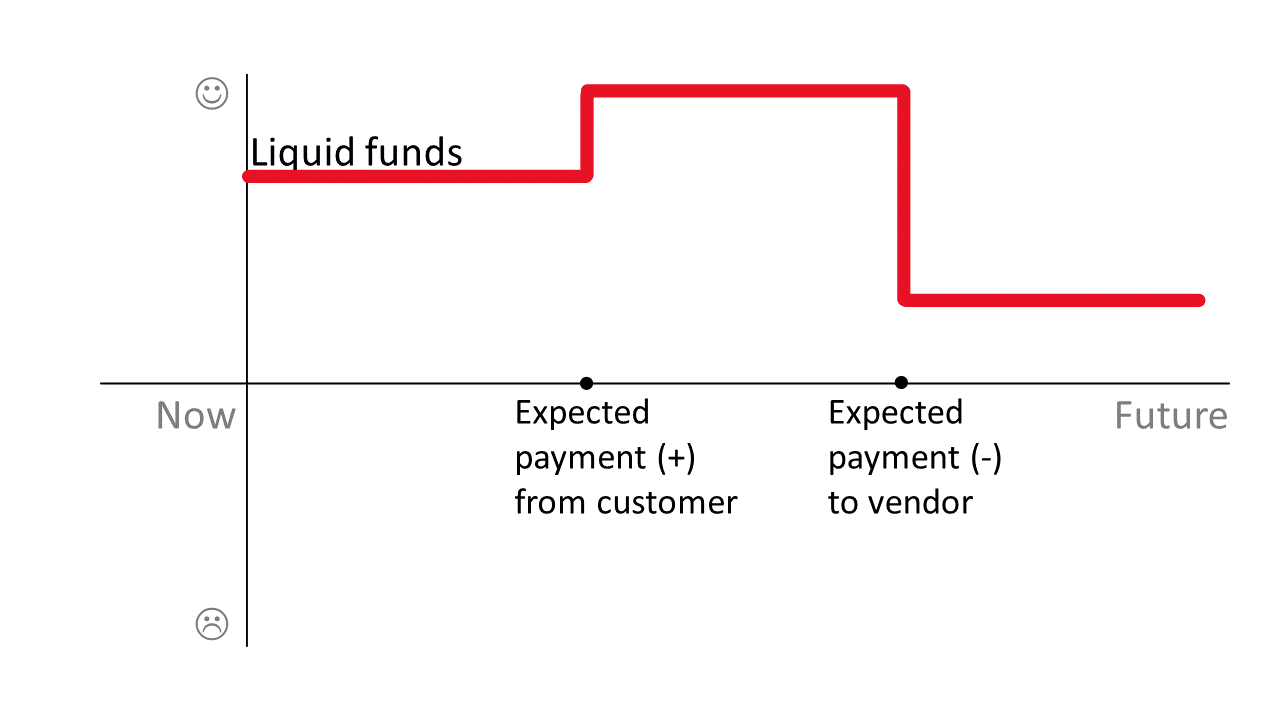
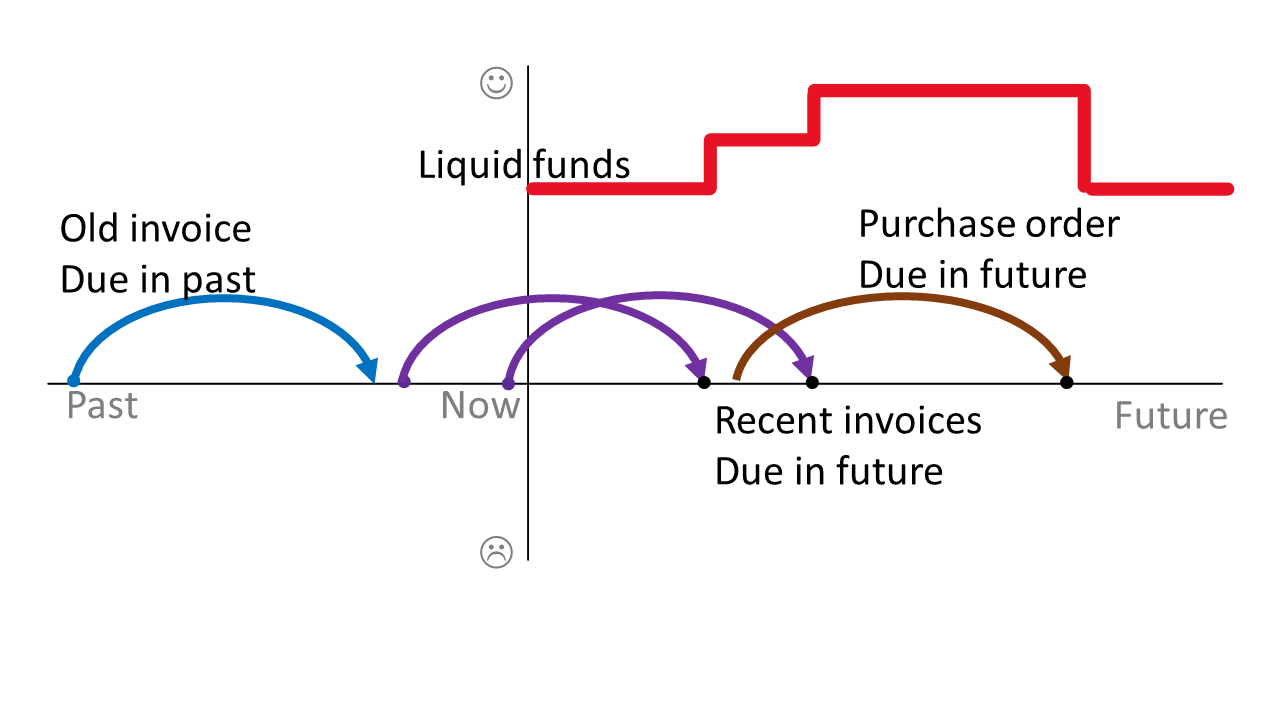
Next, the forecast will add or remove cash amounts based on payments that you know you'll make or receive in the future. This data comes from open entries in the customer ledger and vendor ledger, such as posted sales and purchase invoices, which also contain the due dates for the payments.
Though ledger entries are reliable, they are also a restriction in terms of forecasting because they have due dates based on payment terms, which most businesses use. Due dates limit the horizon, or how far into the future you can forecast. For example, if the payment terms for sales invoices are 1W (one week), the forecast doesn't have data for eight days from the current date.
One way to extend the horizon for the forecast is to manually enter budgeted numbers based on known agreements with vendors and customers, for example, by including adjustments for sales, purchase, and service orders, and revenue from jobs. Though the risk is that these transactions will be canceled or their due date will be moved, they are still considered good input.
For example, you can manually enter budgeted amounts on the following pages:
G/L Budgets, where you can specify various dates
Cash Flow Manual Expenses, for items like rent, internet, and cell phones
Cash Flow Manual Revenue, for interest or return of loan
The budgeting tools are excellent for registering expenses and revenue. However, they are not practical for extending the horizon of a cash flow forecast because of the amount of manual work that they require.
Instead, you can use Azure Machine Learning from Cortana Intelligence to extend the horizon for your cash flow forecasts. Business Central can use models that deal with time series data to calculate forecasts:
ARIMA (Autoregressive Integrated Moving Average)
ETS (Exponential Smoothing State Space)
STL (Seasonal Decomposition of Time Series by Loss)
TBATS (Exponential Smoothing State Space with Box-Cox transformation, ARMA errors, Trend and Seasonal components)
You can also use some of these models in combination, such as ETS + ARIMA and ETS + STL, which in some cases can improve the accuracy of forecast values.
Like basic cash flow forecasts, these models rely on historical data, including:
Customer ledger entries for receivables
Vendor ledger entries for payables
Tax/VAT entries for taxes
What these models do differently is apply advanced statistical methods to the historical data to generate data in the future and include that data when calculating the forecast. When you predict receivables or payables, you would use the due date as a date field and not the document date or posting date, so you don't need to define and apply a payment term to the predicted results.
You can specify the model to use in the Time Series Model field on the Cash Flow Setup page. If you are unsure about which model to choose, you can select the All option and Business Central will use each model to calculate a forecast, compare the results, and return the best result.
Azure Machine Learning is free in Business Central; you only need to turn it on. However, you will have a limit to the amount of compute time you can use every month. Selecting the All option will use more of that time than a single model would. When you have reached the limit, you'll need to wait until the next month or switch to your own subscription.
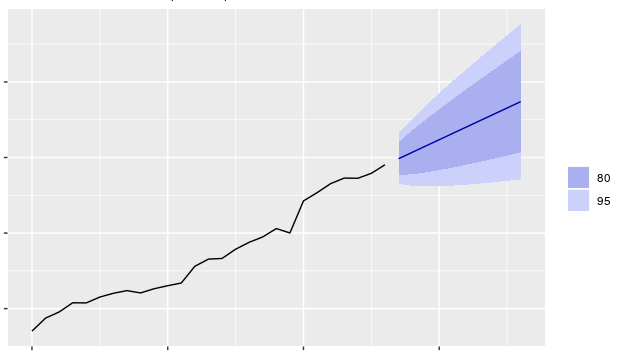
The forecasted value is a range that the value is expected to be within, with some probability, and is not a single datapoint. The default probability is 80 percent, and it isn't possible to change this setting by using UI.
If you have data for at least two years, you can forecast values up to four months ahead with reasonable quality. If you have less data than that amount, you should use a shorter horizon.
Otherwise, the range of predicted values can be too wide and therefore useless. Limited help comes with prediction, if it can be wrong 100 percent of the time. For that reason, threshold was introduced, which you can adjust on the Cash Flow Forecast Setup page. The Variance % field allows you to specify a range of deviation, plus or minus, that you'll accept in a forecast. Lower percentages represent more accurate forecasts and typically range between 20 and 40 percent. Forecasts outside the range are considered inaccurate and are ignored.
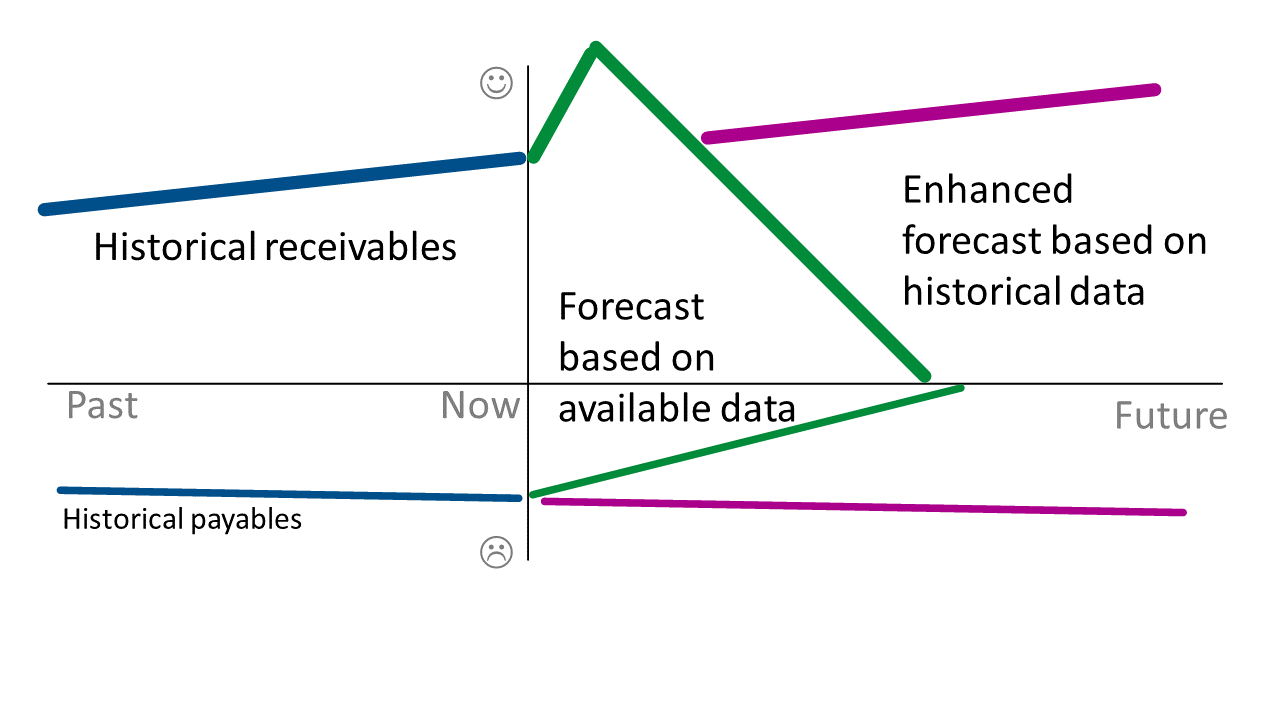
Because you would predict starting from the current date, you need to align predicted values with values that are already registered in the system, such as open customer ledger entries or sales orders. The following simplified case illustrates this logic.
For the last two years, you have sold 10 pencils each month. In the middle of the month, someone asks you, "How many pencils will you sell next month?" Based on the history, your answer would probably be 10.
Now, a customer arrives at your shop and wants to order six pencils next month. However, this order does not change what you expect to sell next month. You still expect to sell 10 pencils in total, but you now know that six of them will go to that customer.
The same notion is true for revenue and expenses. If you have reliable information about revenue in an upcoming period, such as when an order is placed, then that amount becomes actual and should be removed from the predicted revenue.
However, if someone comes to your shop and orders 15 pencils for next month, the amount is higher than the 10 that you expected, so your forecast is adjusted from 10 to 15.
