Exercise - Shape data with canvas apps
In this exercise, you'll shape data in your canvas app.
You'll need to download the spreadsheet to complete this exercise. Select download once the link opens. Extract the Excel spreadsheet and upload the spreadsheet to your own OneDrive.
Add a Data Source
Sign into Power Apps.
Select + Create on the left side.
Select Start with a blank canvas.
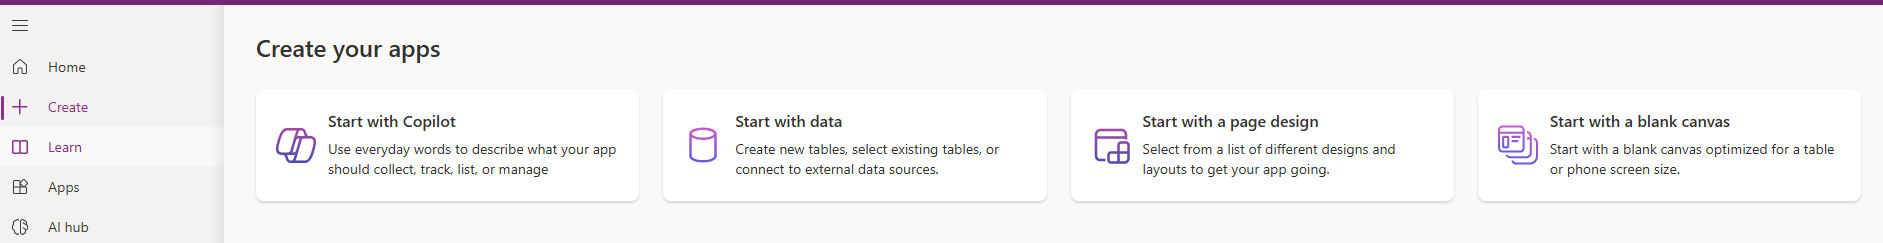
Select the Tablet size.
Select the Save icon in the top right corner and name it "ShapeData."
Make sure you have added this Excel spreadsheet to your OneDrive.
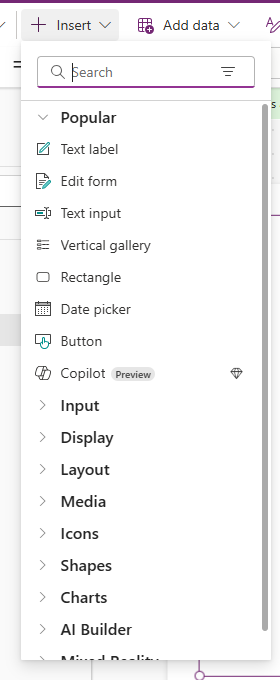
On the Insert dropdown, select Vertical Gallery.
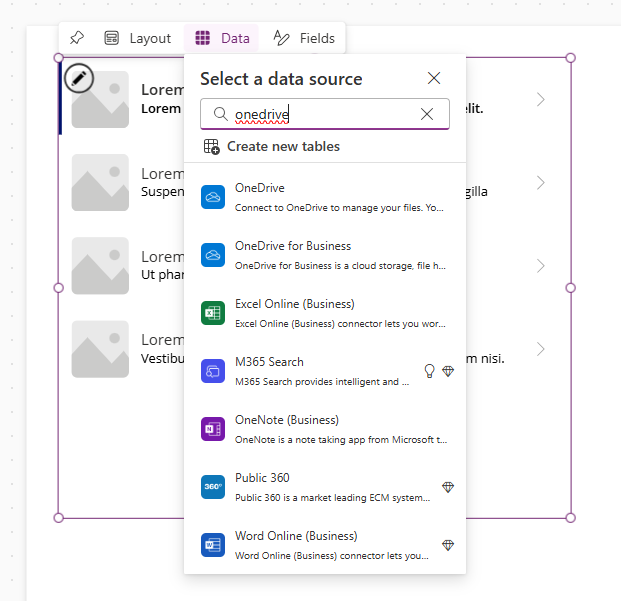
In the Search box of the pop-up menu that appears type OneDrive for Business and select OneDrive for Business from the list. You could have also expanded Connectors and scrolled through all the available connectors until you found the OneDrive for Business connector.
Select + Add a connection.
At the bottom of OneDrive for Business, select Connect.
When prompted to Choose an Excel file, navigate to where you stored the Excel file you downloaded in step 3 and select it.
Check the Items table and then select Connect.
You have connected to your Excel table in OneDrive for Business list, and you can display the data in the gallery control.
Format data in your gallery
Select on the gallery you have added.
In the properties pane on the right, select the drop-down menu for the Layout property.
Select the Image, title, subtitle, and body layout.
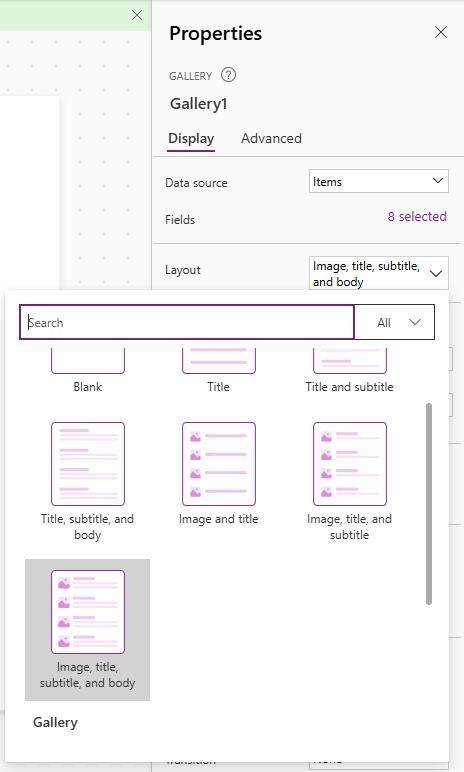
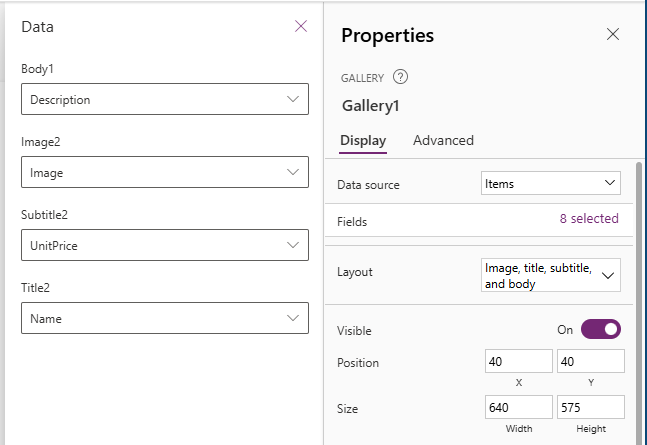
In the properties pane on the right, select the purple 8 Selected text next to the Fields property and set the following points:
Body1: Description
Image2: Image
Subtitle2: UnitPrice
Title2: Name
Select the X towards the right of Data to exit.
On the gallery, select on the price in the first row.
In the formula bar, make sure Text is Selected and type the following.
"$" & ThisItem.UnitPrice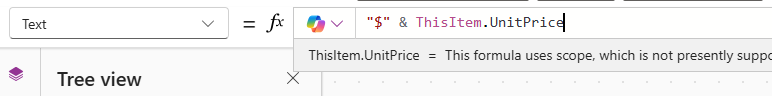
On the gallery, select on the image in the first row.
In the properties pane on the right, select the drop-down menu for the Image Position property.
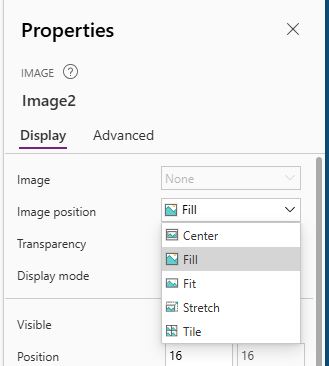
Select Fill and you'll see that the image now fills up the space.
You have now configured and interacted with the data in your gallery.
Filter data in a gallery
Select on the gallery.
Make sure the Items property is selected in the formula bar.
Change the expression to this:
Filter(Items, Origin = "China")Notice that the gallery now only shows two items where the Origin is China.
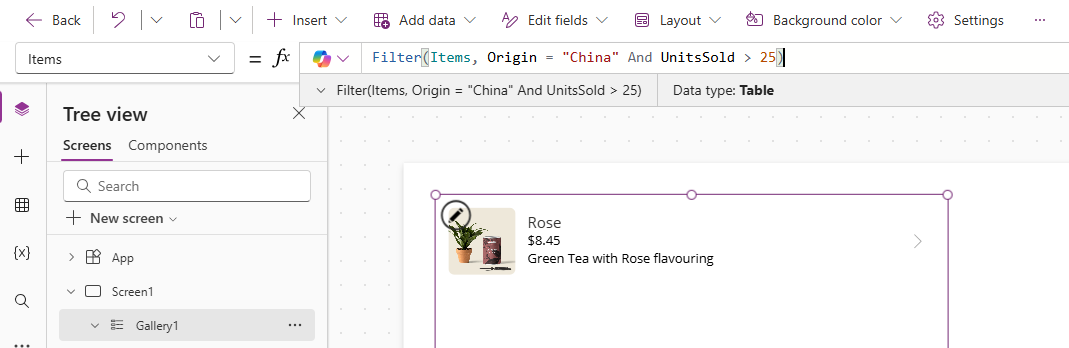
Try doing the same thing but with the And operator:
Filter(Items, Origin = "China" And UnitsSold > 25)Notice that the gallery now only shows one item that matches both the criteria above.
Now we'll change the Items property back to the Items Data Source. We'll revisit this Filter function later.
Items
Using the Search function
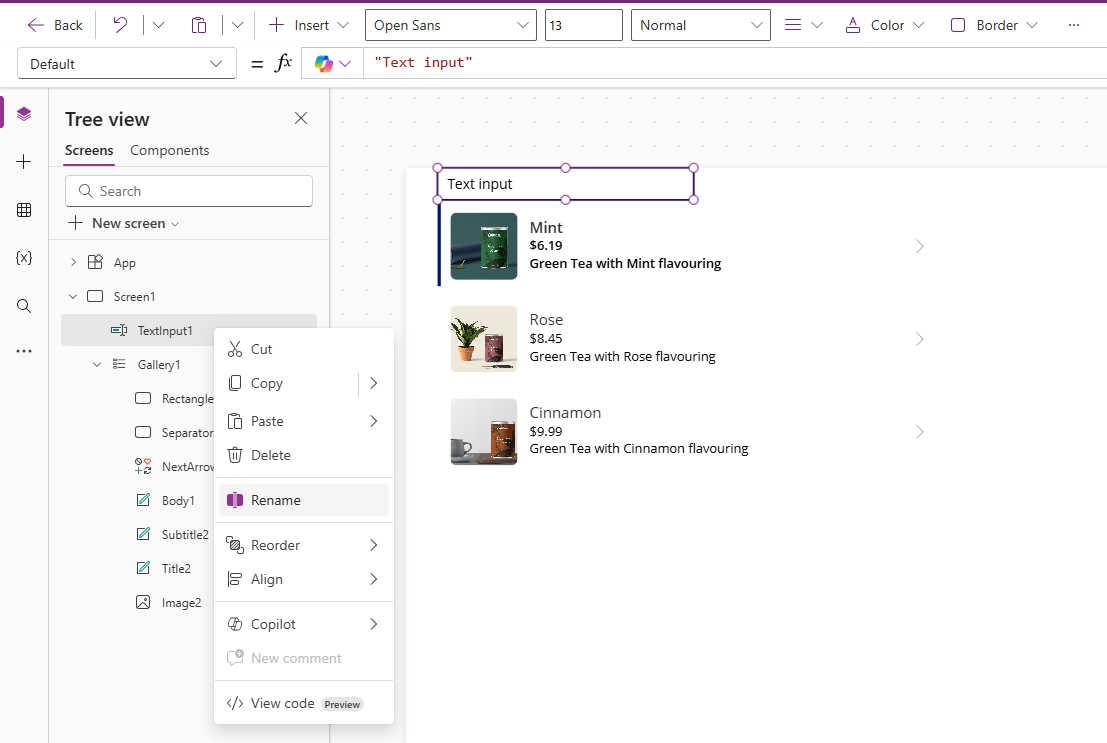
On the Insert dropdown, select Text Input. Position the Text Input above the gallery.
On the left panel, Under Tree View > Screens > Screen1 > select the three dots to the right select Rename to rename the text input to SearchInput. We're renaming this component so we can refer to it later.
Now select on the gallery. Make sure the Items property is selected in the formula bar and then write this expression:
Search(Items, SearchInput.Text, Name)What you have is:
Search(Items...) - A function that allows you to do a more flexible query against a string column.
SearchInput.Text - This retrieves the text typed into the SearchInput text input control.
Name - Represents the column or column where the search is made
This returns all the rows where the Name column contained the value entered in the Text Input control SearchInput.
If you wanted to search more than one string column, you can append the column names at the end of the expression. In the formula below, we've added "Description".
Search(Items, SearchInput.Text, Name, Description)
Combine data shaping functions
As explained in unit 3, you can combine functions for more complex functionality in your application. We have tested the Filter function, and the Search function and it's now time to combine them into one function.
Start with the Search function that we completed in the previous step.
Replace Items with Filter(Items, Origin = "China") which will then make your expression look like this:
Search(Filter(Items, Origin = "China"), SearchInput.Text, Name, Description)
For the Search function, the first option you're required to provide is a table of data. The Filter function returns a table of data. This means it's possible to use the Filter function as a data source for your Search function. By adding this as the formula for the Items property of your gallery control, you're displaying to your users the data they need with the added ability to Search.
Within Power Apps, you can utilize the concept of using one function to supply information to another function in many places.
Move data between collections and data sources
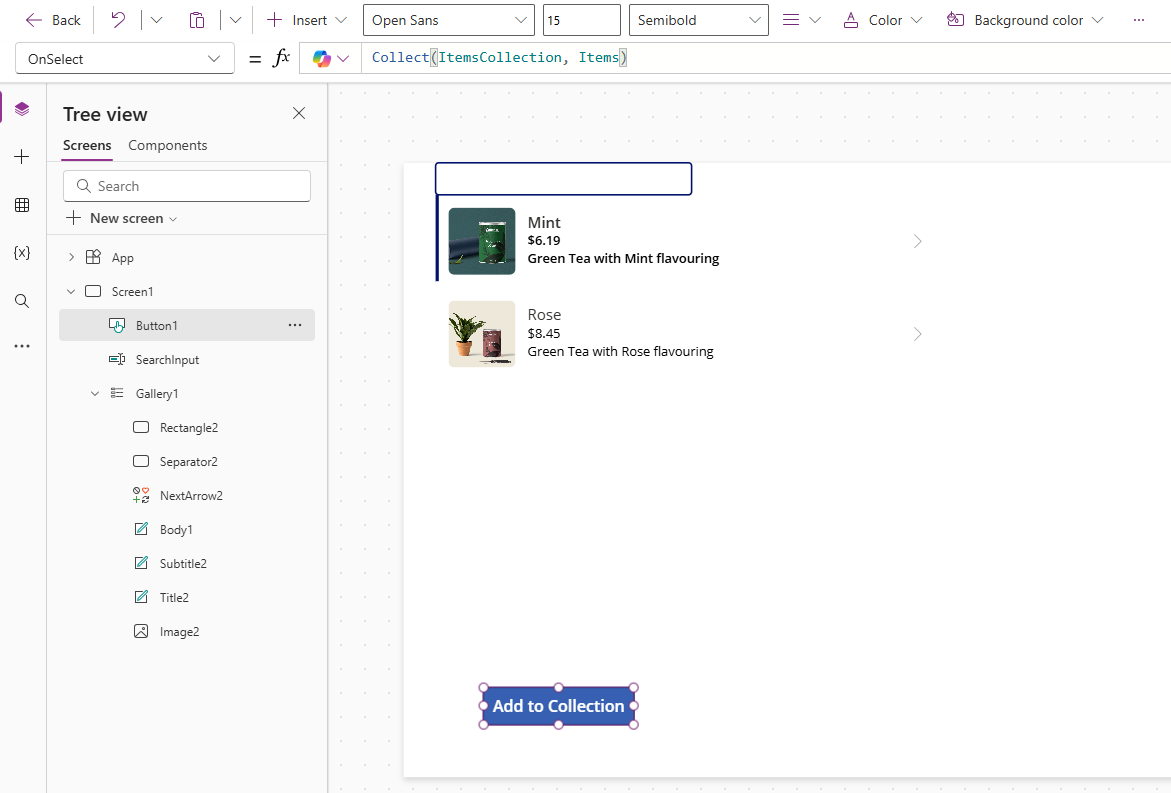
Insert a button control by selecting the Insert dropdown. Then select Button and position the button underneath your gallery.
Change the text on the button to Add to Collection.
Select on the button, and in the formula bar, replace false with this expression:
Collect(ItemsCollection, Items)ItemsCollection - Refers to the Collection name
Items - Refers to the Data Source name
Collect - Will copy all rows from the Items into the ItemsCollection collection
Play (preview) the app using the Play icon in the top right corner. Press the Add to Collection button. Close out of the play preview by selecting the X in the top right corner.
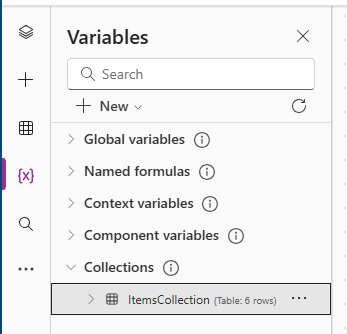
Select the Variables tab on the left side, expand Collections and then select ItemsCollection. You'll then see that all rows from Items data source have been added into the ItemsCollection collection.
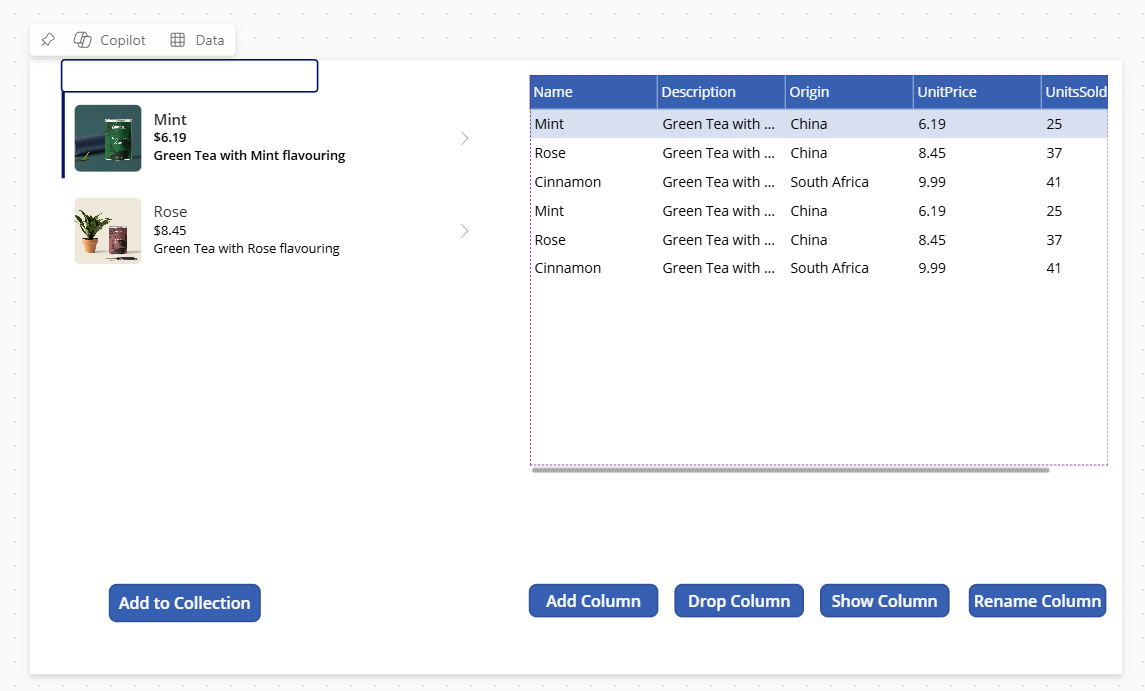
On the Insert dropdown, select Data Table and position it next to the gallery.
In the formula bar, make sure Items is selected and then enter ItemsCollection.
This means that the Data Source for the table is the ItemsCollection collection and not the Items table in the Excel sheet.
In the properties pane. on the right, let's adjust the fields by selecting the purple 2 Selected text next to the Fields property.
Select + Add field.
Select all available columns and then select Add.
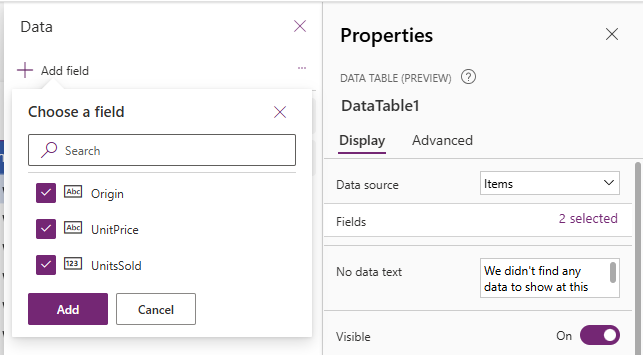
Select the X towards the right of Data to exit.
On the Insert tab, select Button and position your button underneath your table. Repeat this process four times.
Change the text on all four buttons to: Add Column, Drop Column, Show Column, Rename Column respectively.
Select the Add Column button.
Update the formula bar to this expression:
Collect(AddCollection, AddColumns(ItemsCollection, Revenue, UnitPrice * UnitsSold))Here, we have created a new collection called AddCollection, which copies all data from the ItemsCollection collection but in addition, we use the AddColumns function to add a new column called Revenue, which is calculated as UnitPrice * UnitsSold.
Select the Drop Column button.
Update the formula bar to this expression:
Collect(DropCollection, DropColumns(ItemsCollection, UnitPrice))Here, we have created a new collection called DropCollection, which copies all data from the ItemsCollection collection but in addition, we use the DropColumns function to remove the UnitPrice Column.
Select the Rename Column button.
Update the formula bar to this expression:
Collect(RenameCollection, RenameColumns(ItemsCollection, Name, Product))Here, we have created a new collection called RenameCollection, which copies all data from the ItemsCollection collection but in addition, we use the RenameColumns function to rename the Name column to Product.
Select the Show Column button.
Update the formula bar to this expression:
Collect(ShowCollection, ShowColumns(ItemsCollection, Name))Here, we have created a new collection called ShowCollection, which copies all data from the ItemsCollection collection but in addition, we use the ShowColumns function to only show the Name column.
Play (preview) the app using the Play icon in the top right corner. Press all four of the buttons. Close out of the play preview by selecting the X in the top right corner.
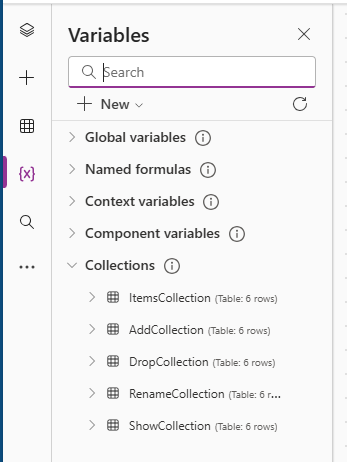
Select the Variables tab on the left side, expand Collections and then you'll then see the collections with the results of selecting the buttons.
Hopefully, you can now see the possibilities of shaping data within your app!