Testing and troubleshooting your app
Now that you learned about performance bottlenecks and some of the ways to mitigate them, this unit discusses testing techniques. These techniques are a combination of guidance, techniques, and discovery that apply both to performance testing and general debugging.
Using the Timer control to get metrics
When it comes to working with data connections for retrieving or uploading data, hard numbers are helpful. In Power Apps, you can use a Timer control to capture how long your formula takes to run. The following scenario shows you how to do that with the following controls:
Button
Timer
Text label
Assume you have a data source called 'Workout tracker', your Timer control is called Timer1 and your Button control has an OnSelect property set to the following:
Collect(colWorkoutTracker, Filter('Workout tracker', Status = "Active"))
To set this up, we first modify the OnSelect formula of the button control to:
Reset(Timer1);
UpdateContext({StartTimer: true});
Refresh('Workout tracker');
ClearCollect(colWorkoutTracker, Filter('Workout tracker', Status = "Active"));
UpdateContext({StartTimer: false})
This formula starts by resetting the timer. Then it updates a context variable that we use to start/stop the timer to "true." Then it builds the collection and then sets the context variable back to "false."
You need to update a property on the Timer control next; set the Start property to the following:
StartTimer.Now insert a Text label control to display the time.
For the Text property of the Label control, set the formula to the following:
Timer1.ValueNow preview the app and select the Button.
With your app in preview mode, selecting your button displays how long the collection took to create in milliseconds.
Note
The timer control will not start counting unless the app is in Preview mode.
This technique works when you want to understand exactly how long a specific query is taking. You could log this data to a different collection and then average the numbers to determine how long it takes. You can also apply this concept when submitting data. Remember to test not only from your local computer but from all of the scenarios for your user's environments.
Test where your users use the app
This is more advice than technique. For most app builders, the best place to run an app is from the local PC they use to build the app. Testing from that machine generally gives the best case results but might not match your user's experience. Far too often they forget to test the way the user runs the app. For example, if you're going to build a mobile app that runs over a cellular network then make sure your testing includes the same. Understanding the smaller form factor of the mobile device and the latency of a varying internet connections needs to factor into your app's design. The previous timer testing method is great here. Compare the app's query or upload performance between your PC, your mobile phone on Wi-Fi, and your mobile phone on cellular data. Determine if you're satisfied with all three scenarios or if you need to optimize your app for the slower network.
Use labels to help with testing
As your app incorporates more complex logic and more behind the scenes variables to facilitate that logic, consider using label controls as part of your testing toolkit. Simply adding a label to the screen that displays the value of the variable can go a long way to helping you understand why your app is or isn't doing something. You can use this during the building and testing phase. When your app is live, you can add other functionality for hiding and showing these troubleshooting tools.
While you are in the Power Apps Studio you can also select File and Variables to see all of your variables, their values, where they were created, and where they're used in the app.
Another way to use labels during the build process is to add a label to the welcome screen where you manually display a version number. Power Apps caches your app to optimize your experience. When you're publishing repetitively, like when customizing a SharePoint form, it can be confusing to know which version of the form you're seeing as you might see a cached version. By adding a label with v1 or v2 in the corner, you can always check the version.
Preview versus Published apps
Using the preview capability of the Power Apps Studio gives you great insight into how your app runs when you publish it. But sometimes you might find some inconsistency due to cache or other things your local PC is doing versus what the published app does in the player. Always remember to test your app after it publishes in a manner that is consistent with how the user uses the app.
Looking at the network activity of your app
Now that you learned about testing from within the app you need to look at actual network calls and performance. To do this, you can use the built-in Monitor function. This allows you to view the individual network calls made by your app and view details, such as time that each call takes. From a performance point of view, this can be valuable.
To access Monitor, you can either select the Advanced tools icon from the left-side toolbar, or you can select the App checker icon from the command bar. With both options, you see a link to Open Monitor.
Once you select Open Monitor, a monitor session opens up in a separate browser tab with a blank event list and a message saying "You have started a new Monitor session."
Monitor now tracks and logs every app action, including network performance. You can use this to see calls to the data source, how long they're taking, and what information is coming/going.
One example of a way you can use this is to determine if a performance lag, as measured by the Timer control from the previous example, is within your app, the network, or the data source. You place the app in Preview mode and begin using it as a user would. In the example below, we used our example with the button and the timer control to see how long it takes to get the data from our source and build the collection. Notice the information that comes back provides time stamps, category, operation, result, result info, status, duration (in milliseconds), data source, and the selected control (from the app).
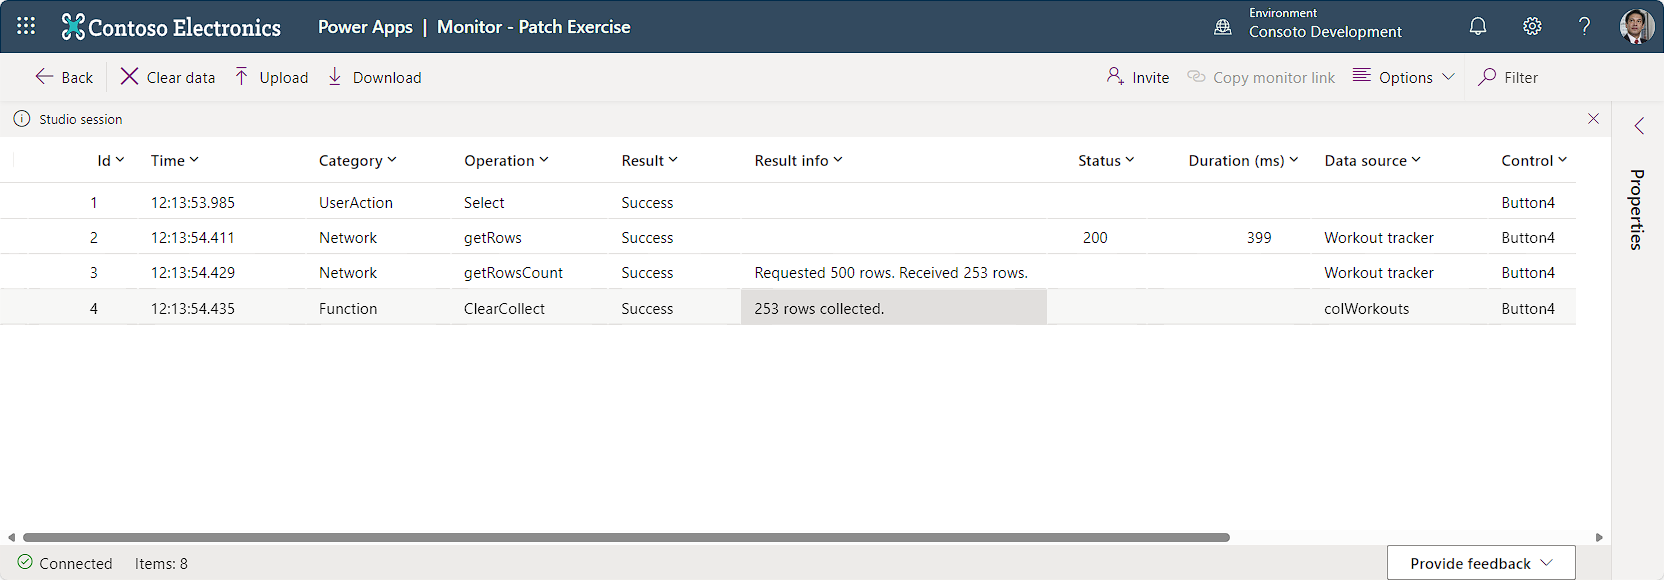
In this instance, most of the time was spent waiting on the data source to filter the data and respond. This tells you that you can't make the call faster by changing the app. Instead, you would need to focus on refining the query or speeding up the data source.
Monitor allows some nice functionality that we don't completely cover in this module. Look for a link in the summary unit if you want to learn more about it. All of the techniques we covered can help you test and troubleshoot your app.