Error analysis on a model
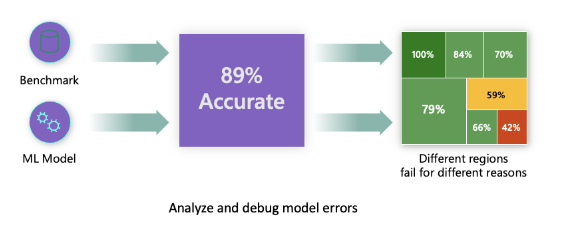
Traditional performance metrics for machine learning models focus on calculations based on correct vs incorrect predictions. The aggregated accuracy scores or average error loss show how good the model is, but don't reveal conditions causing model errors. The overall performance metrics such as classification accuracy, precision, recall, or Mean Absolute Error (MAE) scores are good proxies to help you build trust with your model. However, they're insufficient in locating where in the data the model has inaccuracies. Often, model errors aren't distributed uniformly in your underlying dataset. For instance, if your model is 89% accurate, does that mean it's 89% fair as well?
Model fairness and model accuracy aren't the same thing but they both must be considered. Trying to discover the different regions of your data where the model is failing 42% of the time (the red region in the following diagram) is challenging, unless you take a deep dive in the model error distribution. The consequence of having errors in certain data groups can lead to fairness or reliability issues. To illustrate, the data group with the high number of errors might contain sensitive features such as age, gender, disabilities, or ethnicity. Further analysis could reveal that the model has a high error rate with individuals with disabilities compared to ones without disabilities. So, it's essential to understand areas where the model is performing well or not. Because the data regions where there are a high number of inaccuracies in your model might turn out to be an important data demographic you can't afford to ignore.
This situation is where the error analysis component of Azure Machine Learning Responsible AI dashboard helps in identifying a model’s error distribution across its test dataset. Throughout this module, we use the diabetes hospital readmission classification model scenario to learn and explain the responsible AI dashboard.