Use Power BI to analyze Call Quality Dashboard data
The Call Quality Dashboard (CQD) also provides Teams administrators with access to Power BI reports. These reports include summary reports, help desk reports, user feedback reports, mobile device reports, and more.
Before an organization can use the Power BI query templates (PBIX files) for Microsoft Teams Call Quality Dashboard (CQD), it must download and install the Microsoft Call Quality connector for Power BI. The installation process uses the MicrosoftCallQuality.pqx file that's included in the download.
Note
The Microsoft Call Quality connector only supports DirectQuery in Power BI; Import mode is not supported.
Install Microsoft Call Quality connector for Power BI
Complete the following steps to download and install the Microsoft Call Quality connector for Power BI:
Check to see if your computer already has a [Documents]\Power BI Desktop\Custom Connectors folder. If not, create this folder.
Download the Microsoft Call Quality Connector for Power BI (either a *.mez or *.pqx ) and place it in the Custom Connectors directory.
If the connector file is a *.mez file, you'll also need to adjust your security settings as described in the custom connector setup documentation.
If a new version of the Microsoft Call Quality connector is released, replace the old connector file in the Custom Connectors directory with the new file.
Set up the Microsoft Call Quality Power BI Connector
To build a report and run queries, you must first complete the following steps to connect to the CQD data source:
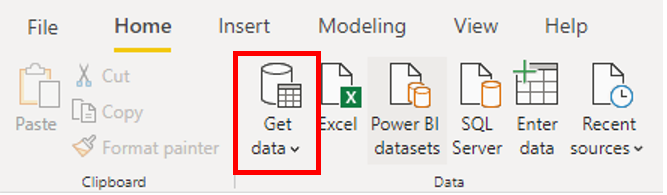
In the Home tab on the Power BI portal, select Get Data.
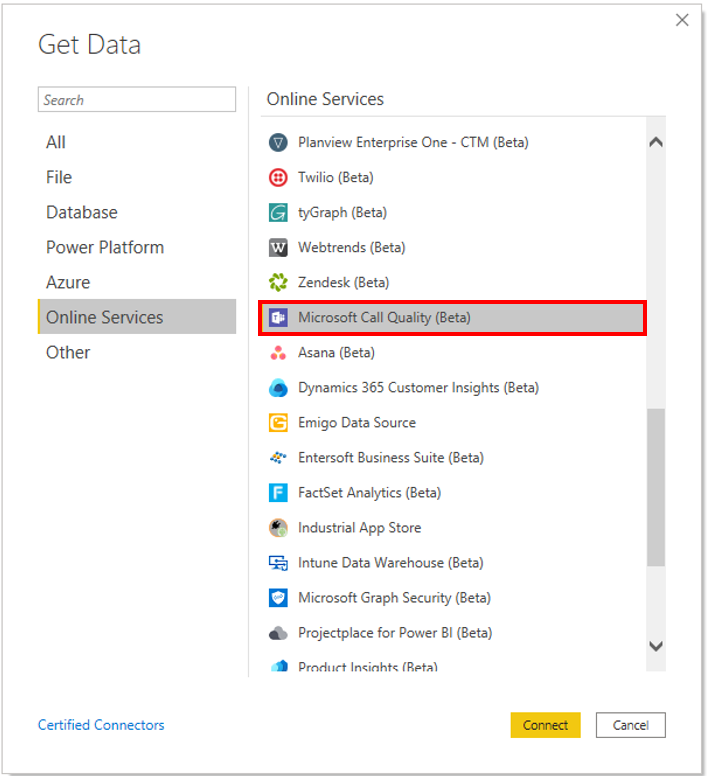
The Get Data window that appears, select Online Services, select Microsoft Call Quality (Beta), and then select Connect.
You'll then be prompted to sign in. Use the same credentials that you used to sign into the Call Quality Dashboard.
You'll then be prompted to select between two Data Connectivity modes. Select DirectQuery and then select OK.
You'll receive a final prompt showing you the entire data model for Call Quality Dashboard. No data will be visible at this point, only the data model for CQD. Select Load to complete the setup process.
At this point, Power BI will load the data model onto the right side of the window. No queries will be loaded by default.
With the CQD data sources loaded, you're now ready to build a query and display data. Continue to the next section for instruction on how to build a query.
Build queries
Microsoft Call Quality Power BI Connector enables you to build your own custom reports. You can use customizable Power BI templates that have been predefined by Microsoft as a starting point for a new report's layout, data model, and queries.
| Power BI templates | Description |
|---|---|
| QER.pbit | The Quality of Experience Report (QER) template empowers customers to proactively identify issues that are impacting the Teams meeting and calling experience before they escalate. Reports are also provided to enable administrators to respond quickly to escalating issues and help answer the question, "What happened during the meeting?" This template provides the following reports: Search,Meeting Health Details, User Health Details, Media Health, Media Setup, Media Reliability, Audio/Video/Sharing Health, Audio/Video/Sharing Health Details, VPN, Top 10 Reports, Dailies, Usage, User Feedback, Transport, Devices, Clients, Building Data, PSTN Health and User Details, and Network Metrics. |
| CQD Teams Auto Attendant & Call Queue Historical Report.pbit | This template provides the following three reports: - Auto Attendant – showing analytics for calls coming into your Auto Attendants. - Call Queue – showing analytics for calls coming into your Call Queues. - Agent Timeline – showing a timeline view of agents being active in Call Queue calls. |
| CQD Helpdesk Report.pbit | Integrating building and end-user personal information, this report is designed to let you drill up from a single user to find the upstream root cause of poor call quality for that user (for example, the user is in a building that's experiencing network problems). |
| CQD Location Enhanced Report.pbit | Reimagining CQD SPD location reports. Includes 9 reports, providing Call Quality, Building WiFi, Reliability, and Rate My Call (RMC) information with other drill-thrus by Building or by User. Make sure you upload the building data to maximize your reporting experience. |
| CQD Mobile Device Report.pbit | Provides insights tuned towards mobile device users, including Call Quality, Reliability, and Rate My Call. View mobile network, WiFi network, and mobile operating system reports (Android, iOS). |
| CQD PSTN Direct Routing Report.pbit | Provides insights specific for PSTN calls that go through Direct Routing. |
| CQD Summary Report.pbit | Better visualizations, improved presentation, increased information density, and rolling dates. These reports make it easier to identifier outliers. Drill into call quality by location with an easy-to-use interactive map. 9 new reports: - Quality Overall - Reliability Overall - RMC (Rate My Call) Overall - Conference Quality - P2P Quality - Conference Reliability - P2P Reliability - Conference RMC - P2P RMC |
| CQD Teams Usage Report.pbit | Shows how users in your organization are using Teams and how much. Make sure you upload the building data to maximize your reporting experience. |
| CQD User Feedback (Rate My Call) Report.pbit | Shows Rate My Call data in a way that you can easily use to help support calling for your organization. Cross reference with feedback to identify end-user education opportunities. |
Limitations
Despite making use of Power BI, not all Power BI functionality is support by the Microsoft CQD Connector for Power BI does not support all Power BI functionality, either as a result of limitations on CQD data model or on DirectQuery connectors in general. The following are some of the Connector’s more noteworthy limitations:
Calculated Columns – DirectQuery connectors in general have limited support for calculated columns in Power BI.
Aggregations – The CQD data model is built on a cube model. Attempting to manually add aggregations to different dimensions or changing the aggregation type of a measure will not work with the Connector, and it will generally result in an error.
Custom Visuals – While the CQD Connector does work with a range of custom visuals, we are unable to guarantee compatibility with all custom visuals.
Referencing Cached Data – Power BI currently does not support referencing cached data from a DirectQuery connector in any way.
Relative Date Filtering – This is supported in the CQD Connector, but only with the Start Time and End Time dimensions.