Create a process mining report
The first steps in understanding your process are:
Create a process in the Power Automate Process Mining desktop app.
Ingest event log data.
Create a report for your process.
It's similar to having a roadmap that guides you on your journey toward process improvement. With its informative charts and graphics, the Power Automate Process Mining desktop app helps you visualize the flow of your data and pinpoint areas that need improvement.
For this exercise, consider a scenario in which you work as an account manager in your company. You can gain access to event log data from the application that your finance team uses to perform its accounts payable refunding process. With this data, you'll use Power Automate's process mining capability to gain a deeper understanding of your invoicing process and uncover valuable insights to transform the way that you do business.
Prerequisites
Before starting this exercise, make sure that you meet the following prerequisites:
Power Automate per-user plan with attended RPA or Power Automate trial license
Download Sample data
Create a report
To create your report, follow these steps:
Sign in to Power Automate.
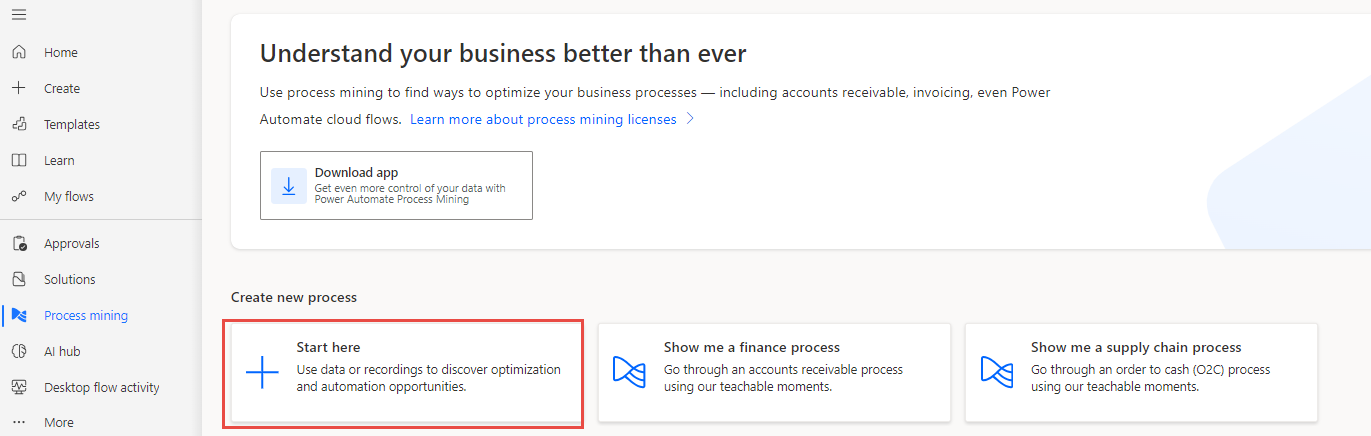
On the left navigation pane, select Process mining.
Select Start here under the Create new process section.
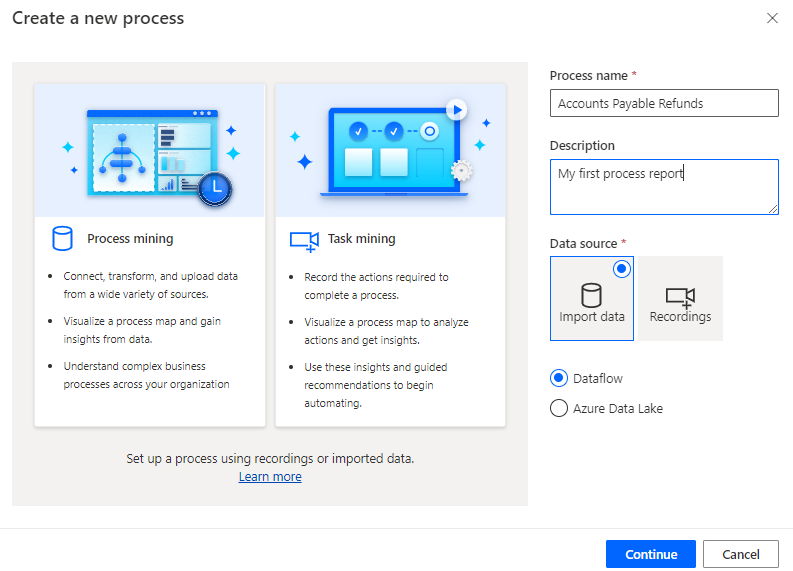
Give your process a name, such as Accounts Payable Refunds.
Optionally, you can provide a description for your process.
Select Import data for Data source, select Dataflow, and then select Continue.
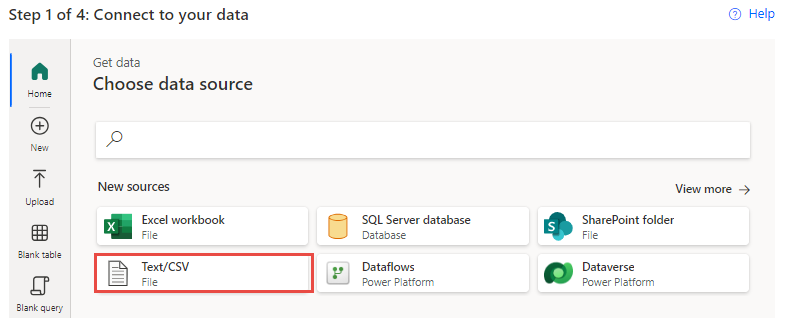
Select a data source from which your organization's event logs area is derived. For this exercise, you upload a CSV file. Select Text/CSV.
Select Upload file.
Select Browse to launch your file explorer.
Select the sample data that you downloaded from the prerequisites, and then select Open.
Sign in if prompted.
After the upload and authentication are successful, select Next.
After a few moments, a preview of the uploaded data should display. (Adjust the File origin, Delimiter, and Data type detection options as needed.) By default, your CSV file should have a File origin type of 65001: Unicode (UTF-8). Additionally, the Comma value should be the Delimiter, and the Data type detection should be Based on first 200 rows. Select Next to continue.
In the Transform your data (optional) screen, you can perform data transformation. That's unnecessary for this exercise. Select Next to continue.
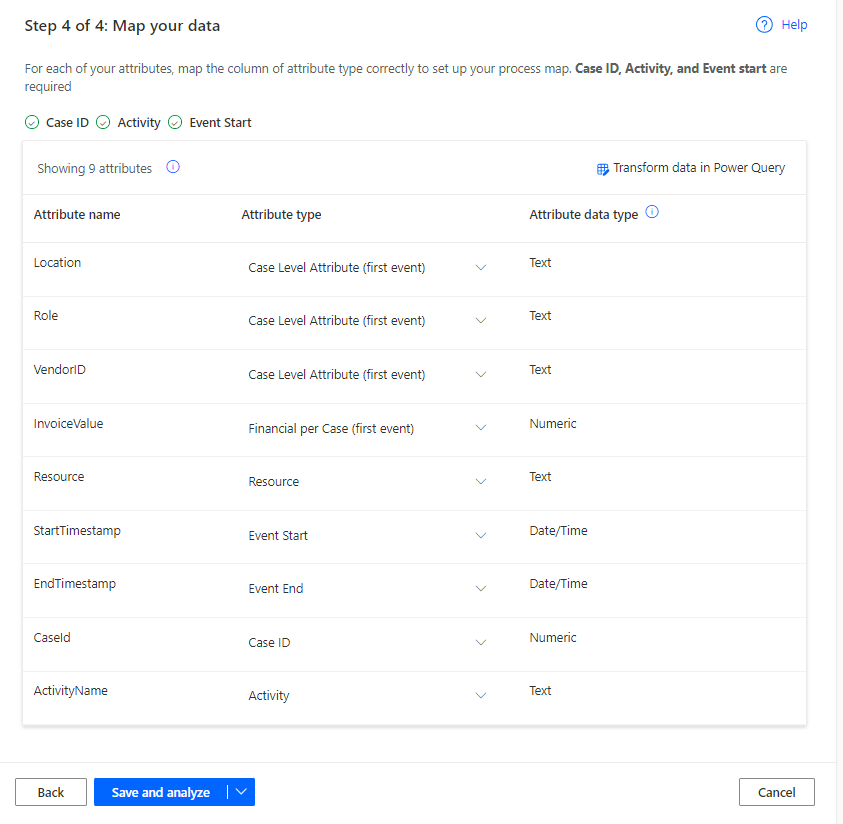
In the Map your data screen, you need to tell Power Automate which attributes you want to map to which attribute types. At a minimum, you need to map the following attributes:
Case ID - A case is a specific instance or run of your process. Case ID influences your process scope. Common examples include identifiers for requisitions, purchase orders, and invoices.
Activity - Activities are the steps or status changes that occur during the process. Examples include purchases, feedback, and survey completion.
Event Start - Timestamp attributes indicate when each activity happens. They're important for analyzing the timing of the process and establishing the order of the activities in your event log.
For this exercise, map the following attributes:
Attribute name Attribute type CaseId Case ID ActivityName Activity StartTimestamp Event Start The other types are optional; however, mapping them correctly helps you to glean more insights from your data. You can now map the other attributes as follows.
Attribute name Attribute type Location Case Level Attribute (first event) Role Case Level Attribute (first event) VendorID Case Level Attribute (first event) InvoiceValue Financial per Case (first event) Resource Resource EndTimestamp Event End Select Save and analyze to continue.


Next, Power Automate analyzes your data and creates a process map. This process might take a few minutes. When the analysis is complete, the system directs you to the Process map screen. On this screen, go to the Summary tab, which shows the process map that Power Automate creates for you. This tab also provides a high-level overview of your process.

Notice that you can select through the other tabs of your process report which include: Map, an enlarged version of the process map depicted in the Summary tab and Variant DNA, which provides you insight on each different path in your process. We'll discuss these in more detail later in the module. For now return to the Summary tab.
Congratulations, you've now created your first process mining report. In the next unit, you'll learn how to use this report to analyze your process.