Visualize relationships in the relationship graph
In the previous unit, you explored entity instances in the ontology preview experience. In this unit, you expand the relationship graph to see how those instances connect, run a query to load real data into the graph, and explore the results interactively.
Expand the relationship graph
From the entity type overview page, select Expand on the relationship graph tile to open the full graph view in Graph in Microsoft Fabric.
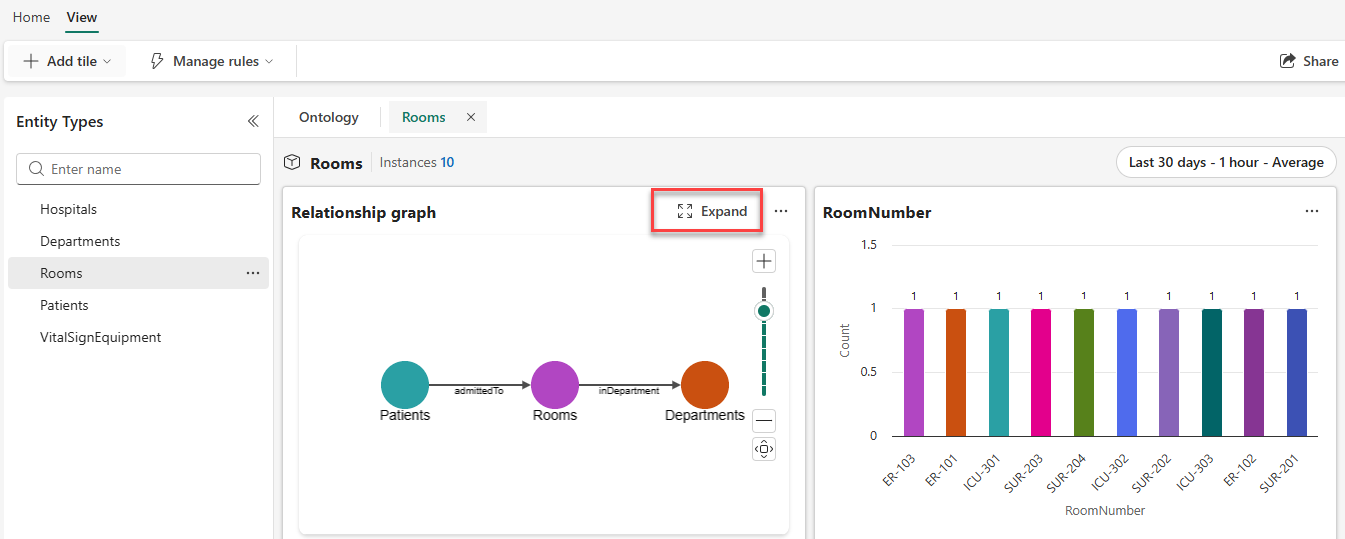
The full graph view opens showing the entity type schema: Patients connected to Rooms via admittedTo, and Rooms connected to Departments via inDepartment. This is the structure of the ontology—no instance data has loaded yet.
Run the default query
To load actual instance data into the graph, select Run query from the ribbon. The default query retrieves the selected entity type and all entities one relationship hop away.
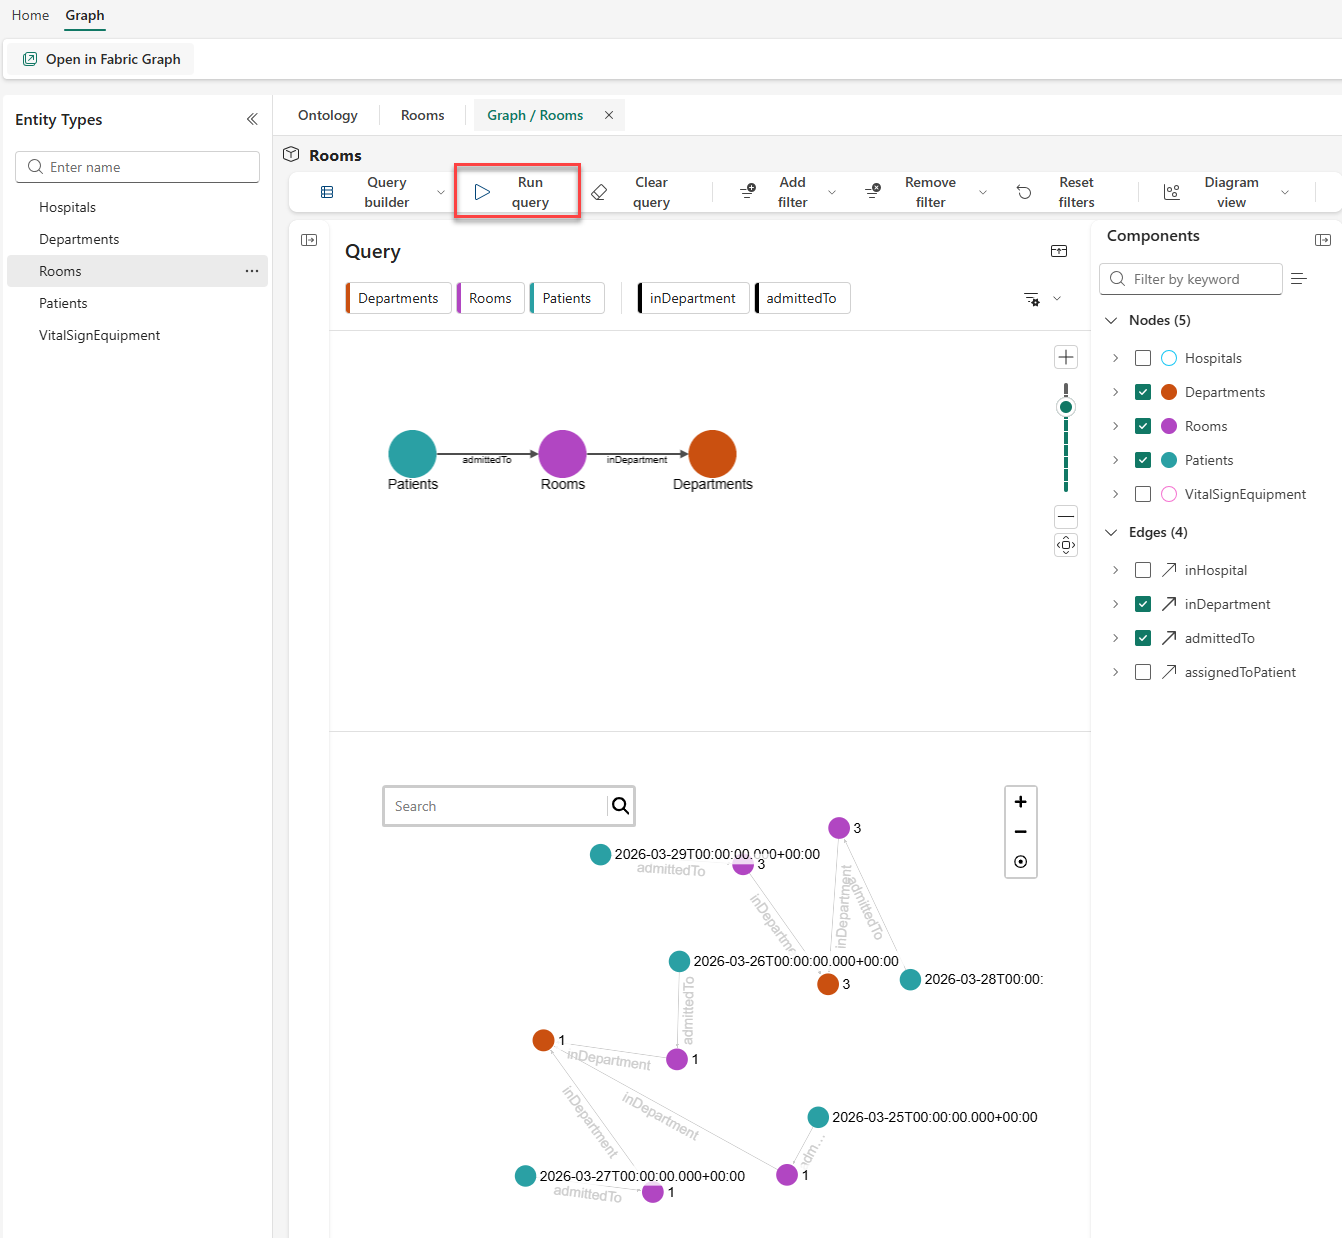
After the query runs, the lower panel populates with real instance nodes: individual room records (purple), the patients admitted to those rooms (teal), and the departments those rooms belong to (orange). Each labeled arrow between them is a live edge—an actual connection from the data, not a constructed join.
Select nodes to view details
The graph is interactive. Select any node to view its property values. Selecting a room node surfaces its RoomNumber, DepartmentId, and RoomType. Selecting a department node shows the department's name and ID. Selecting a patient node shows admission details.
This lets you explore both the data and the relationships at a glance—following connections the same way a clinical operations manager would think about them: which rooms are in the Intensive Care Unit, and which patients are in those rooms.
Navigate connected data
The graph opened from the Rooms entity type shows Rooms at the center, with Patients and Departments one hop away. The Lamna Healthcare ontology extends further: Patients connect to VitalSignEquipment via the assignedToPatient relationship. Following the full path from Department → Room → Patient → VitalSignEquipment answers "Which monitors are active for patients in the ICU?"—by following named edges, not writing joins.
In the next unit, you use the Query builder to add filters and control which entity types and relationship types appear, so you can target specific questions directly.