Filter and explore with the Query builder
In the previous unit, you expanded the relationship graph and ran a query to see entity instances and their connections. The Query builder gives you controls to go further—filtering results by property values, focusing the graph on specific entity types, and switching between views to explore the data in different ways.
Understand cross-source querying
The Lamna Healthcare ontology binds Hospital, Department, Room, Patient, and VitalSignEquipment data from both a lakehouse and an eventhouse. When a query includes both Patient and VitalSignEquipment instances, the ontology translates that into separate queries against each source and connects the results through the assignedToPatient relationship binding. The graph returns a unified view without requiring any JOIN statements or knowledge of the underlying table structure.
Use the Query builder controls
In the full graph view, the Query builder ribbon provides the controls for building and running queries. The Components pane on the right controls which entity types and relationship types are visible in the graph.
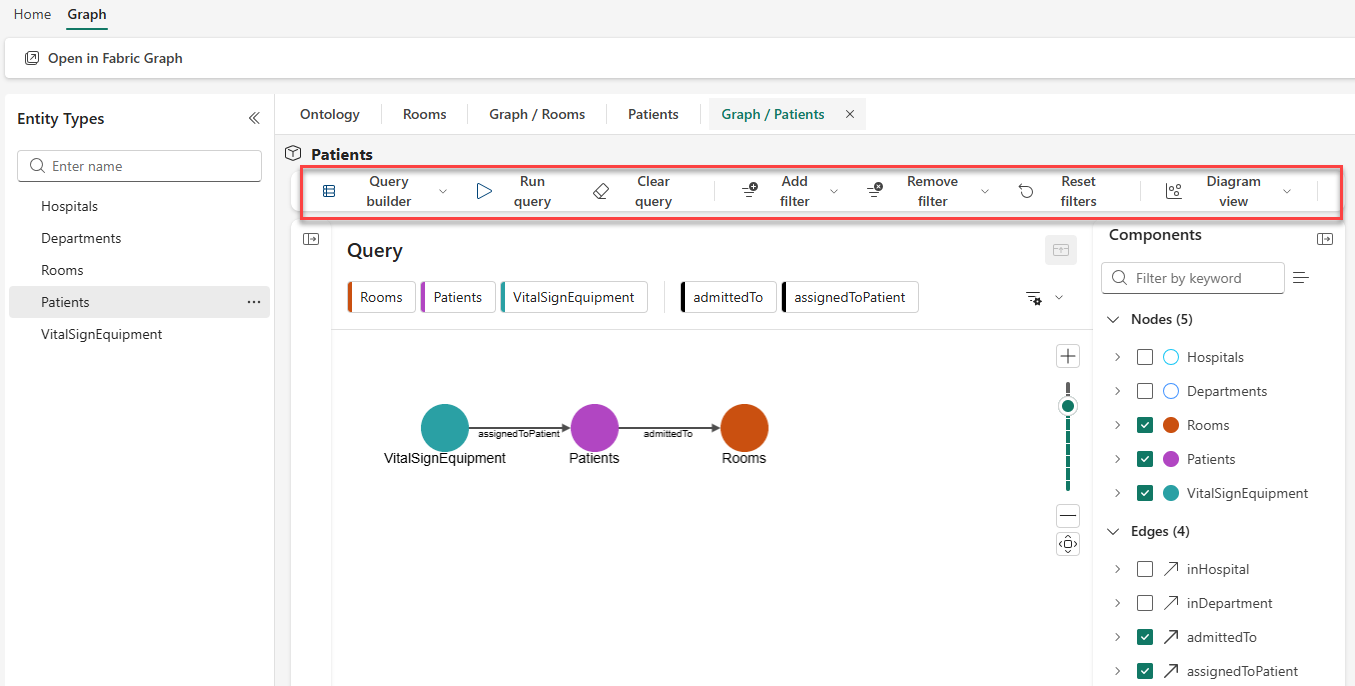
The key controls are:
- Run query — Execute the current query and load instance data into the graph.
- Add filter — Narrow results by property value on a specific entity type.
- Remove filter — Remove a specific active filter without clearing everything else.
- Reset filters — Clear all active filters at once.
- Diagram view — Switch between Diagram, Card, and Table views for query results.
Control components
The Components pane lists every entity type and relationship type as checkboxes. Checking or unchecking an entry controls whether it appears as a node or edge in the graph and results.
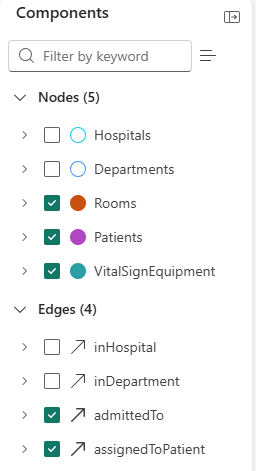
In this example, Hospitals and Departments are unchecked — the query focuses on Rooms, Patients, and VitalSignEquipment and the edges connecting them. Unchecking entity types that aren't relevant to the question keeps the results graph readable. To answer "Which vital sign monitors are assigned to patients in Critical Care rooms?", only three node types and two edge types are needed: Rooms, Patients, VitalSignEquipment, admittedTo, and assignedToPatient.
Add filters
Select Add filter to narrow results based on a property value. In the filter dialog, select the entity type, the property, and the value to match.
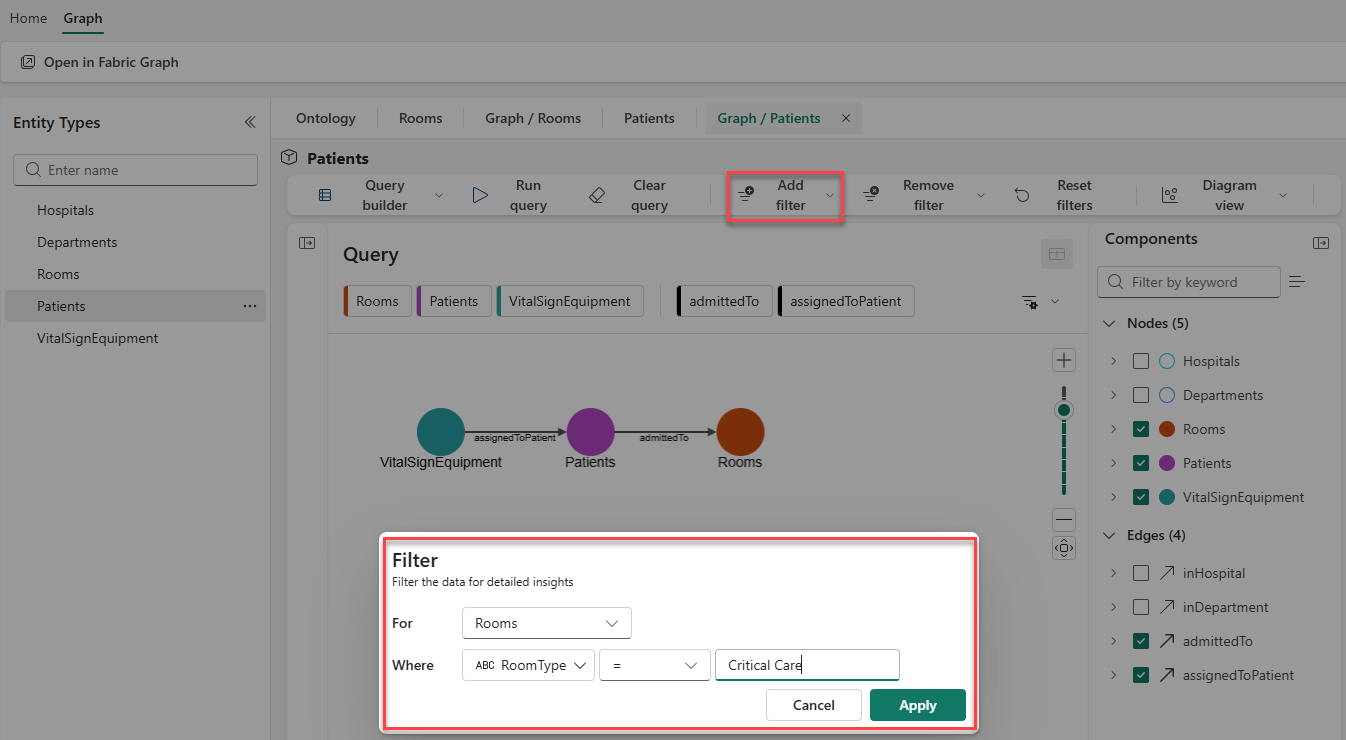
This filter limits results to rooms where RoomType = Critical Care. After selecting Apply and running the query, only Critical Care rooms appear as nodes — along with the patients admitted to those rooms and the equipment assigned to those patients, based on the active components.
Multiple filters can be active at the same time. Each filter narrows results further — all conditions must be satisfied simultaneously. Use Remove filter to remove one condition, or Reset filters to start over.
View results
After running the query, results appear in the panel below the graph. Use the Diagram view dropdown to switch between three views.
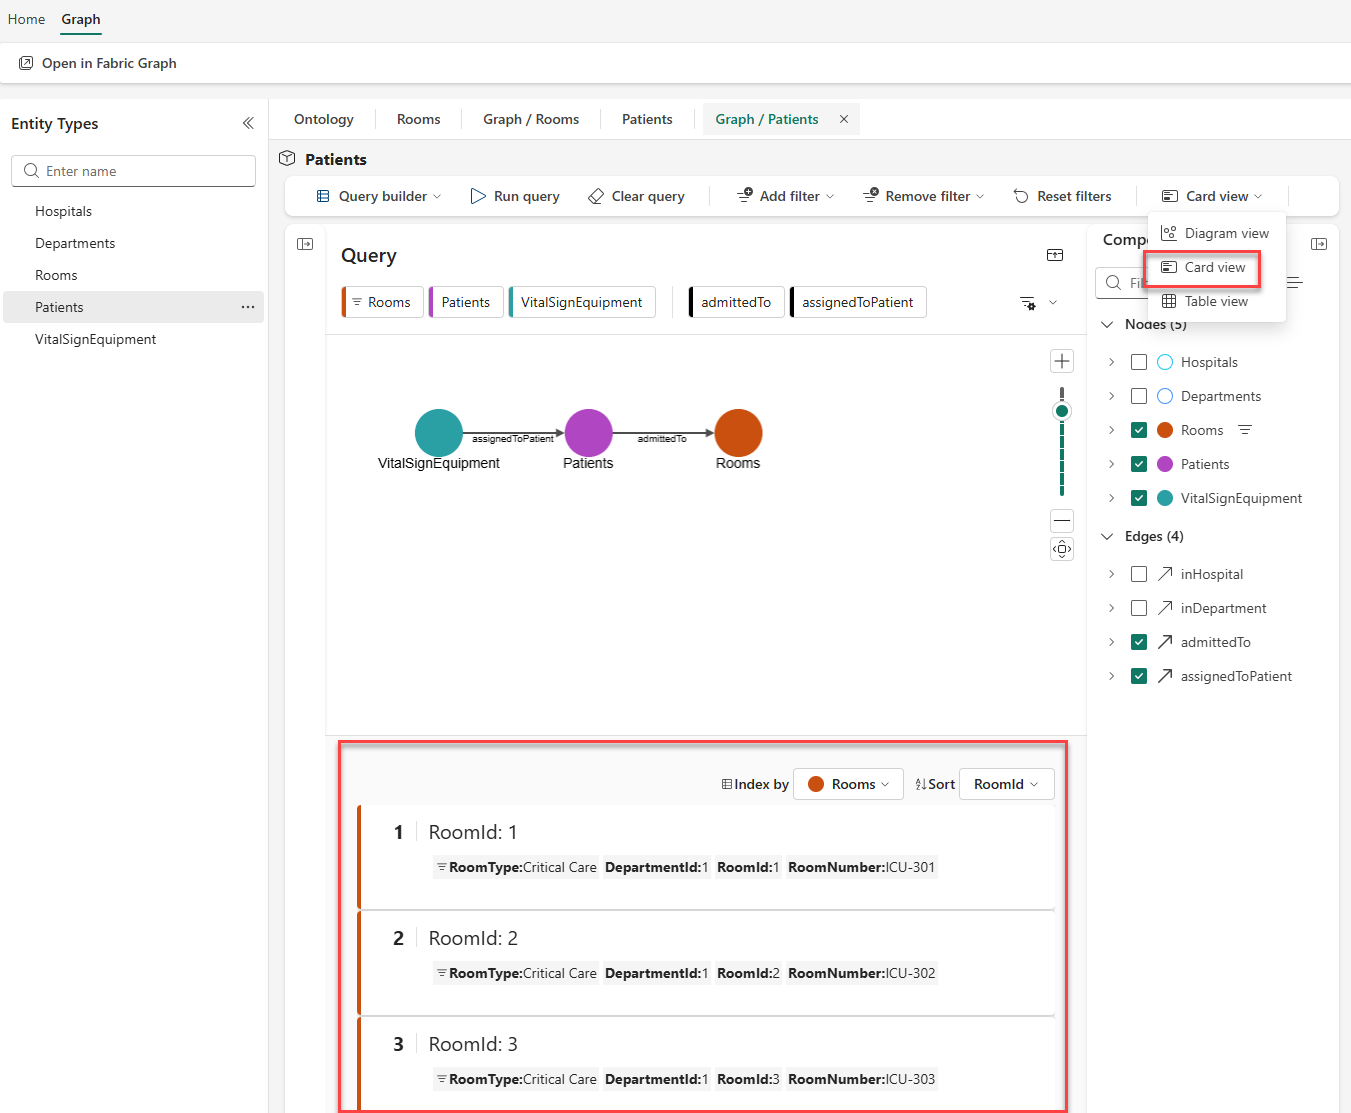
Diagram view shows the graph structure with nodes and edges. Select any node to inspect its property values.
Card view displays each instance as a card with property values listed inline — useful for scanning specific attributes like RoomNumber or RoomType across multiple results.
Table view shows results in rows and columns — one row per instance, one column per property — useful for comparing values across many results.