How do I navigate the Team Summary Dashboard?
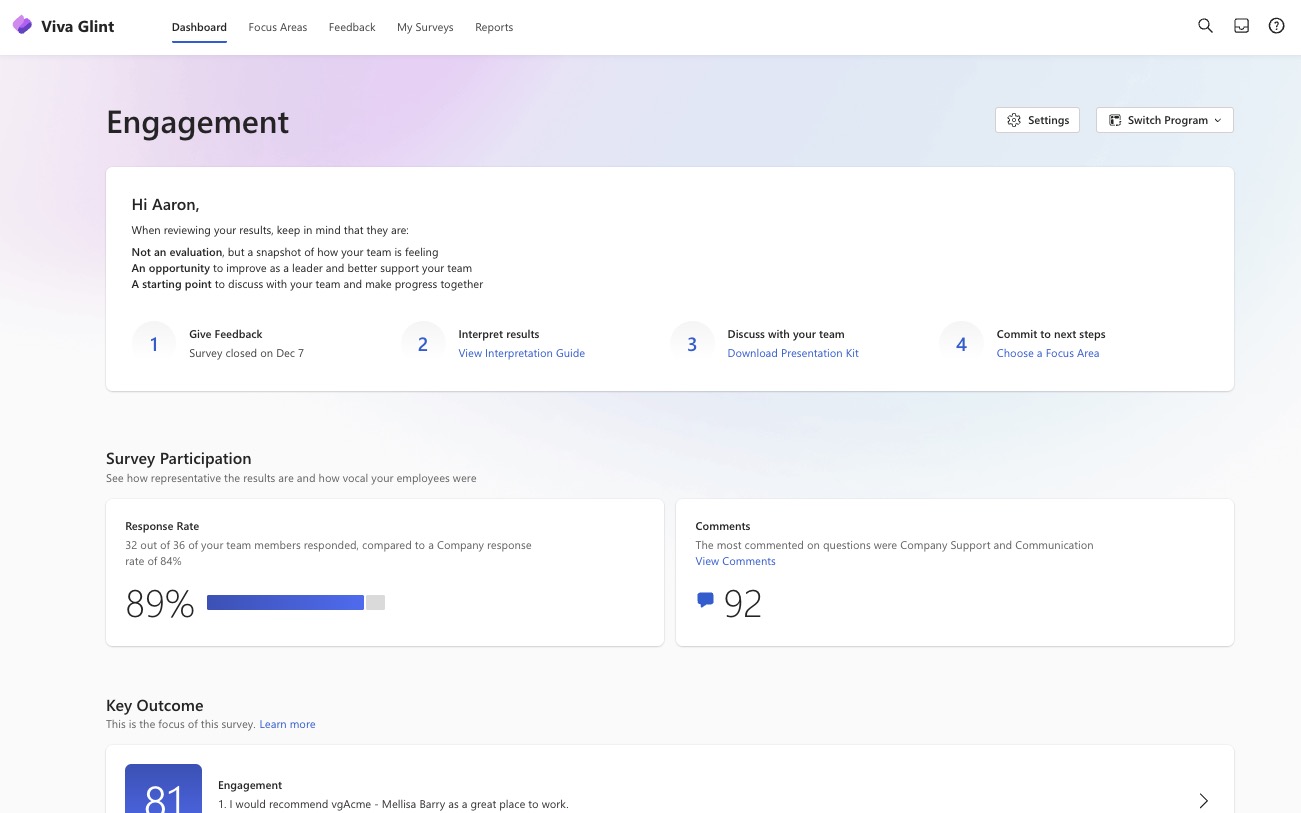
Set as the default dashboard experience, the Team Summary is an enhanced results report designed specifically with managers in mind. It captures employee feedback in a simple format that helps managers clearly understand their team’s unique opportunities and what straightforward and attainable actions can be taken to reach their goals.
Manager Concierge
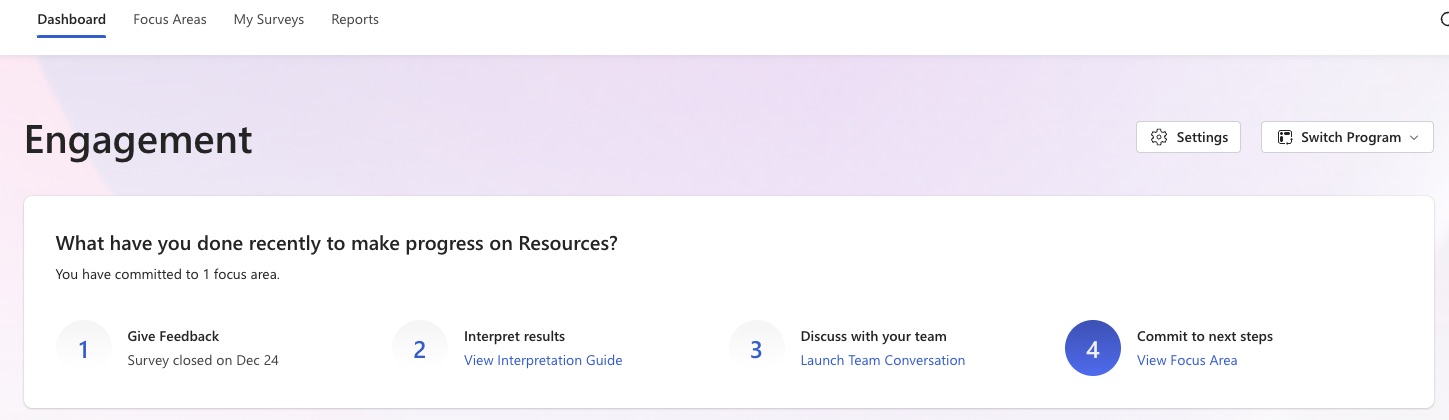
If enabled, Manager Concierge is the first section of the Team Summary dashboard. Manager Concierge is a four-step guidance and timeline feature which assists managers to understand survey results, share them with their teams, and take ongoing action. The steps auto-update and provide prescribed links as managers progress through each step.
Survey Participation
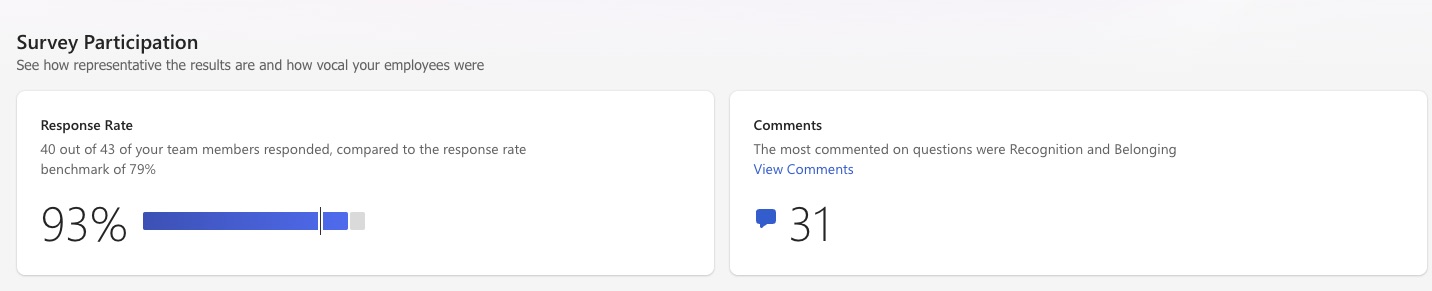
The Survey Participation section shows the response rate (percentage of employees who completed the survey), as well as the number of comments submitted by on returned surveys.
Celebrating Success
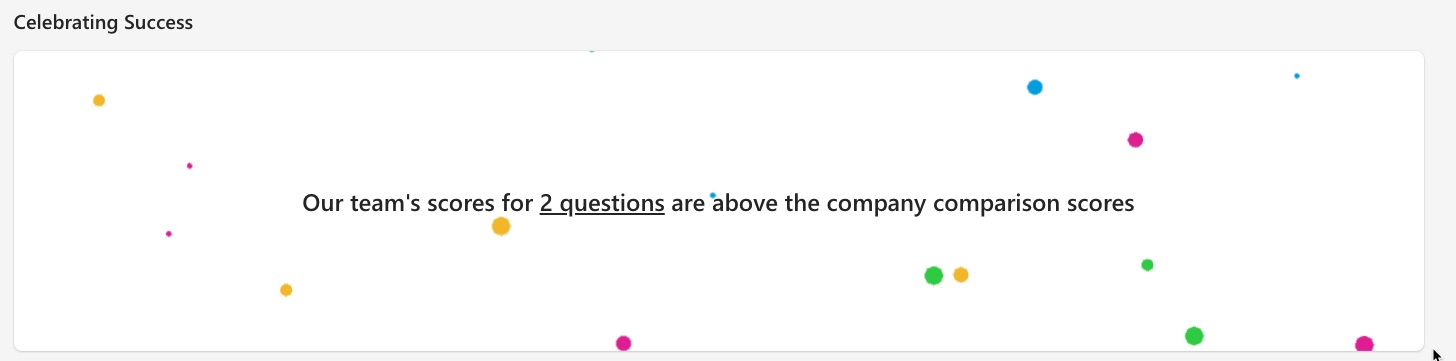
The Celebrating Success section allows managers to take a moment to acknowledge and discuss the positive team results that have occurred. These celebrations can highlight meaningful differences from past survey scores or comparisons if this is not the first survey of its kind.
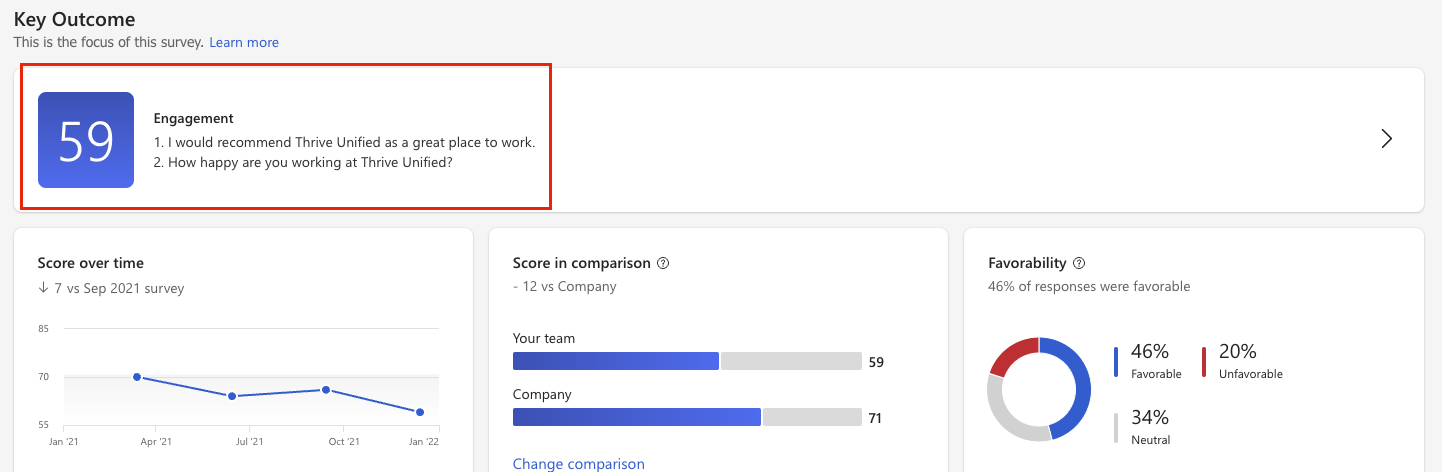
Key Outcome
The Key Outcome section contains the metrics for the core driver (your intended result) of the survey. A Key Outcome is the main driver being measured, the ultimate reason for the survey. For an Engagement survey, the Key Outcome is typically comprised of the average of a team’s responses to the following two (2) questions:
- “I would recommend (Company Name) as a great place to work”
- “How happy are you working at <Company Name>.”
The overall engagement score for your team or group displays in the large blue box.
Note
While surveys are generally based on a five-point scale, the scores within the VIva Glint platform are converted to a 100-point scale, with zero as the lowest percentage and 100 as the highest percentage.
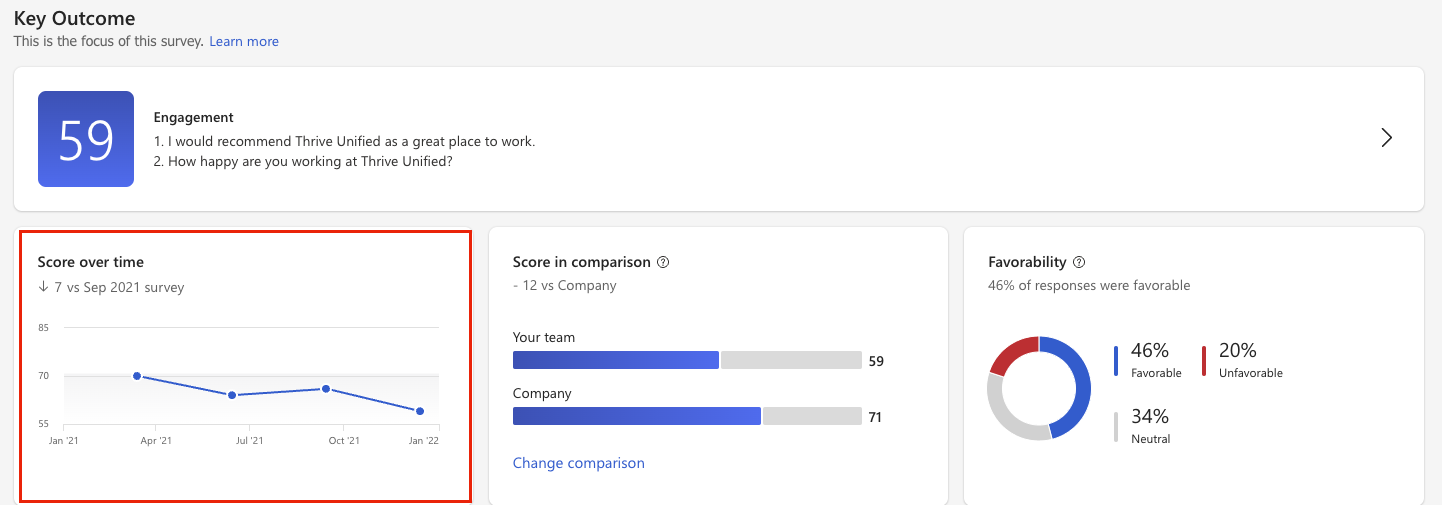
Beneath the Key Outcome, the Score over time section is a historical trending chart which displays the engagement score for the current survey compared to previous survey cycles.
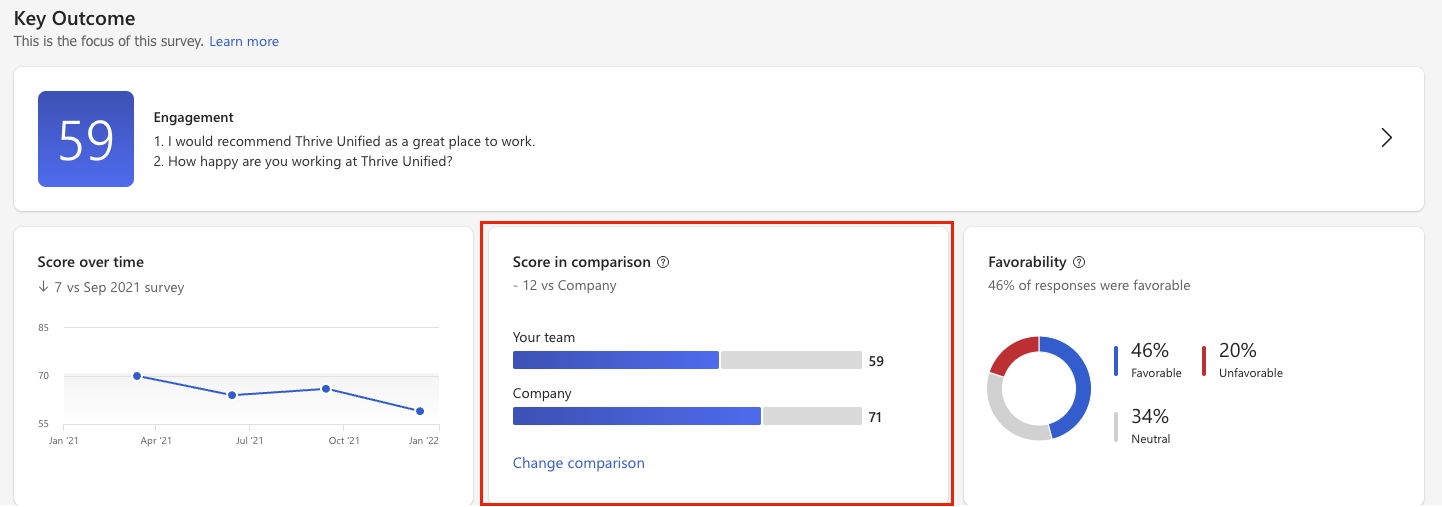
The Score in comparison area is a representation of the team’s engagement score versus the default comparison. The default comparison is chosen during initial Glint setup. This will often be a comparison between the team’s score and the overall company score. The comparison can be changed within a report by selecting Settings, in the top right corner.
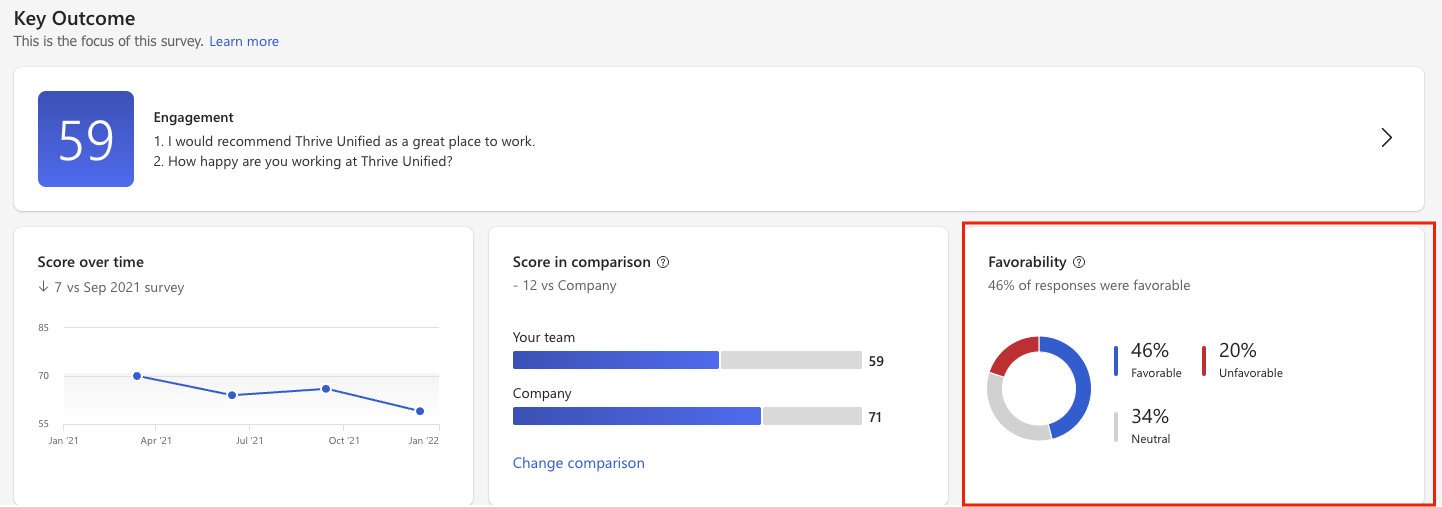
Favorability displays the distribution of positive (4 or 5), neutral (3), and negative (1 or 2) responses to engagement item(s). Select the question mark to learn more about how favorability is calculated.
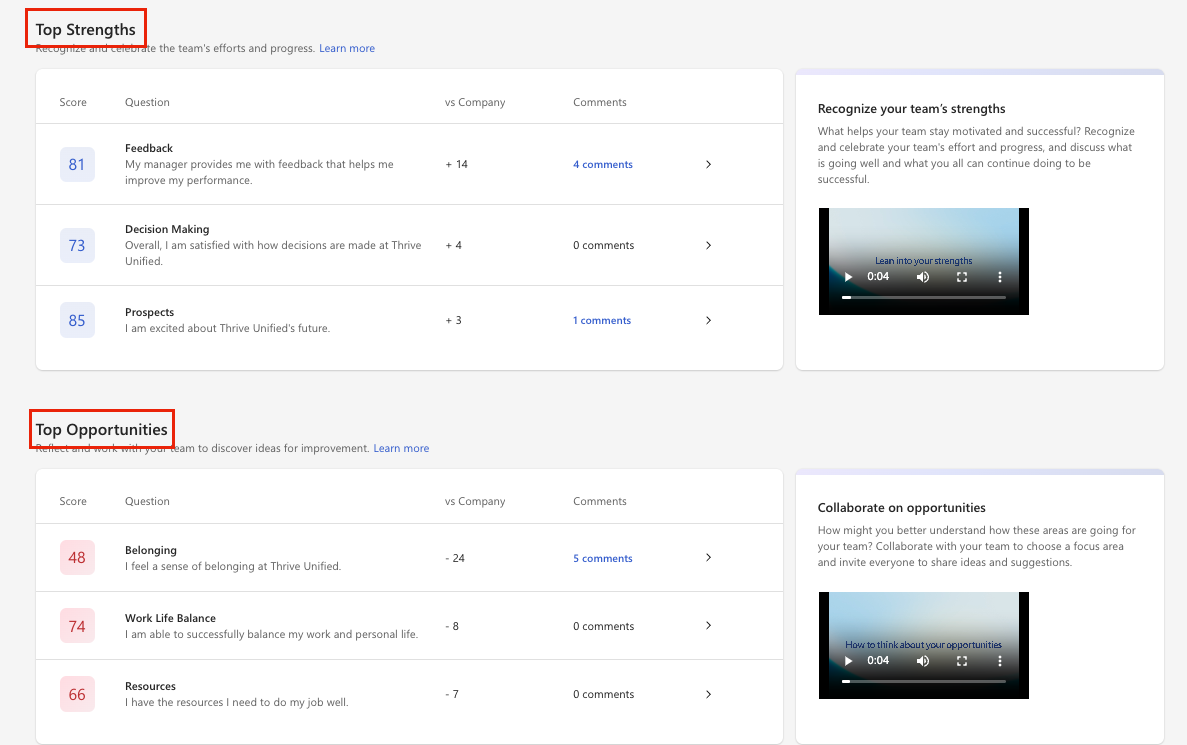
Top Strengths and Top Opportunities
The Strengths and Opportunities section displays your team’s top three strengths and opportunities based on a comparison to benchmark or company average and to the impact on engagement.
- Strengths are areas that typically score above the comparison and show higher levels of impact.
- Opportunities are areas that typically fall below the comparison score and also have high levels of impact.
You can filter by drivers to learn more about your scores and then – along with your team - choose that driver as a Focus Area for the team to work on.
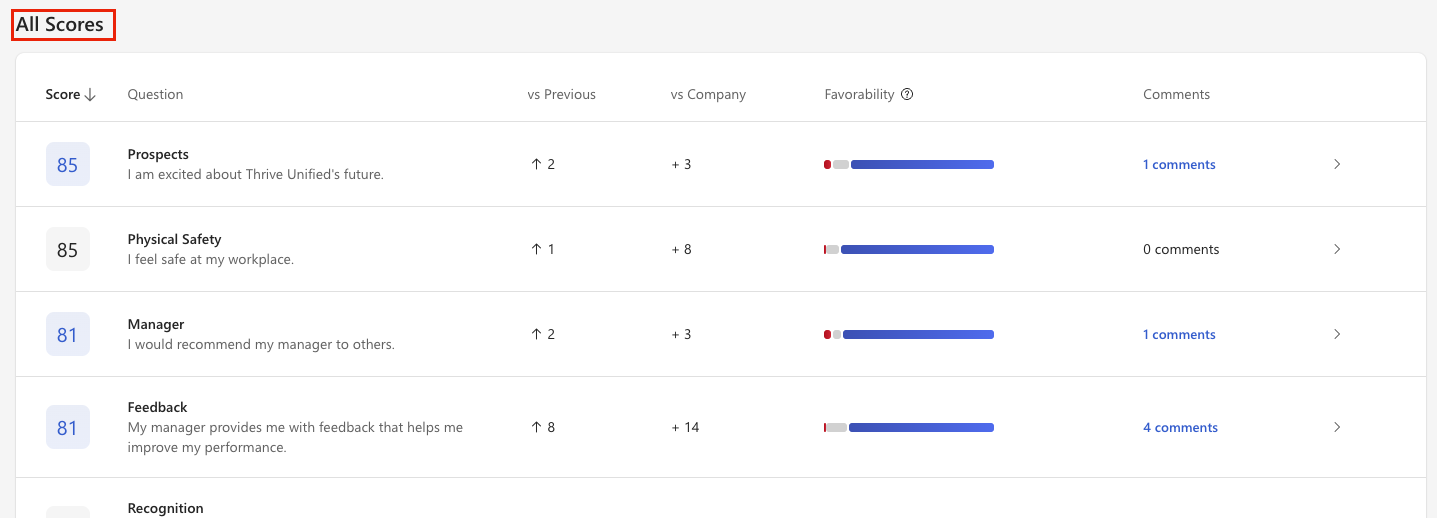
All Scores
The All Scores section presents the average score for each question. Selecting a column header allows you to sort the display order for each column. For example, you can sort by ascending order in the vs. Previous column to view the scores against what they were last survey cycle. <br The coloring of each score is relative to whether it is in the top 50% versus the chosen comparison:
- Blue: Top 50%
- Red: Bottom 50%
- Gray: Excluded from scoring because there is no benchmark comparison or they are low to medium impact drivers.
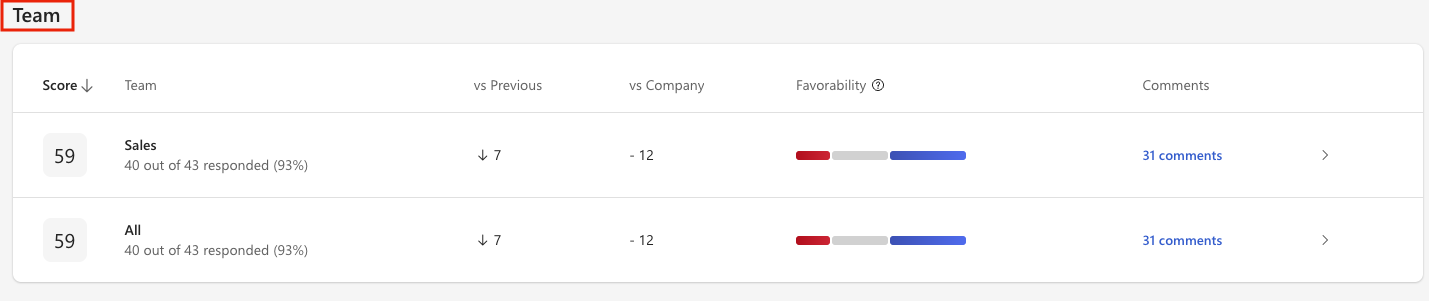
Team
Engagement scores are also presented by hierarchy levels that have been provided in your Employee Attribute File. You may see hierarchies such as teams, manager, and location.
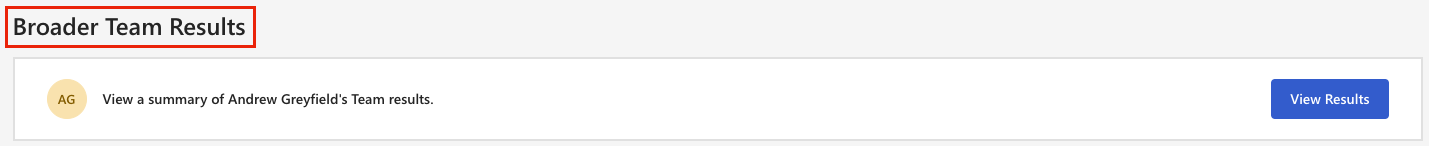
Broader Team Insights
If enabled, Broader Team Insights (BTI) are useful in these scenarios:
- Accessing a high-level report of your direct team leader’s results
- Small team managers who don’t have access to their own team’s results
BTI provides visibility into a manager's broader team’s opportunity areas, access to dashboard action-taking capabilities and conversation starters, and ownership and accountability for your team’s engagement scores. Select View Results to see the
Check out our Team Summary dashboard in Viva Glint page for additional detail on this dashboard experience.