How do I navigate the Driver Impact Report?
The Driver Impact report shows you the impact of each of your survey drivers on your overall team’s engagement, so you know where to focus to improve or maintain survey results. The Driver Impact report also shows you the amount the score falls above or below the selected comparison.
Before navigating the report, it is important to understand the term “driver.” Viva Glint carefully selects drivers based on current research of factors that affect engagement - for their breadth and relevance in the modern workplace. Most rating scale items from your survey are drivers.
A driver's impact is often described as its correlation with engagement. Not all drivers have the same impact on engagement. There can be a large difference in how important a specific driver is to your team compared to how the rest of the company responds to that driver. For example, the engineering team’s engagement level may be highly impacted by a lack of career growth opportunities. However, the finance team may have worked many hours this quarter and as a result, work life balance impacts them the most.
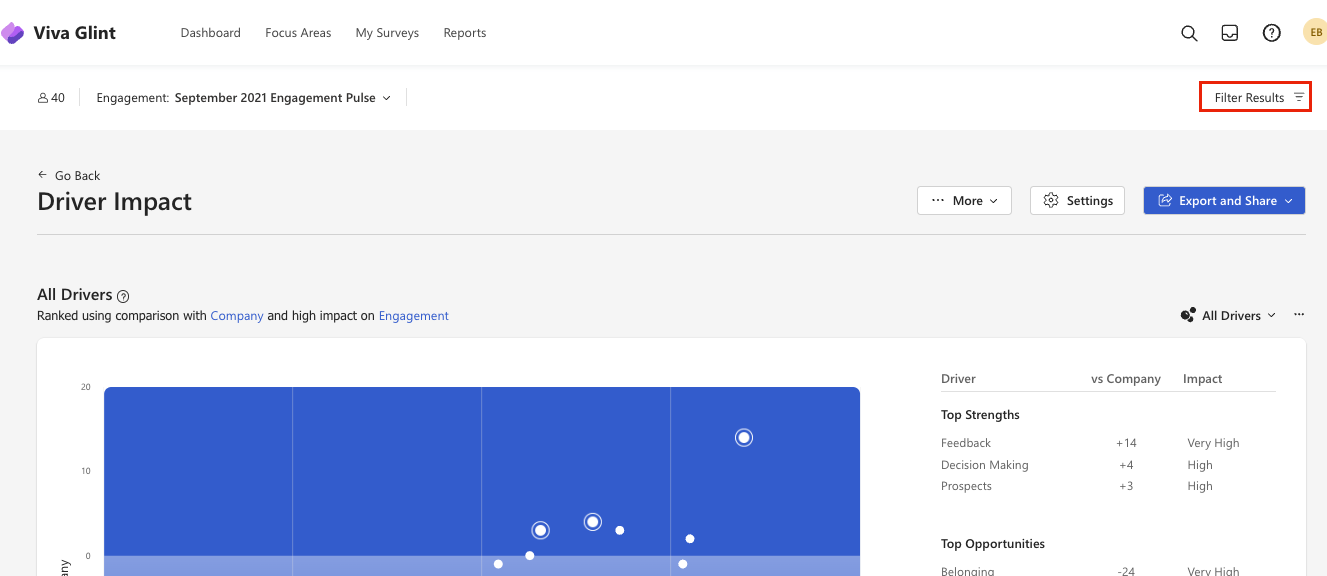
Driver Impact Graph View
The Driver Impact report graph plots each Driver's Impact on the x-axis and the selected comparison on the y-axis. The comparison can be Average Question, the Company Average, or My Teams. By clicking the Settings button, you can change the comparison view to view the Driver Impact report using a different comparator.
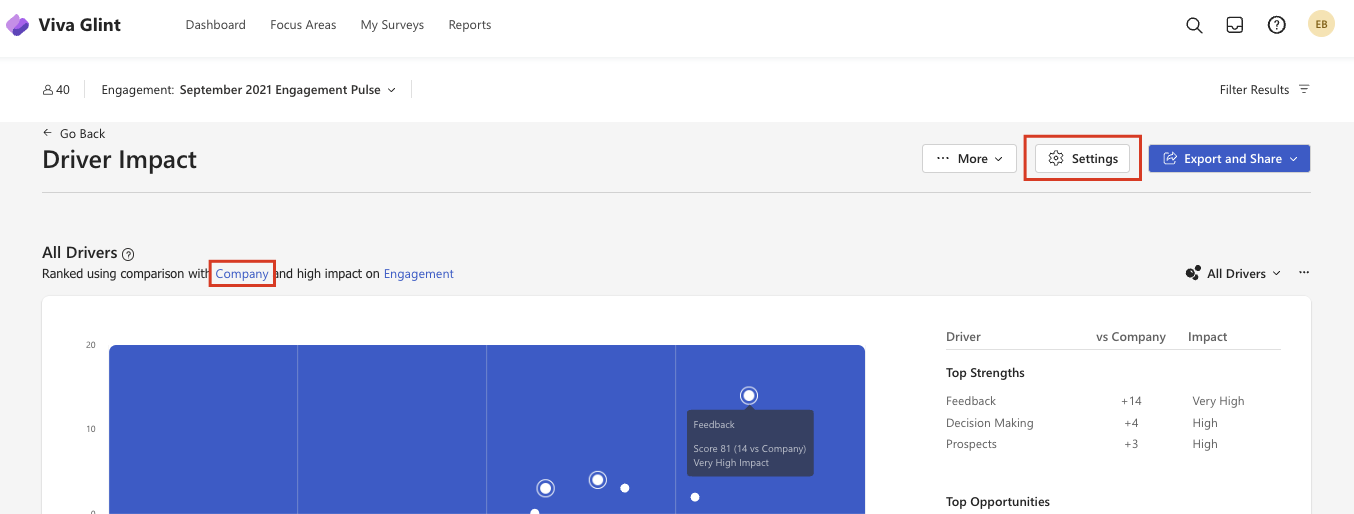
By looking at data points, you can understand which drivers are relative opportunities and which are relative strengths. Relative strengths are drivers that score relatively higher against the comparison and have a high or very high impact on engagement. Relative opportunities are items that scored relatively low against the comparison and have a high or very high impact on engagement.
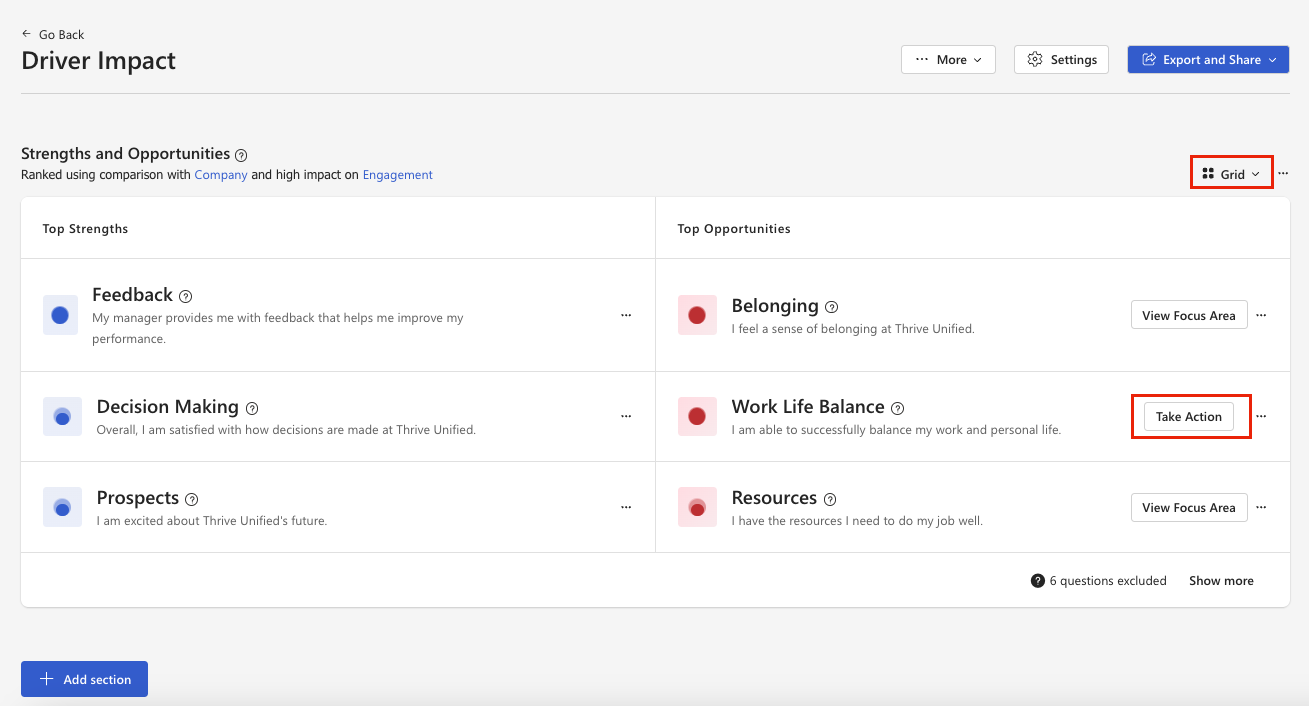
Driver Impact Grid View
The grid view displays the top three Strengths and Opportunities and prompts you to act on top opportunity areas. Strengths are areas that the team should celebrate; opportunities are areas the team should work on to improve overall engagement.
Customization and Filtering
The Driver Impact report allows you to customize the layout of the dashboard and to filter and refine results to look at specific populations within your team.
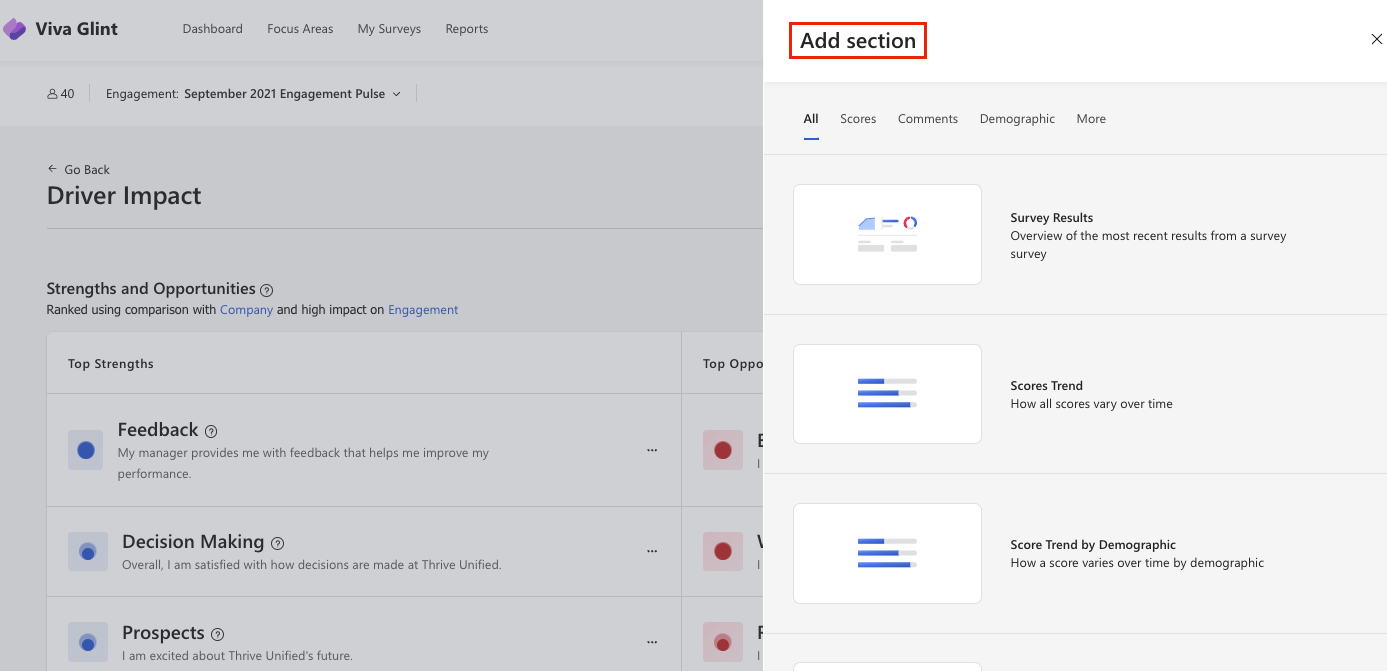
Selecting +Add section allows you to add a new section to the page. Within the sliding panel, you can choose any report section, like the Heat Map or Score Trend.
The Filter Results panel allows you to drill down to a specific population within your team using attributes, a specific survey item, or even a different survey.
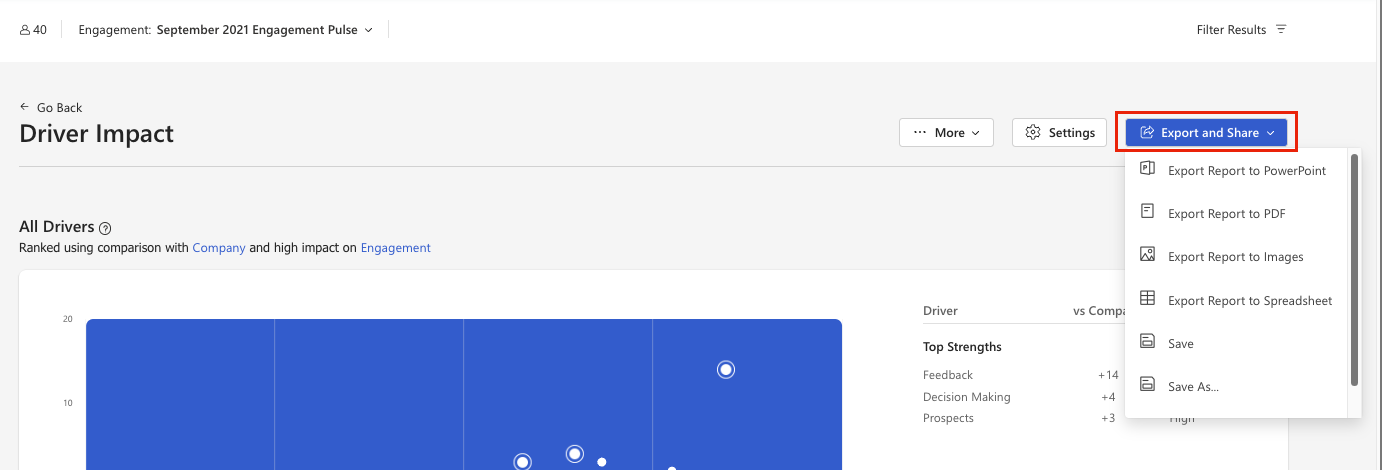
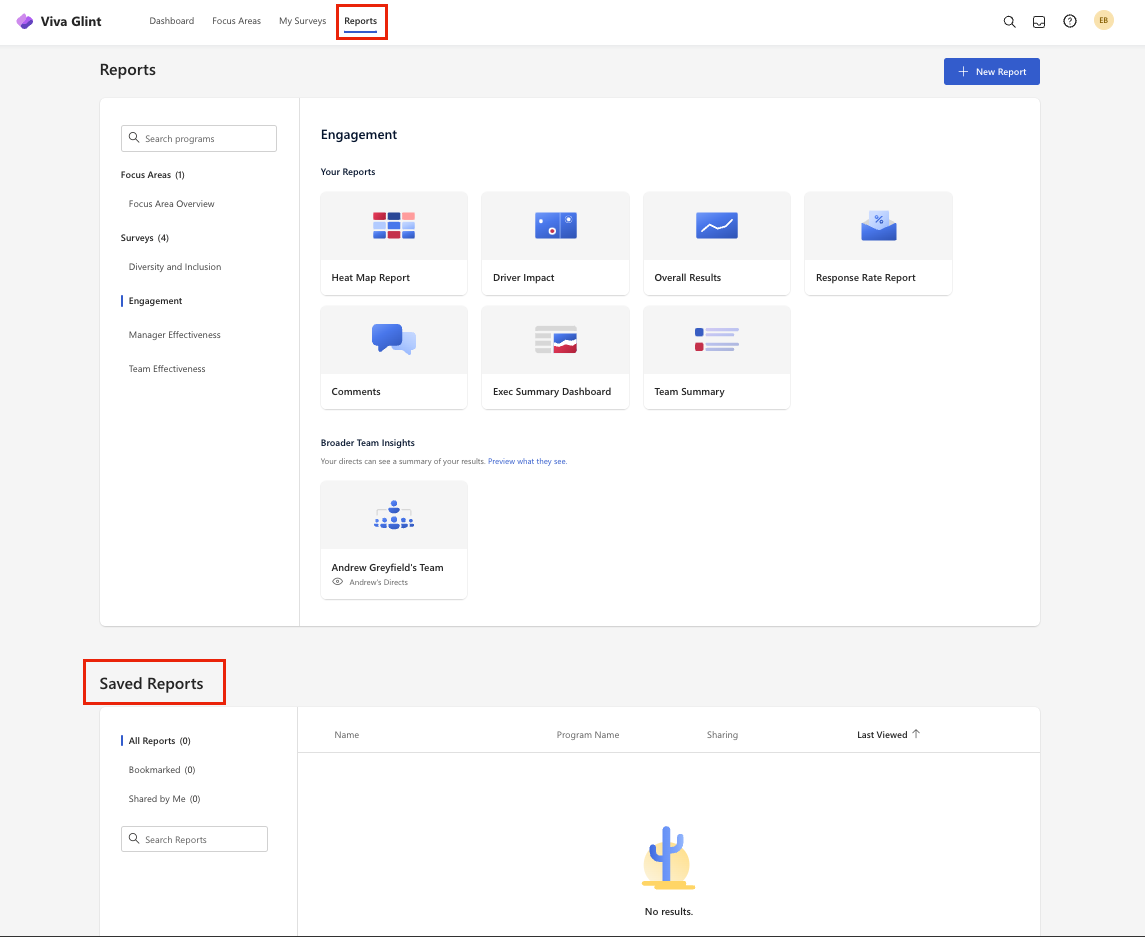
Use the Export and Share menu to export your customizations into different formats and to save your changes. Reports saved will be visible on the Reports tab in the Saved Reports section.
Check out our Use the Viva Glint Driver Impact report page for additional detail on Strengths and Opportunities as well as the other elements within the Driver Impact report.