Note
Access to this page requires authorization. You can try signing in or changing directories.
Access to this page requires authorization. You can try changing directories.
This article provides a cost analysis tutorial to investigate daily billing anomalies and identify the services that cause unexpected costs.
Identify the services that cause unexpected costs
Note
The prices that are shown in the following images are for example only. They do not reflect actual pricing.
Sign in to the Azure Preview portal.
Important
The Azure Preview portal may include preview, beta, or other pre-release features, services, software, or regions offered by Microsoft for optional evaluation ("Previews"). Previews are licensed to you as part of your agreement governing use of Azure, and subject to terms applicable to "Previews".
Certain named Previews are subject to additional terms set forth below, if any. These Previews are made available to you pursuant to these additional terms, which supplement your agreement governing use of Azure. Capitalized terms not defined herein shall have the meaning set forth in your agreement. If you do not agree to these terms, do not use the Azure Preview portal.
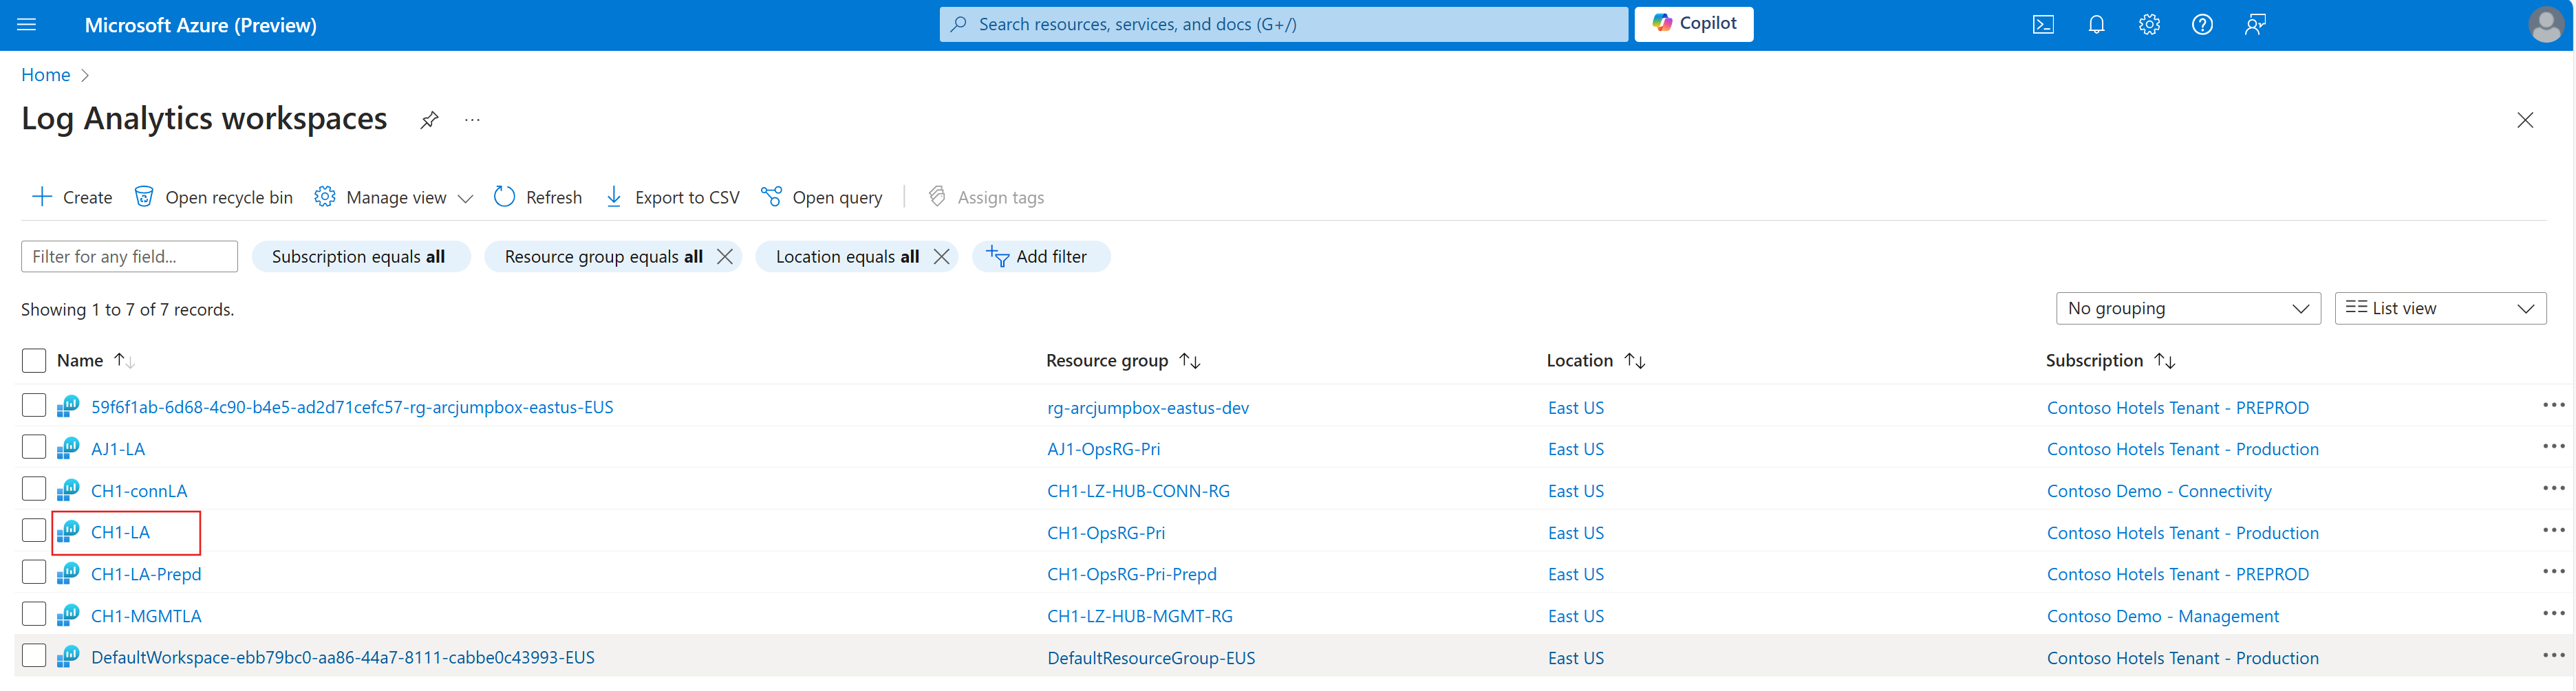
Enter Log Analytics in the search bar.
Under Services, select Log Analytics.
Select the Log Analytics workspace that you want to investigate.
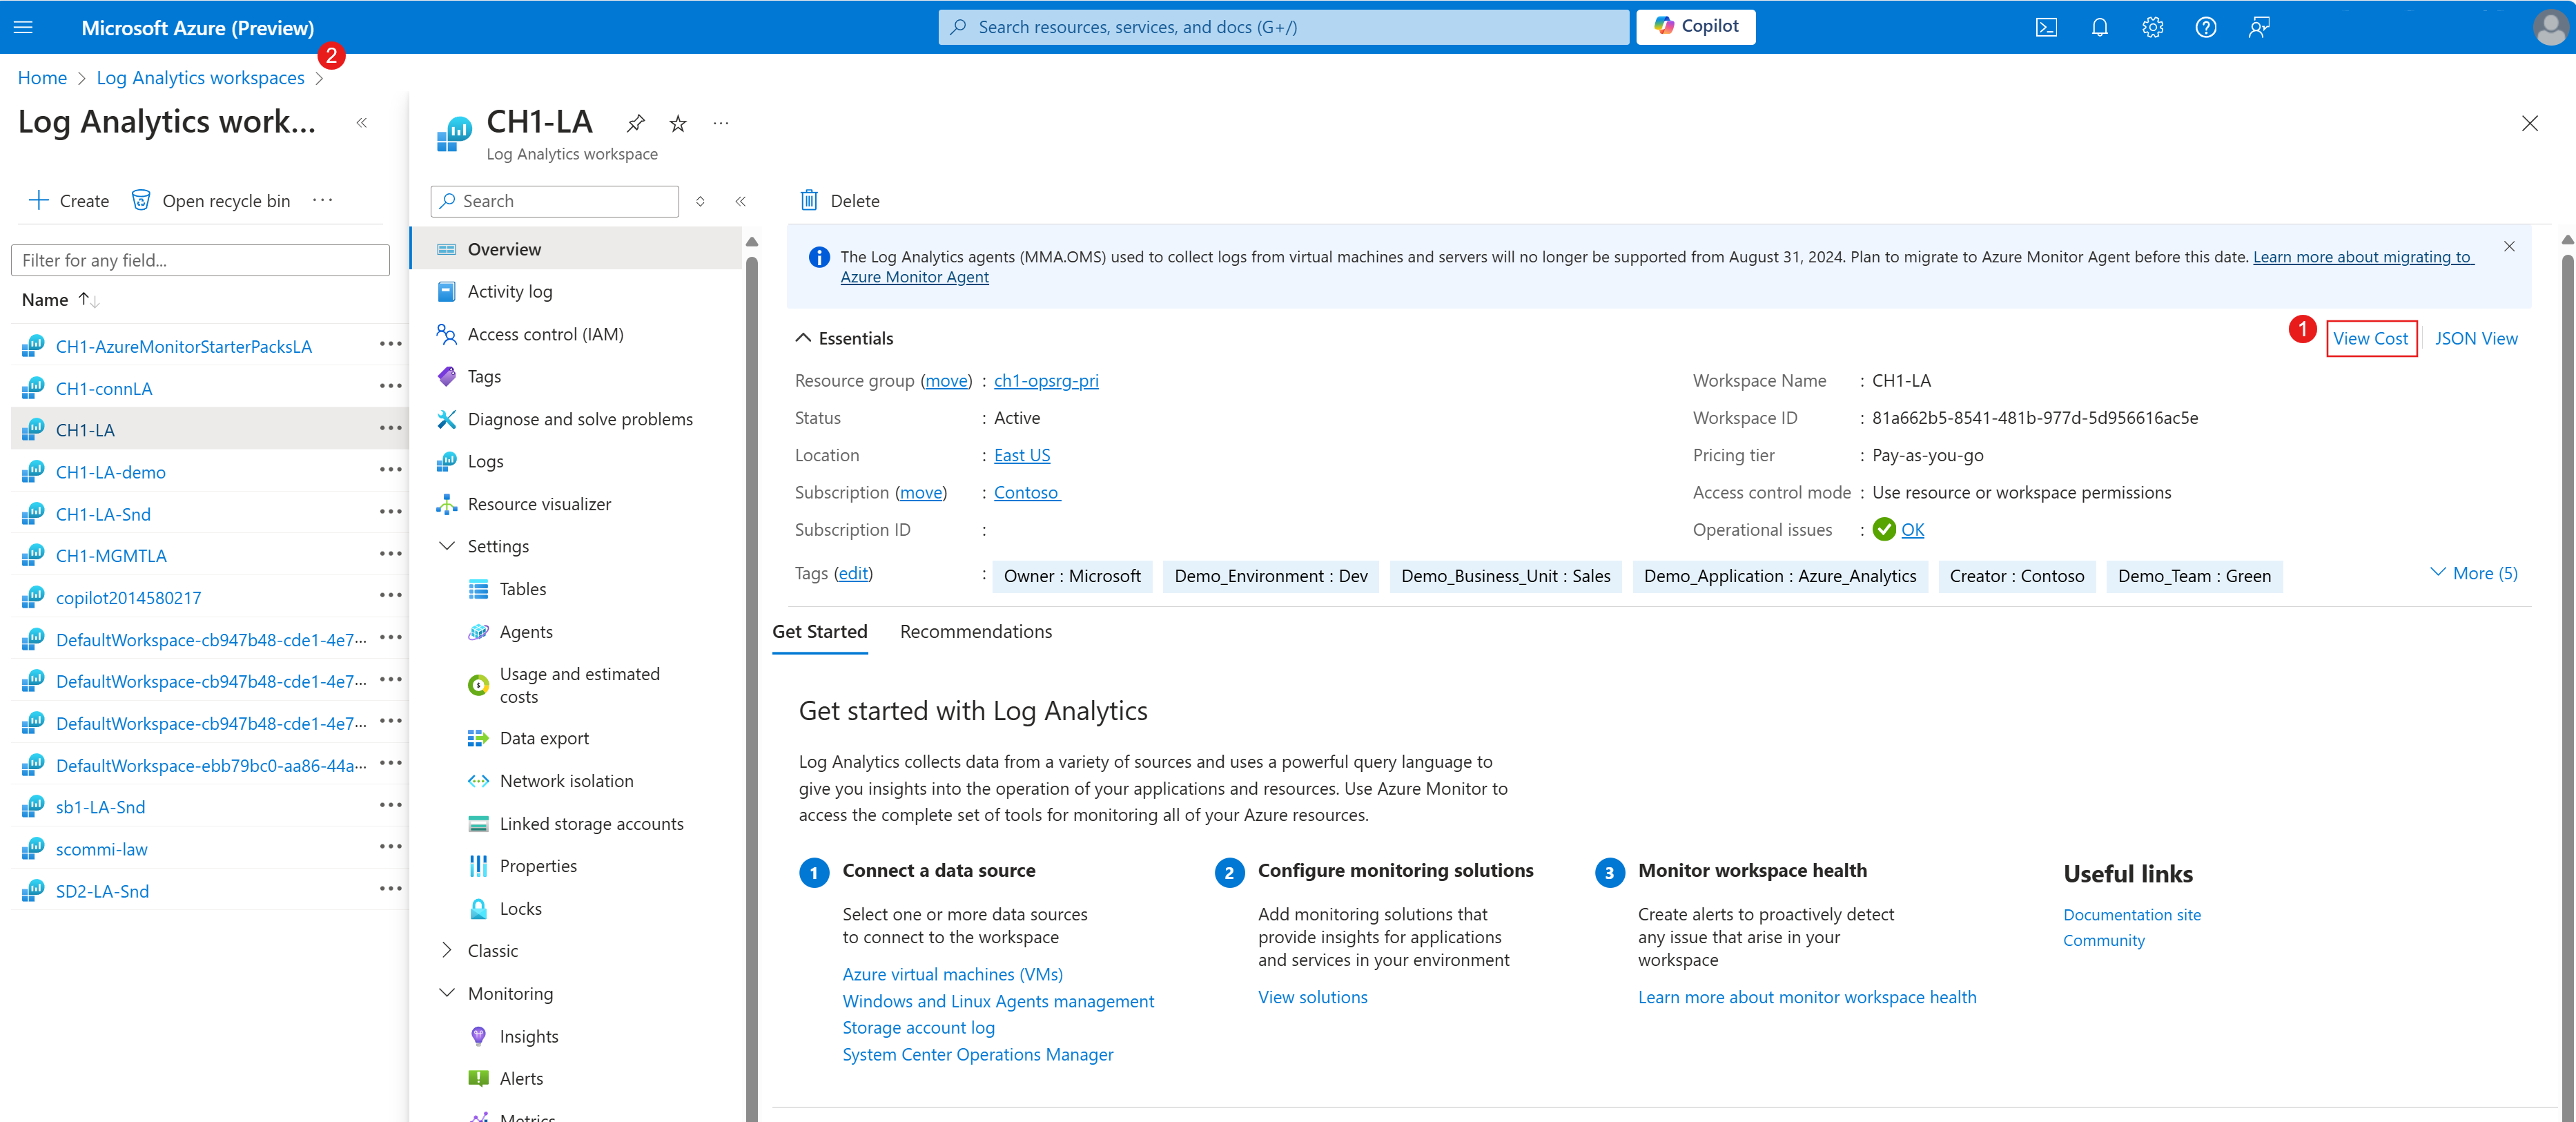
On the Overview page, select View Cost to open the Cost analysis page for the current Log Analytics service. If you don't see View Cost, ensure that you are using the Azure Preview portal(2).
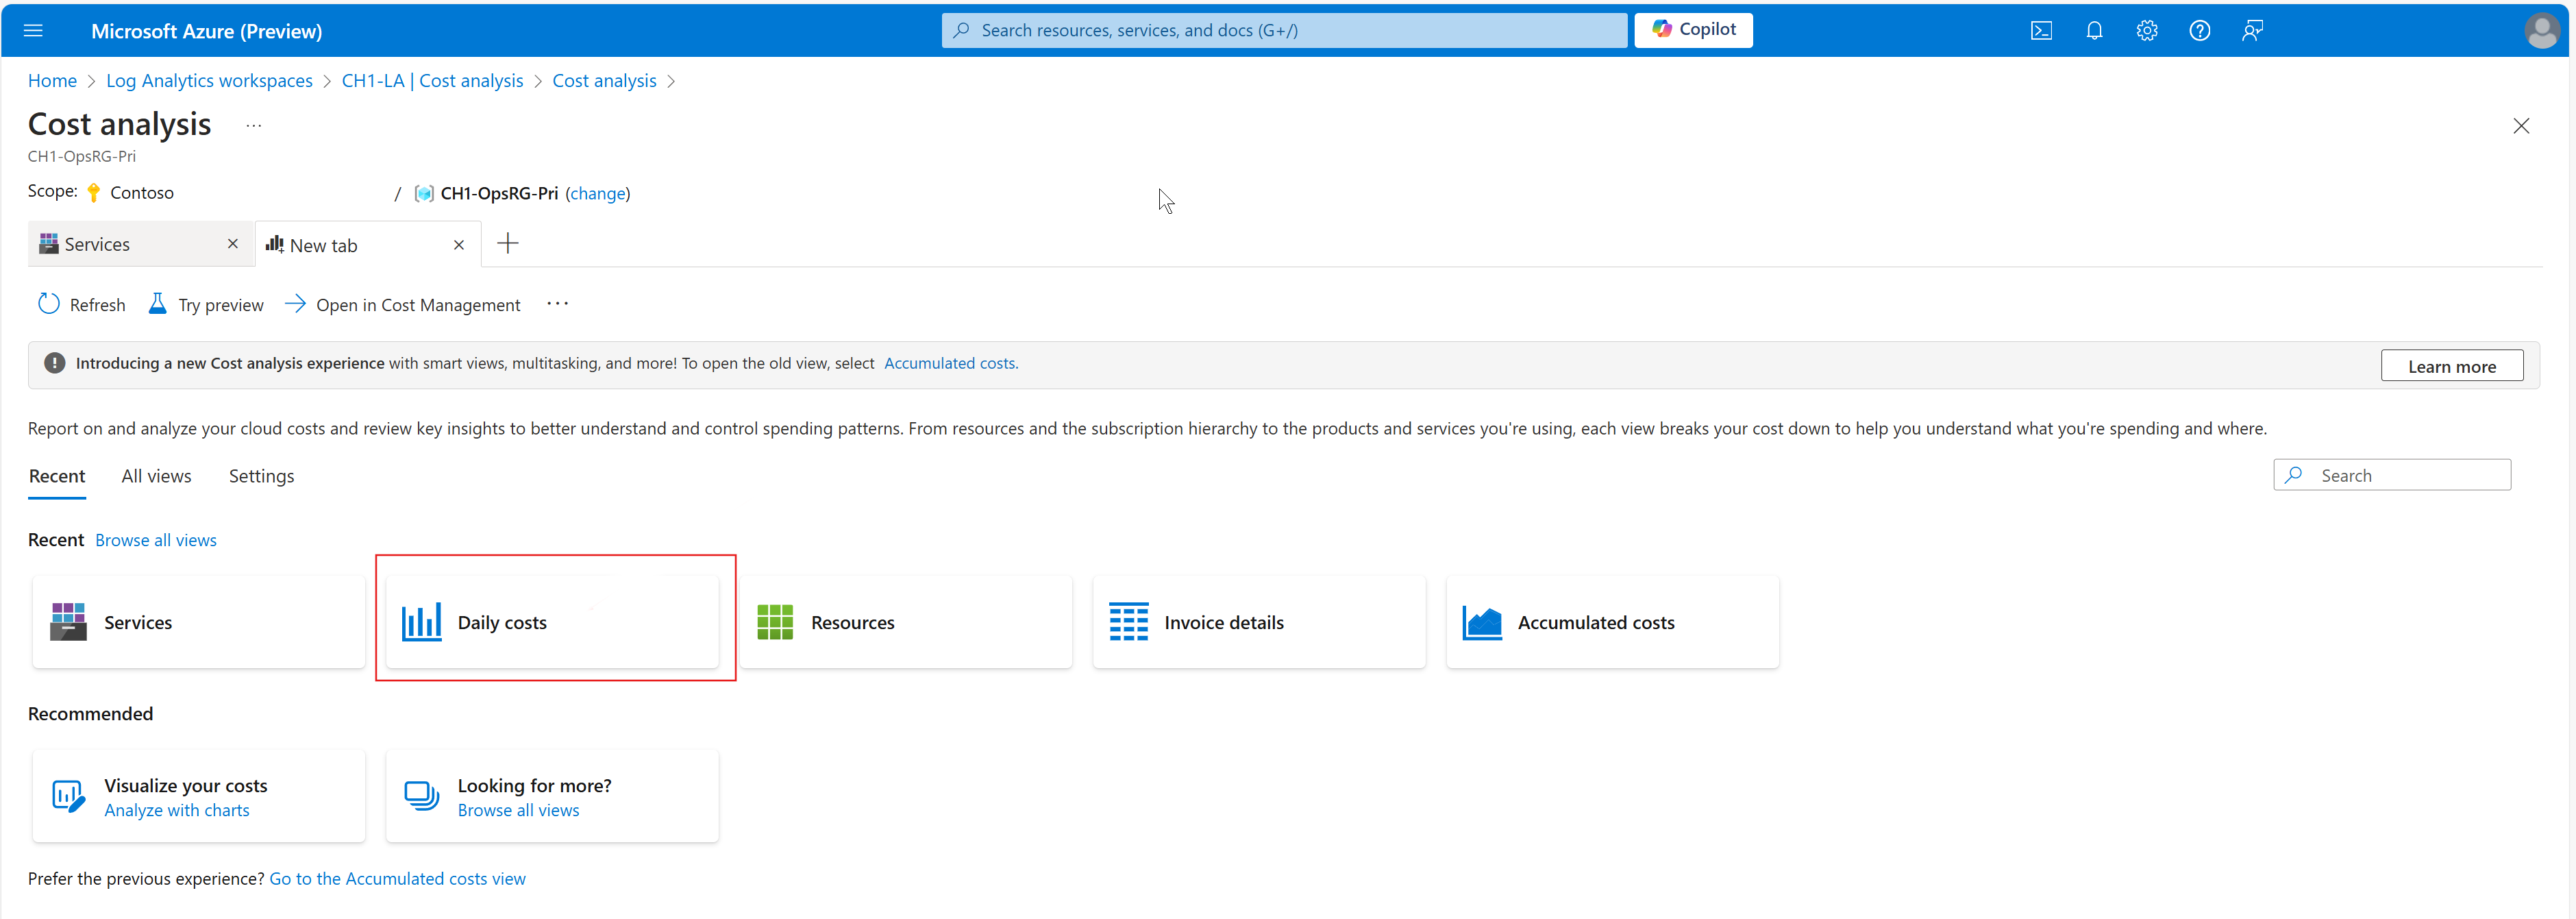
On the Cost analysis page, select View AccumulatedCosts, and then select Services.
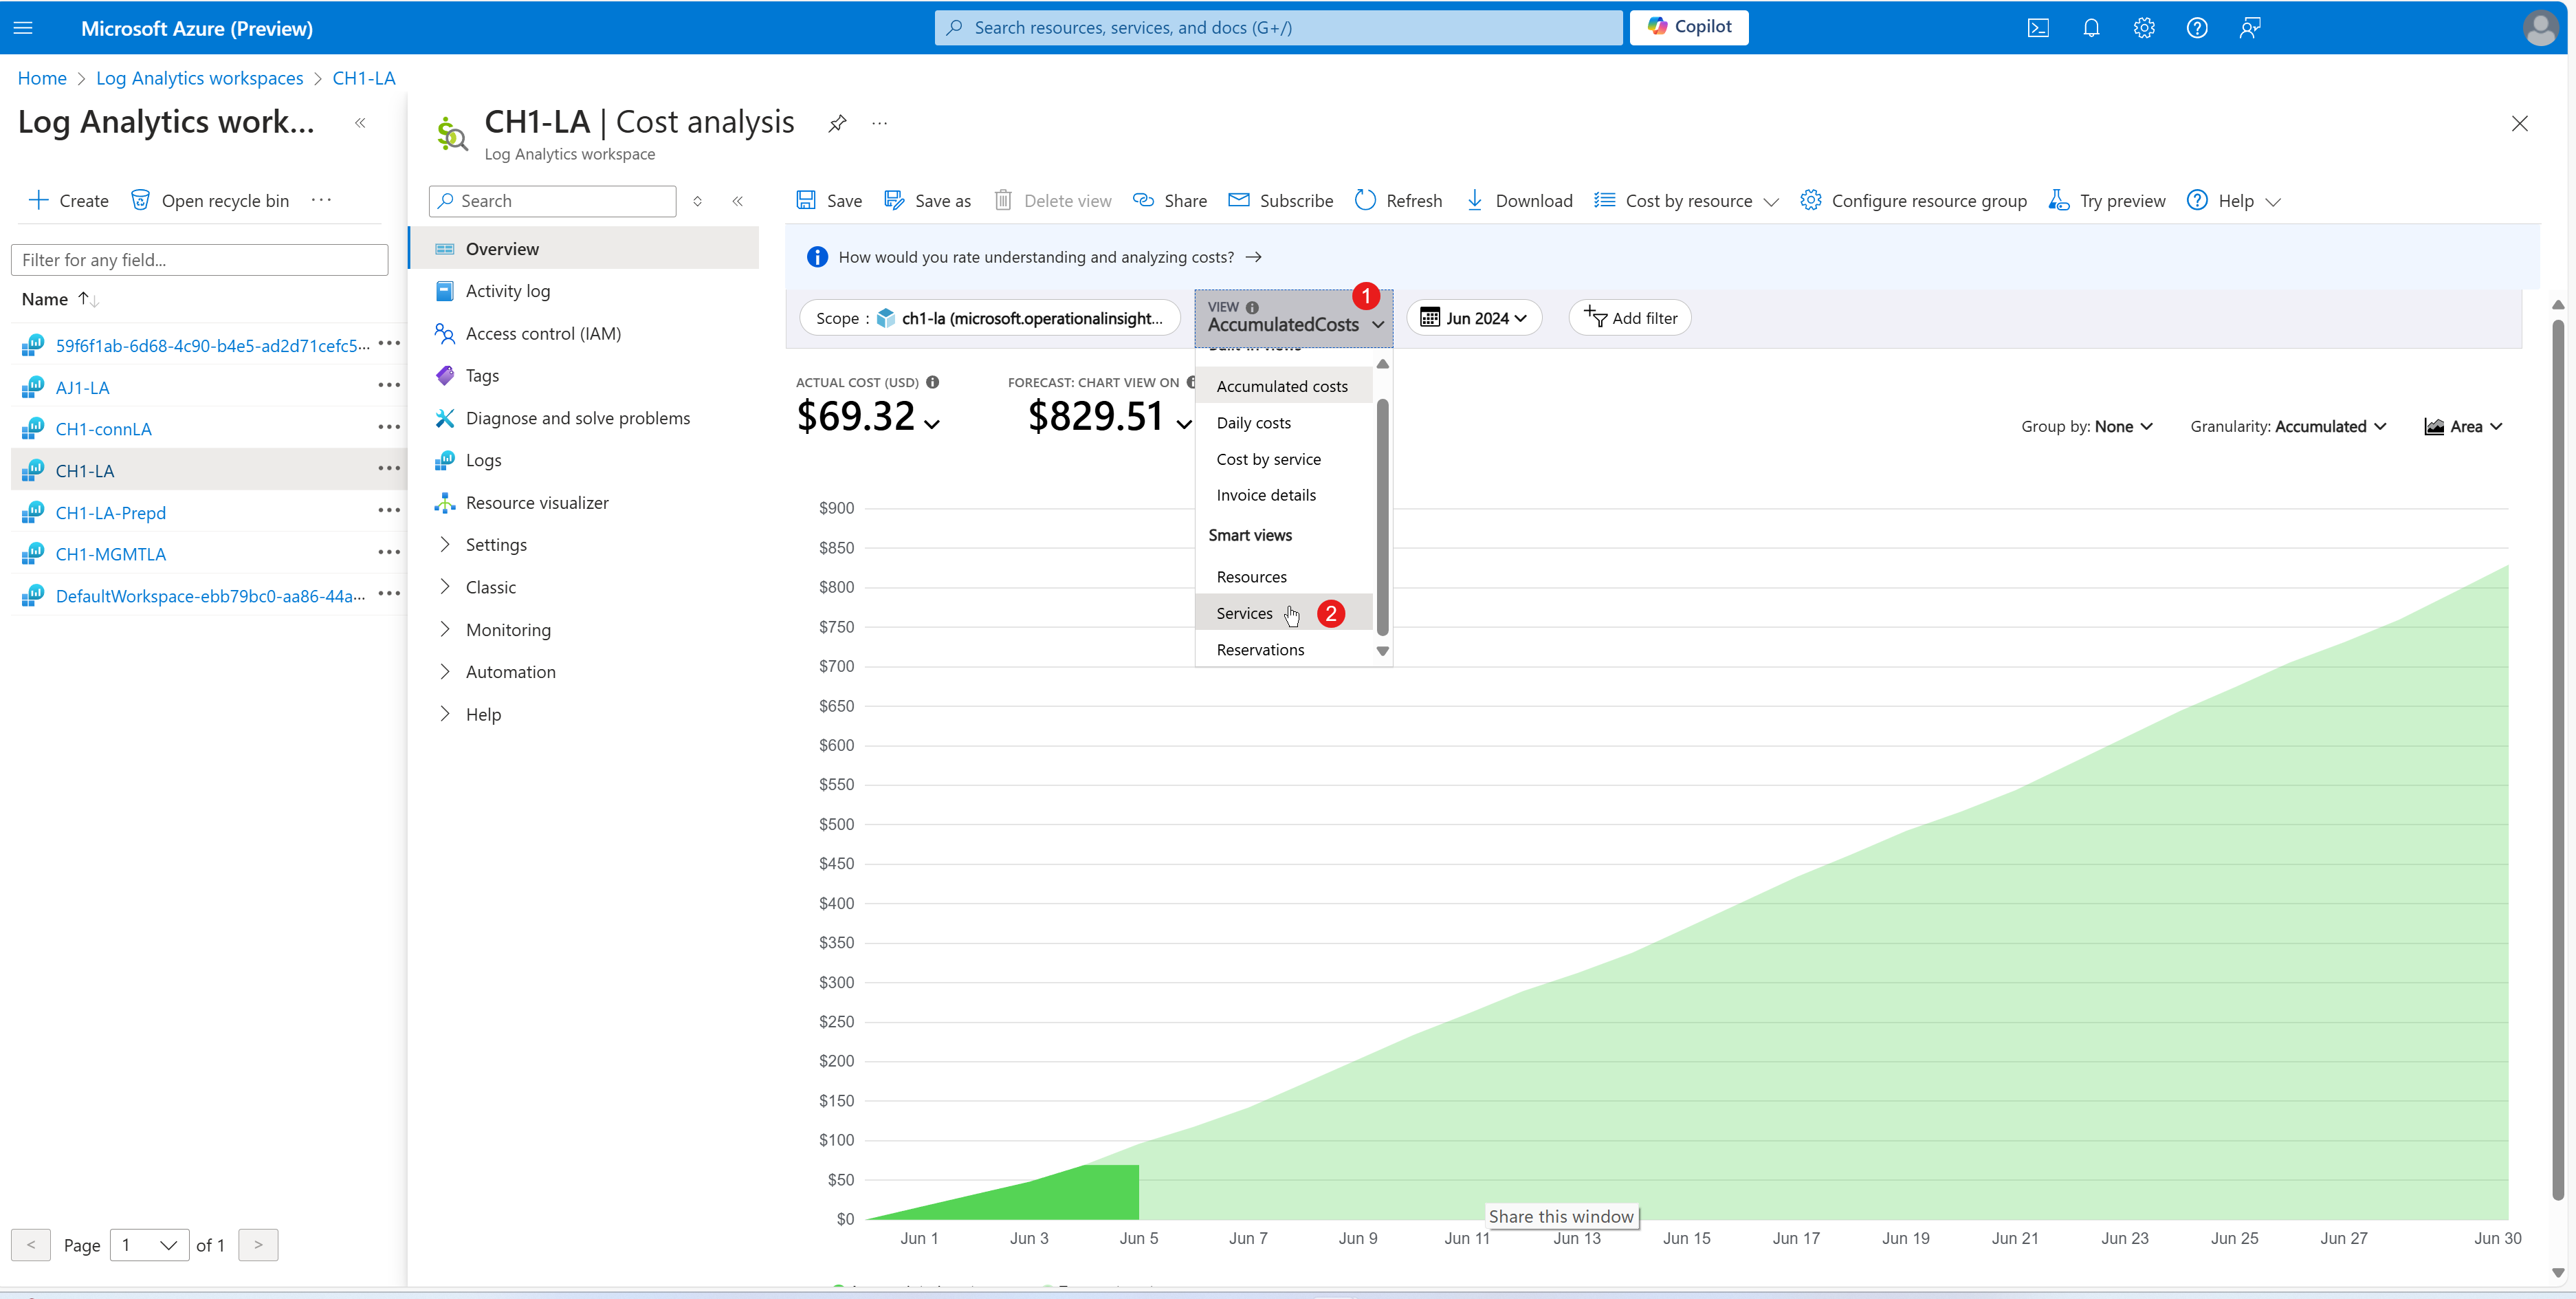
Select the plus sign (+) icon to open a new tab.
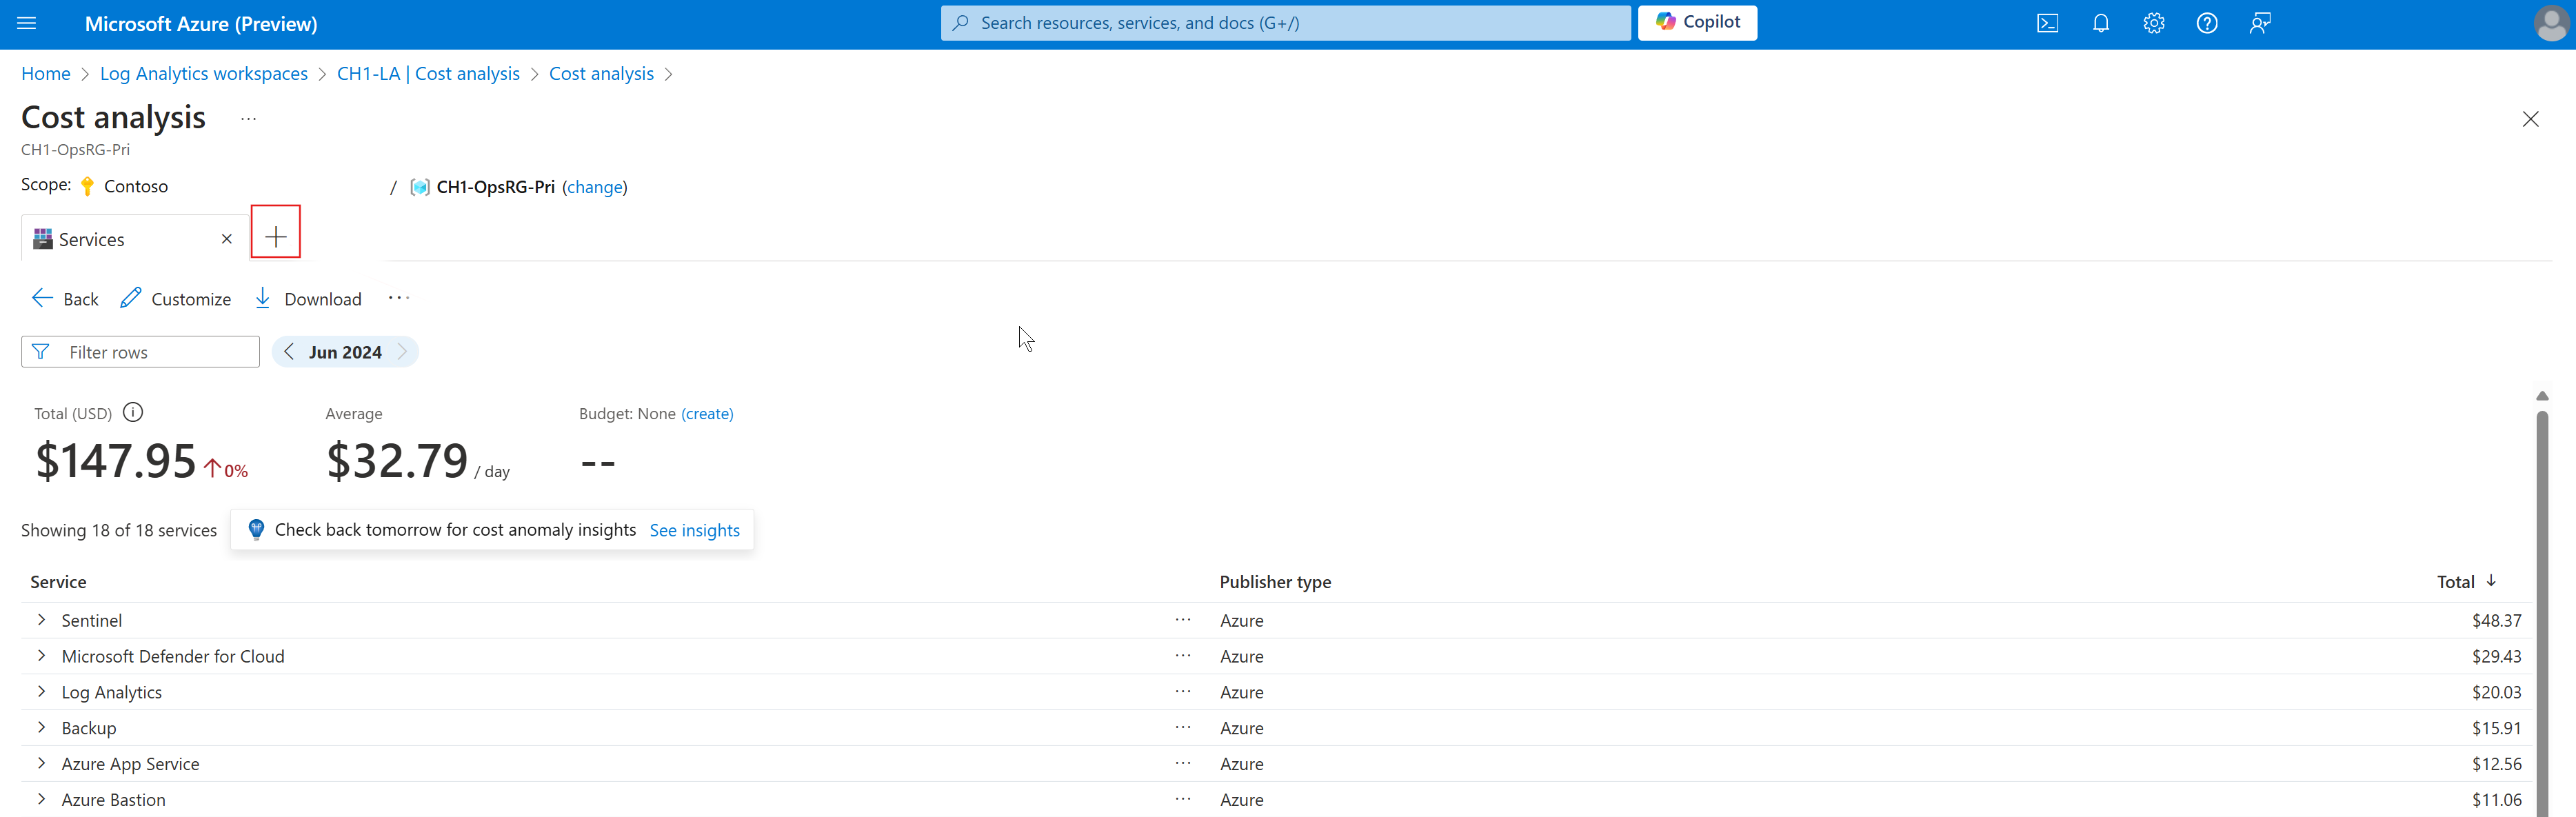
Select Daily costs.
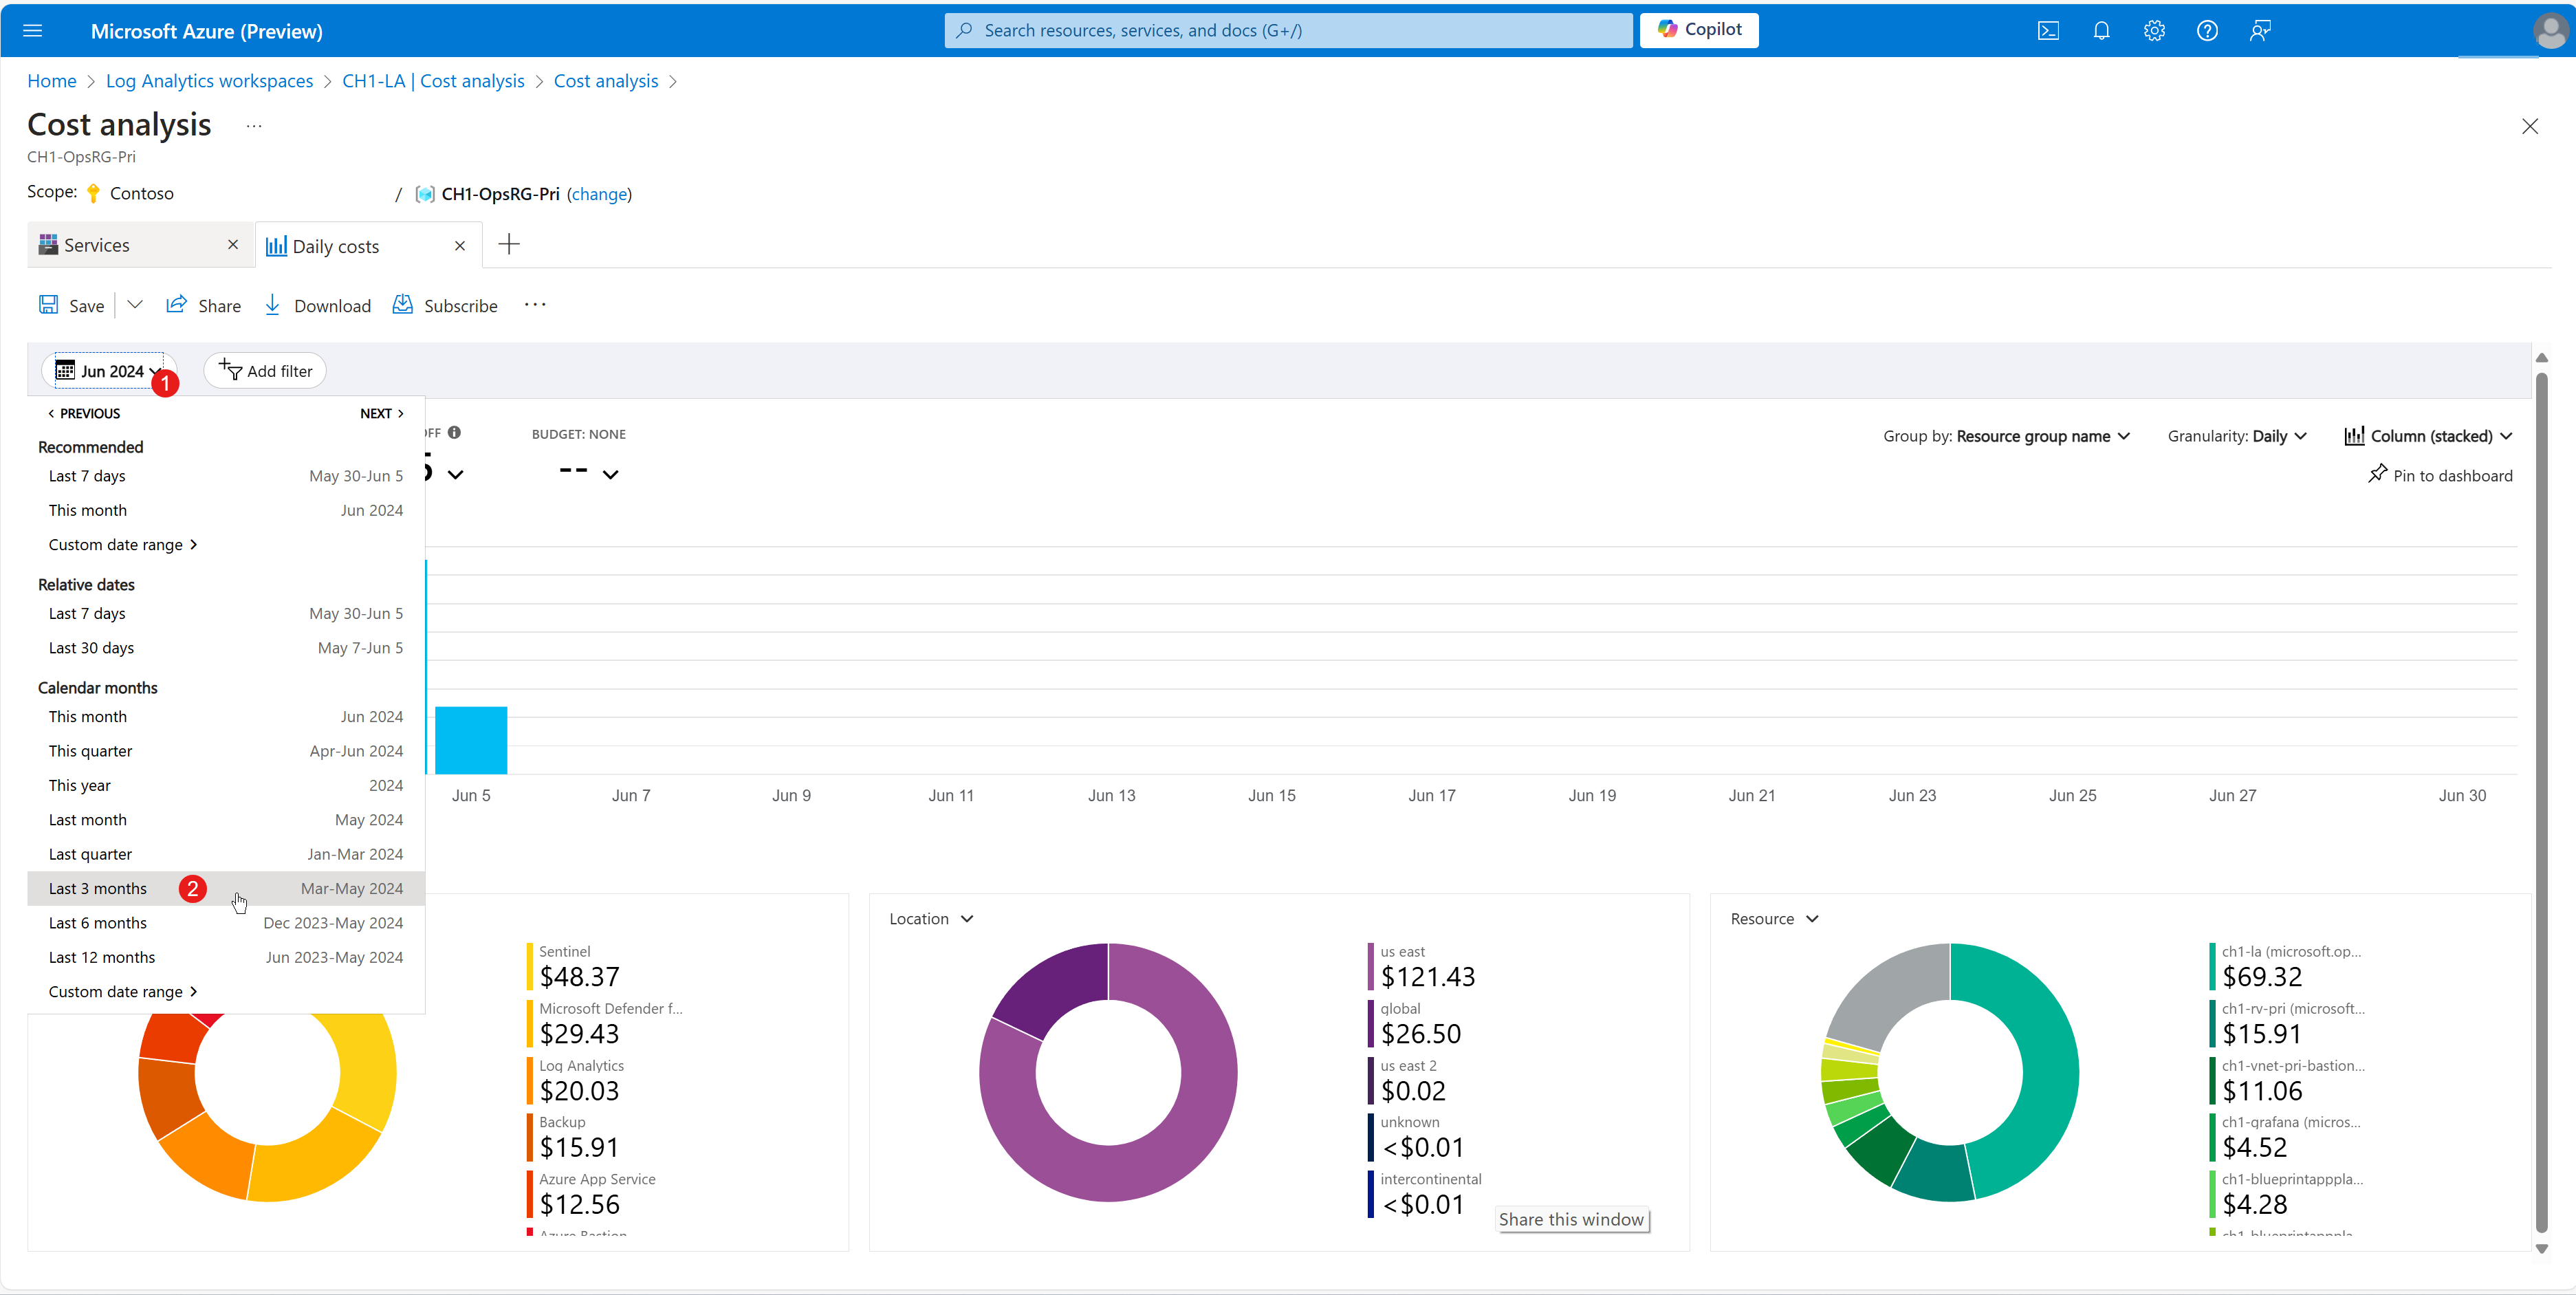
In the date selection, select a date range such as Last 3 months as the timeline.
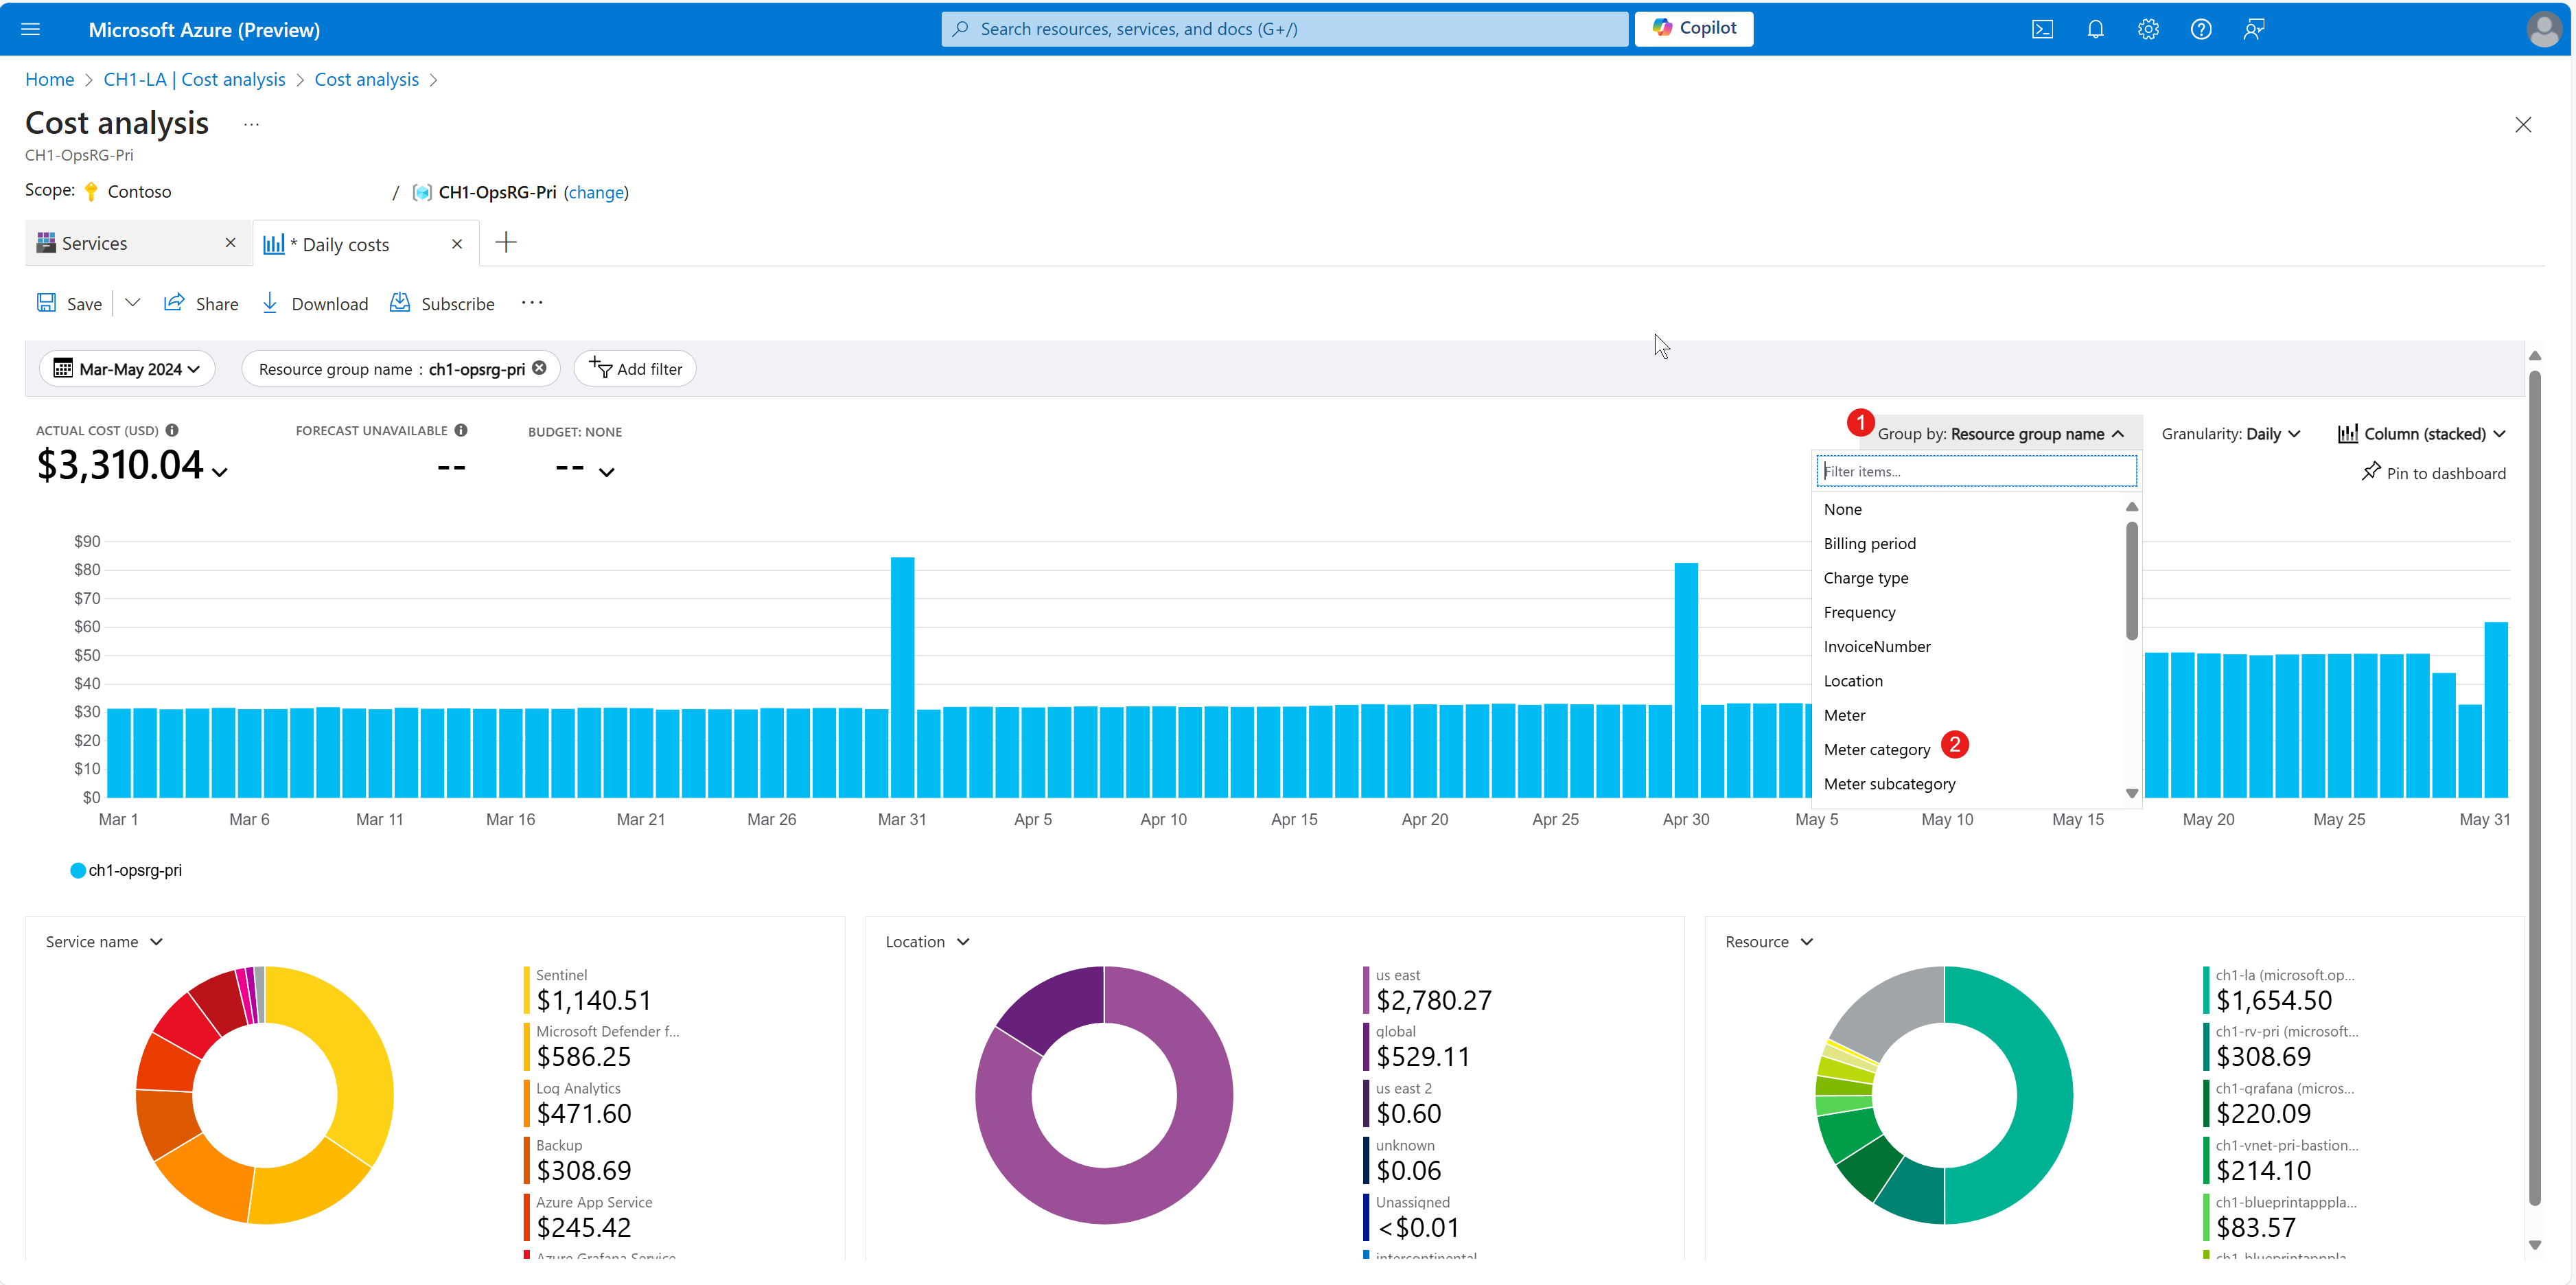
Select the Group by option, and then select Meter category.
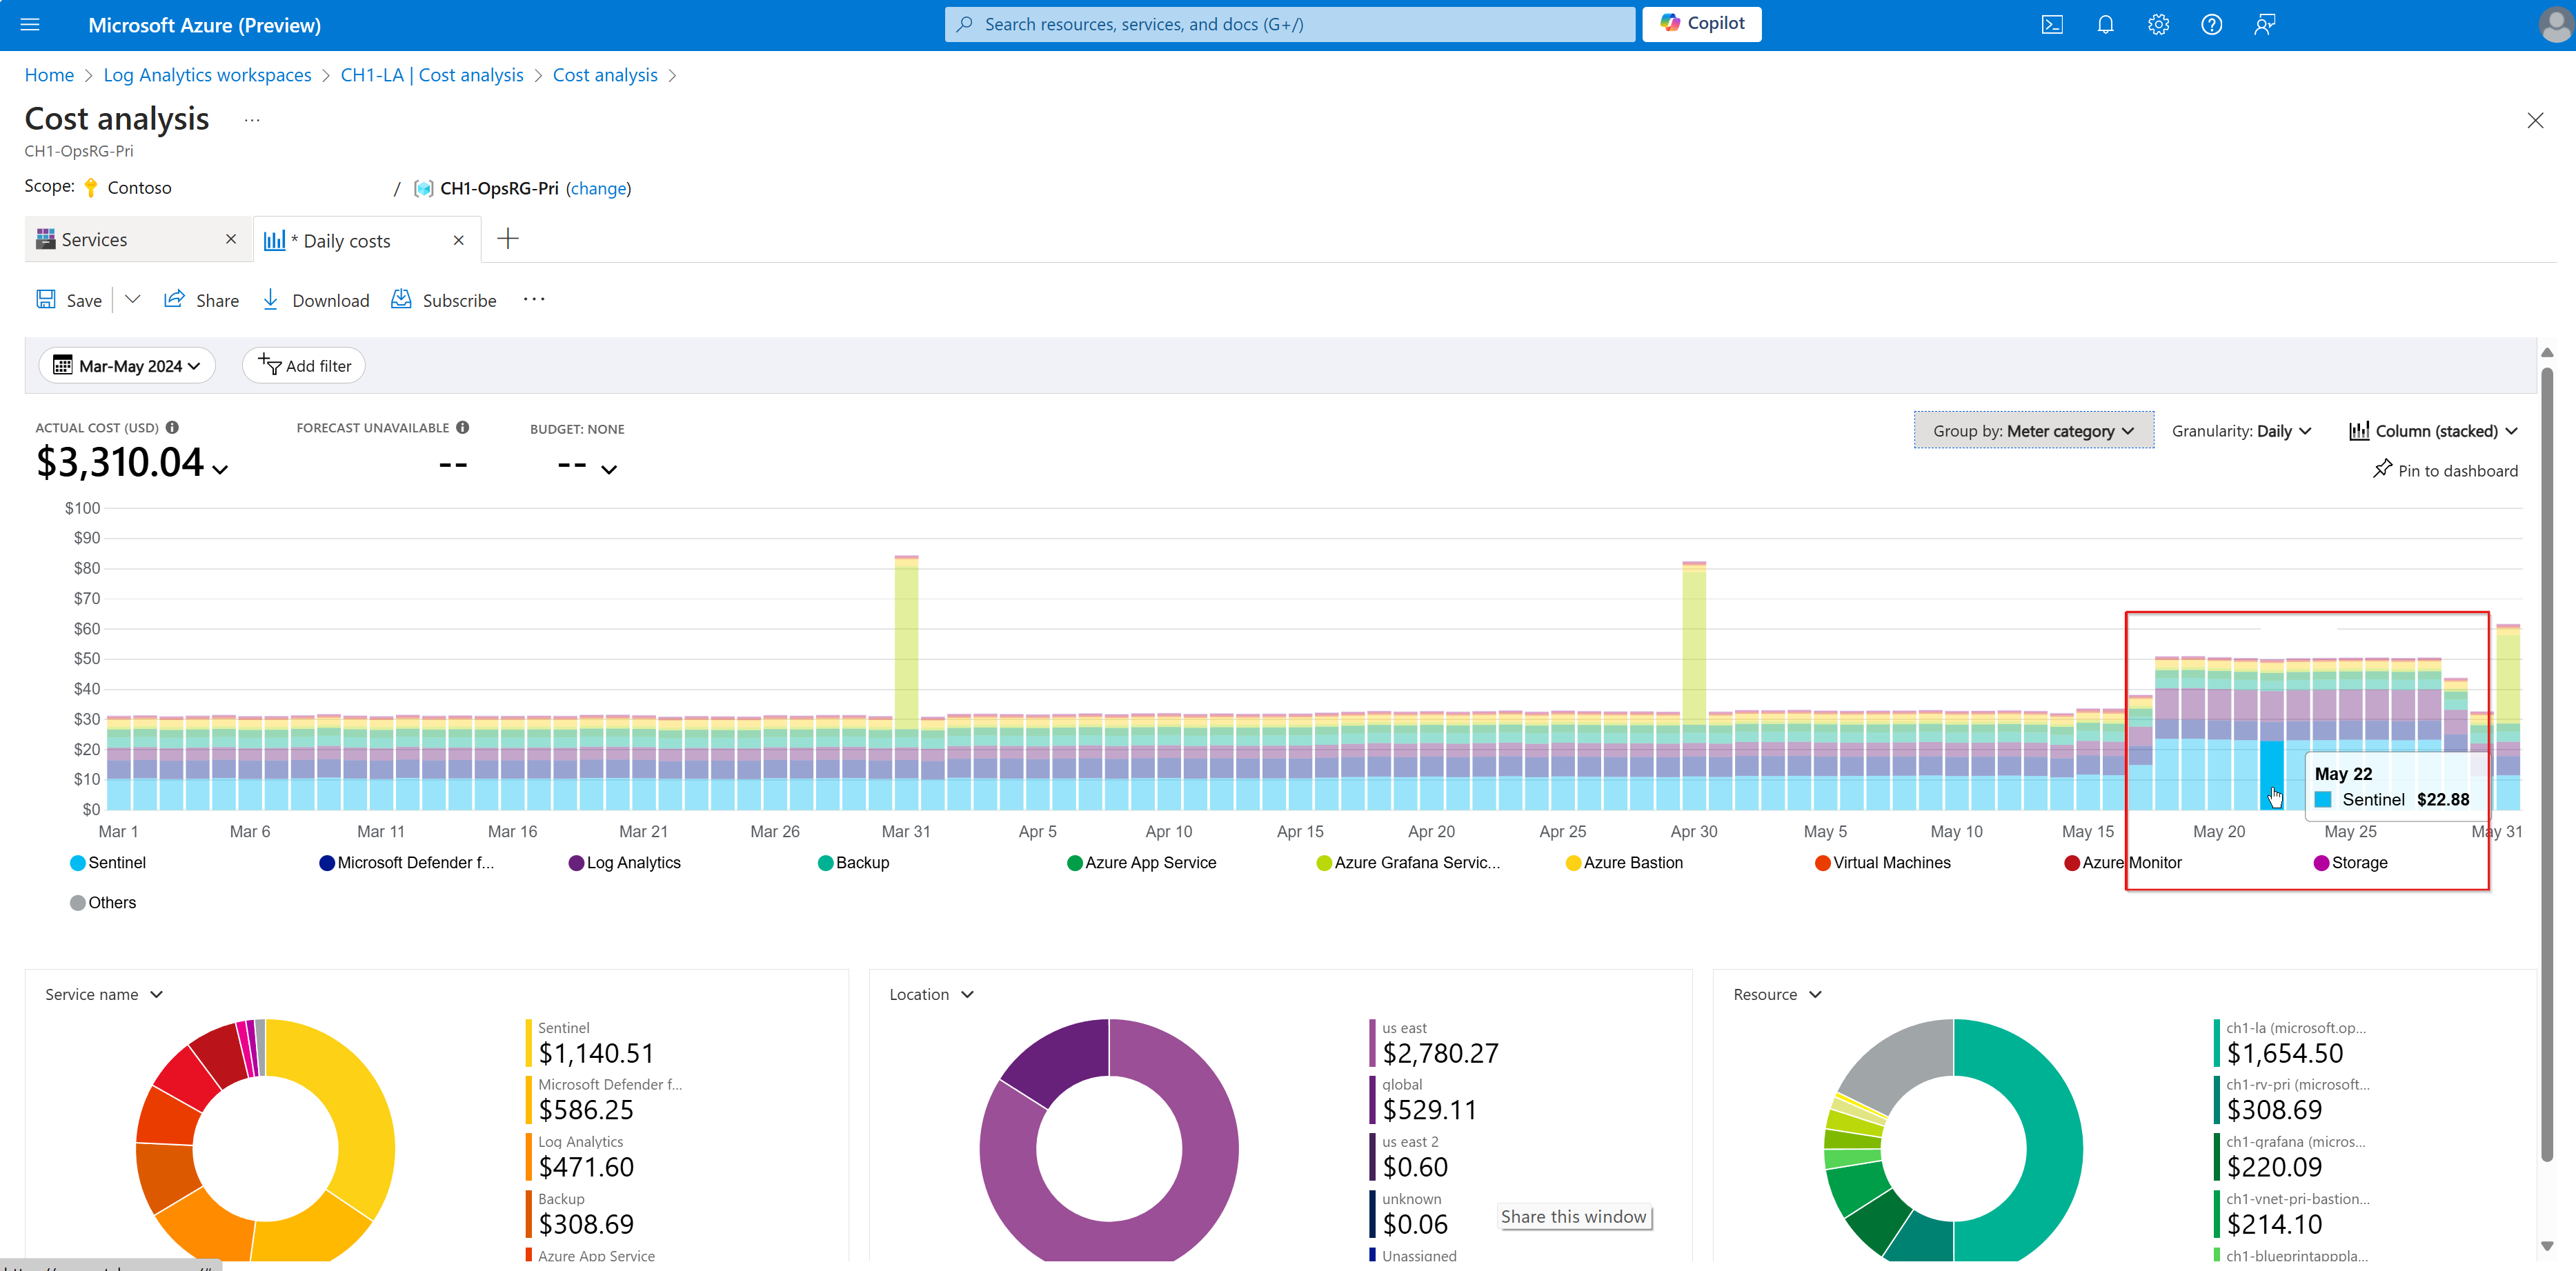
You're now prepared to analyze an assessment of a cost spike, high usage, or other anomaly. The following example shows cost data from a Log Analytics service over the previous three months, grouped by the Meter category selection. In the stacked bar chart, three anomalous cost spikes are evident on March 31, April 30, and May 31. Select the stacked bar for April 30. It indicates that the Azure Grafana service that's linked to this Log Analytics workspace caused the cost spike.
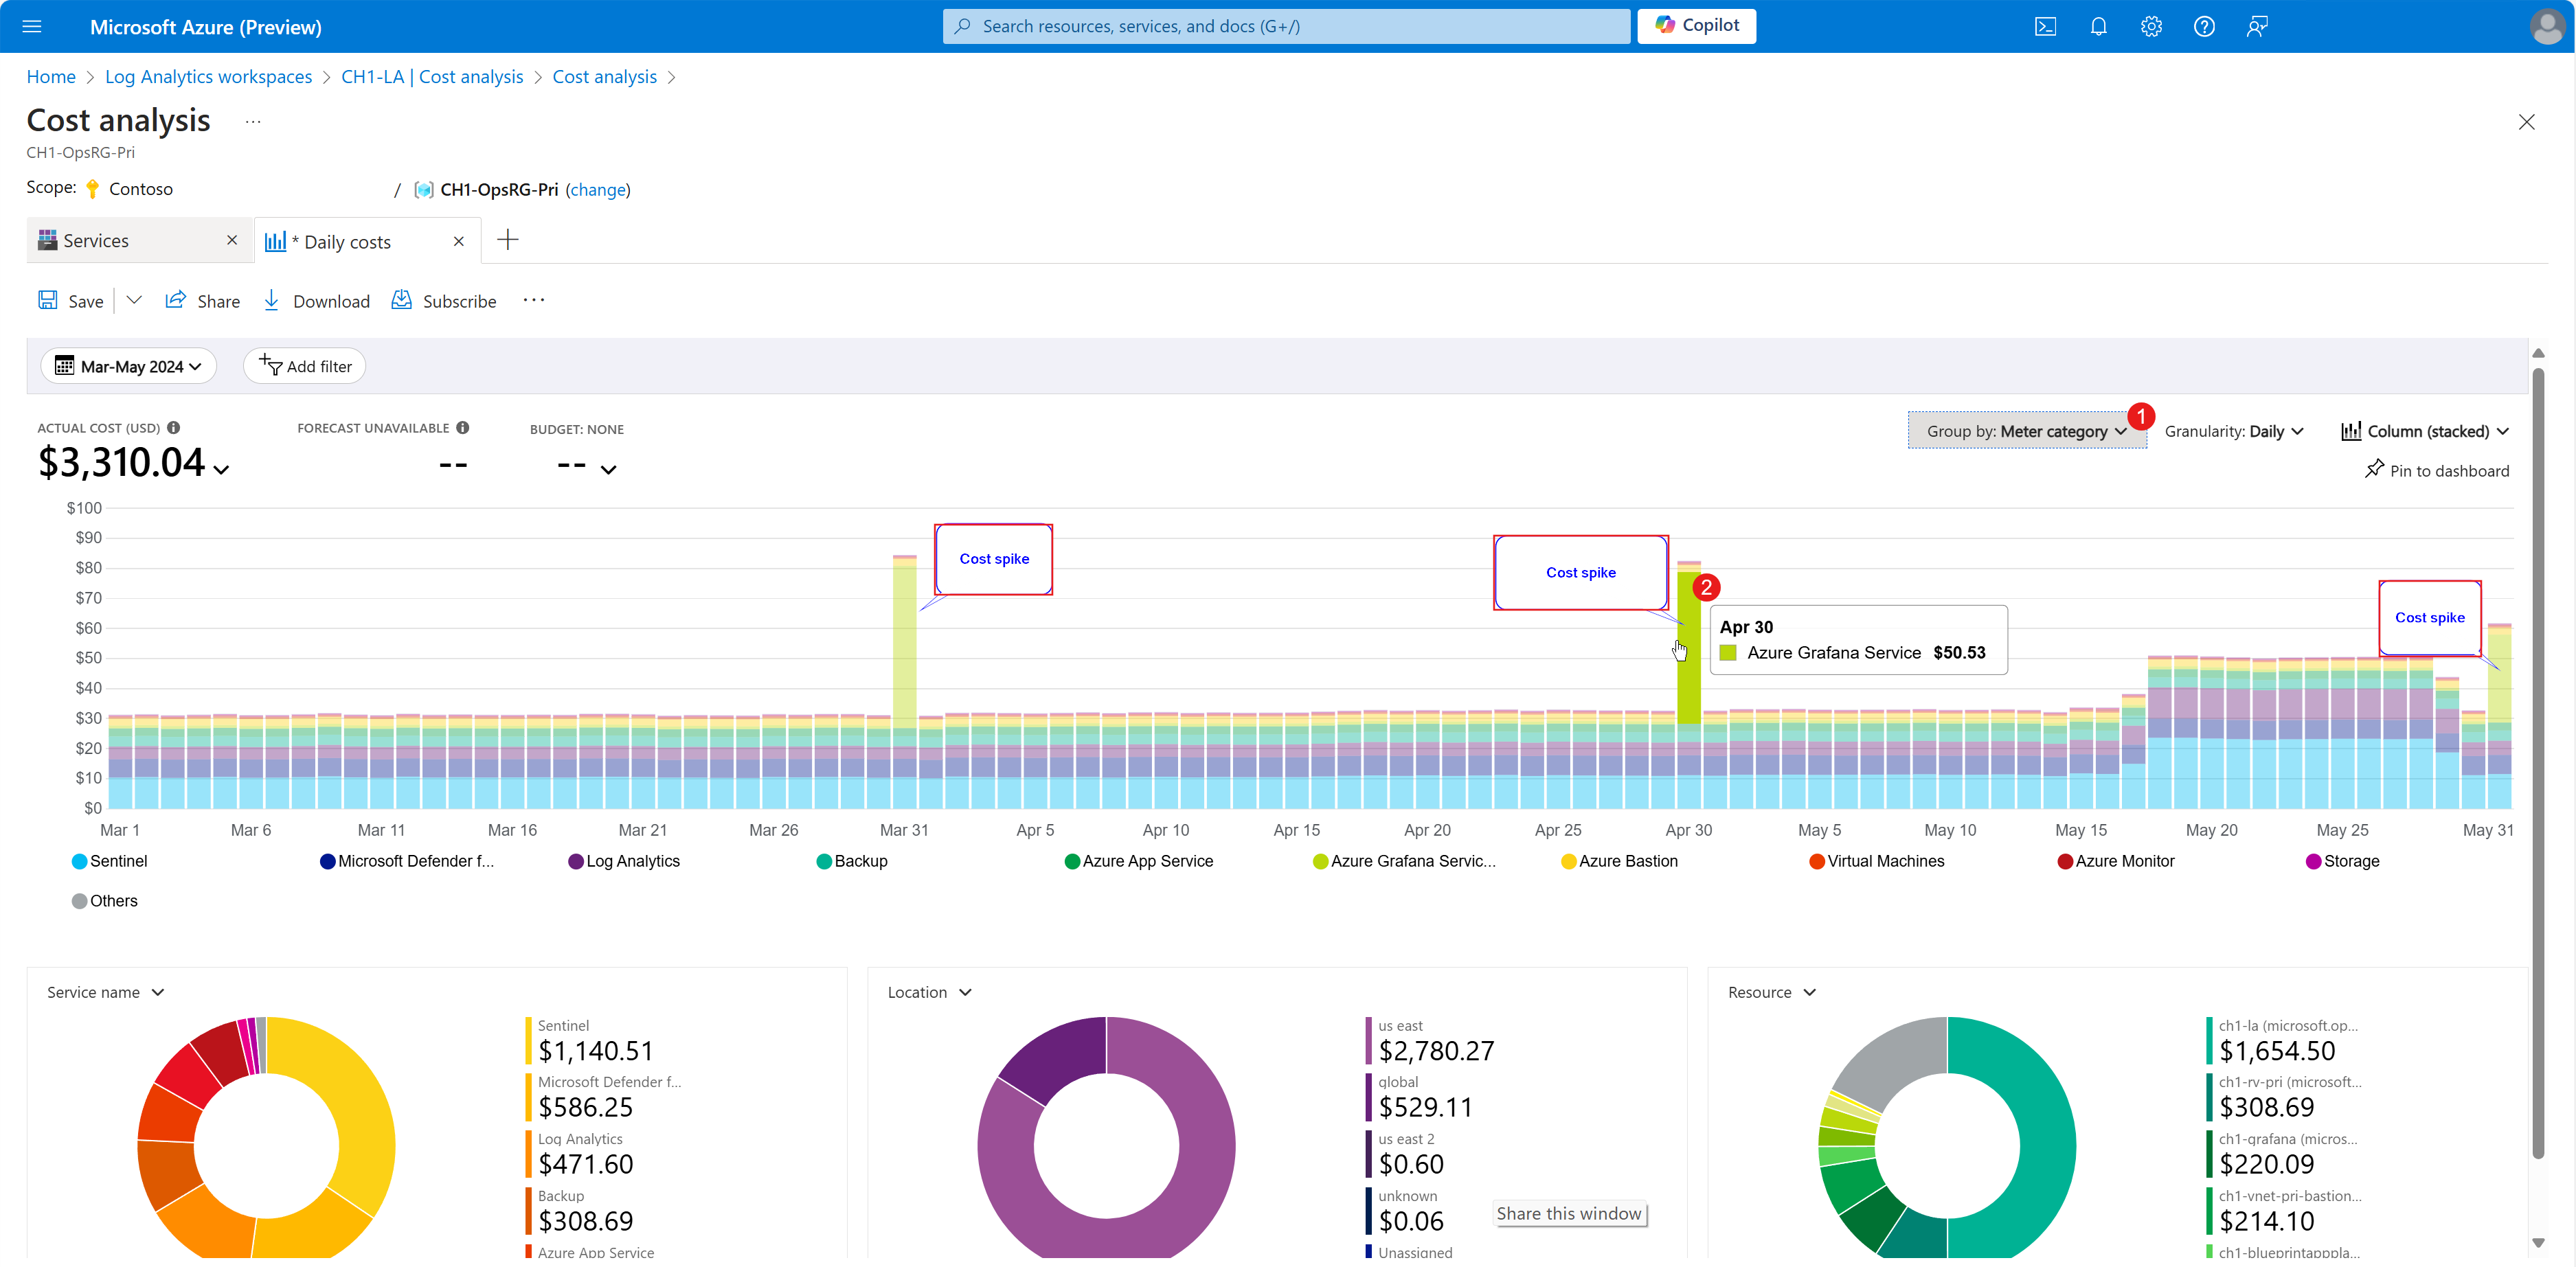
Additionally, the example cost is higher during the late May period because of a spike in Azure Sentinel usage. This is indicated by the increased height of the respective segments within the stacked bar.


After you identify the specific services that are causing the cost spike, you might have to investigate those services to understand why the spike occurred. If you need further assistance to investigate the services, check that respective service’s cost documentation before opening a support case.
Next steps
Contact us for help
If you have questions or need help, create a support request, or ask Azure community support. You can also submit product feedback to Azure feedback community.