Note
Access to this page requires authorization. You can try signing in or changing directories.
Access to this page requires authorization. You can try changing directories.
Learning to manage data volume is crucial to maintain the health and performance of your Microsoft Azure Log Analytics workspace. Daily cap issues might be caused by a high volume of data ingestion or by retention settings that need adjustment. This article provides guidance for using Insights to identify the potential root cause of daily cap issues.
Check usage in Log Analytics workspace
Sign in to the Azure portal.
Enter log analytics in the search bar.
Under Services, select Log Analytics.
Select your specific Log Analytics Workspace.

In the Monitoring section, select Insights.

On the Insights page, set the Time Range to Last 24 hours.
Check the following data:
- Ingestion Volume (2)
- Daily Usage / Cap setting (3)
If the ingestion volume exceeds the daily cap setting is close to exceeding the daily cap limit, you might consider investigating which service is causing this issue or increasing the daily cap.

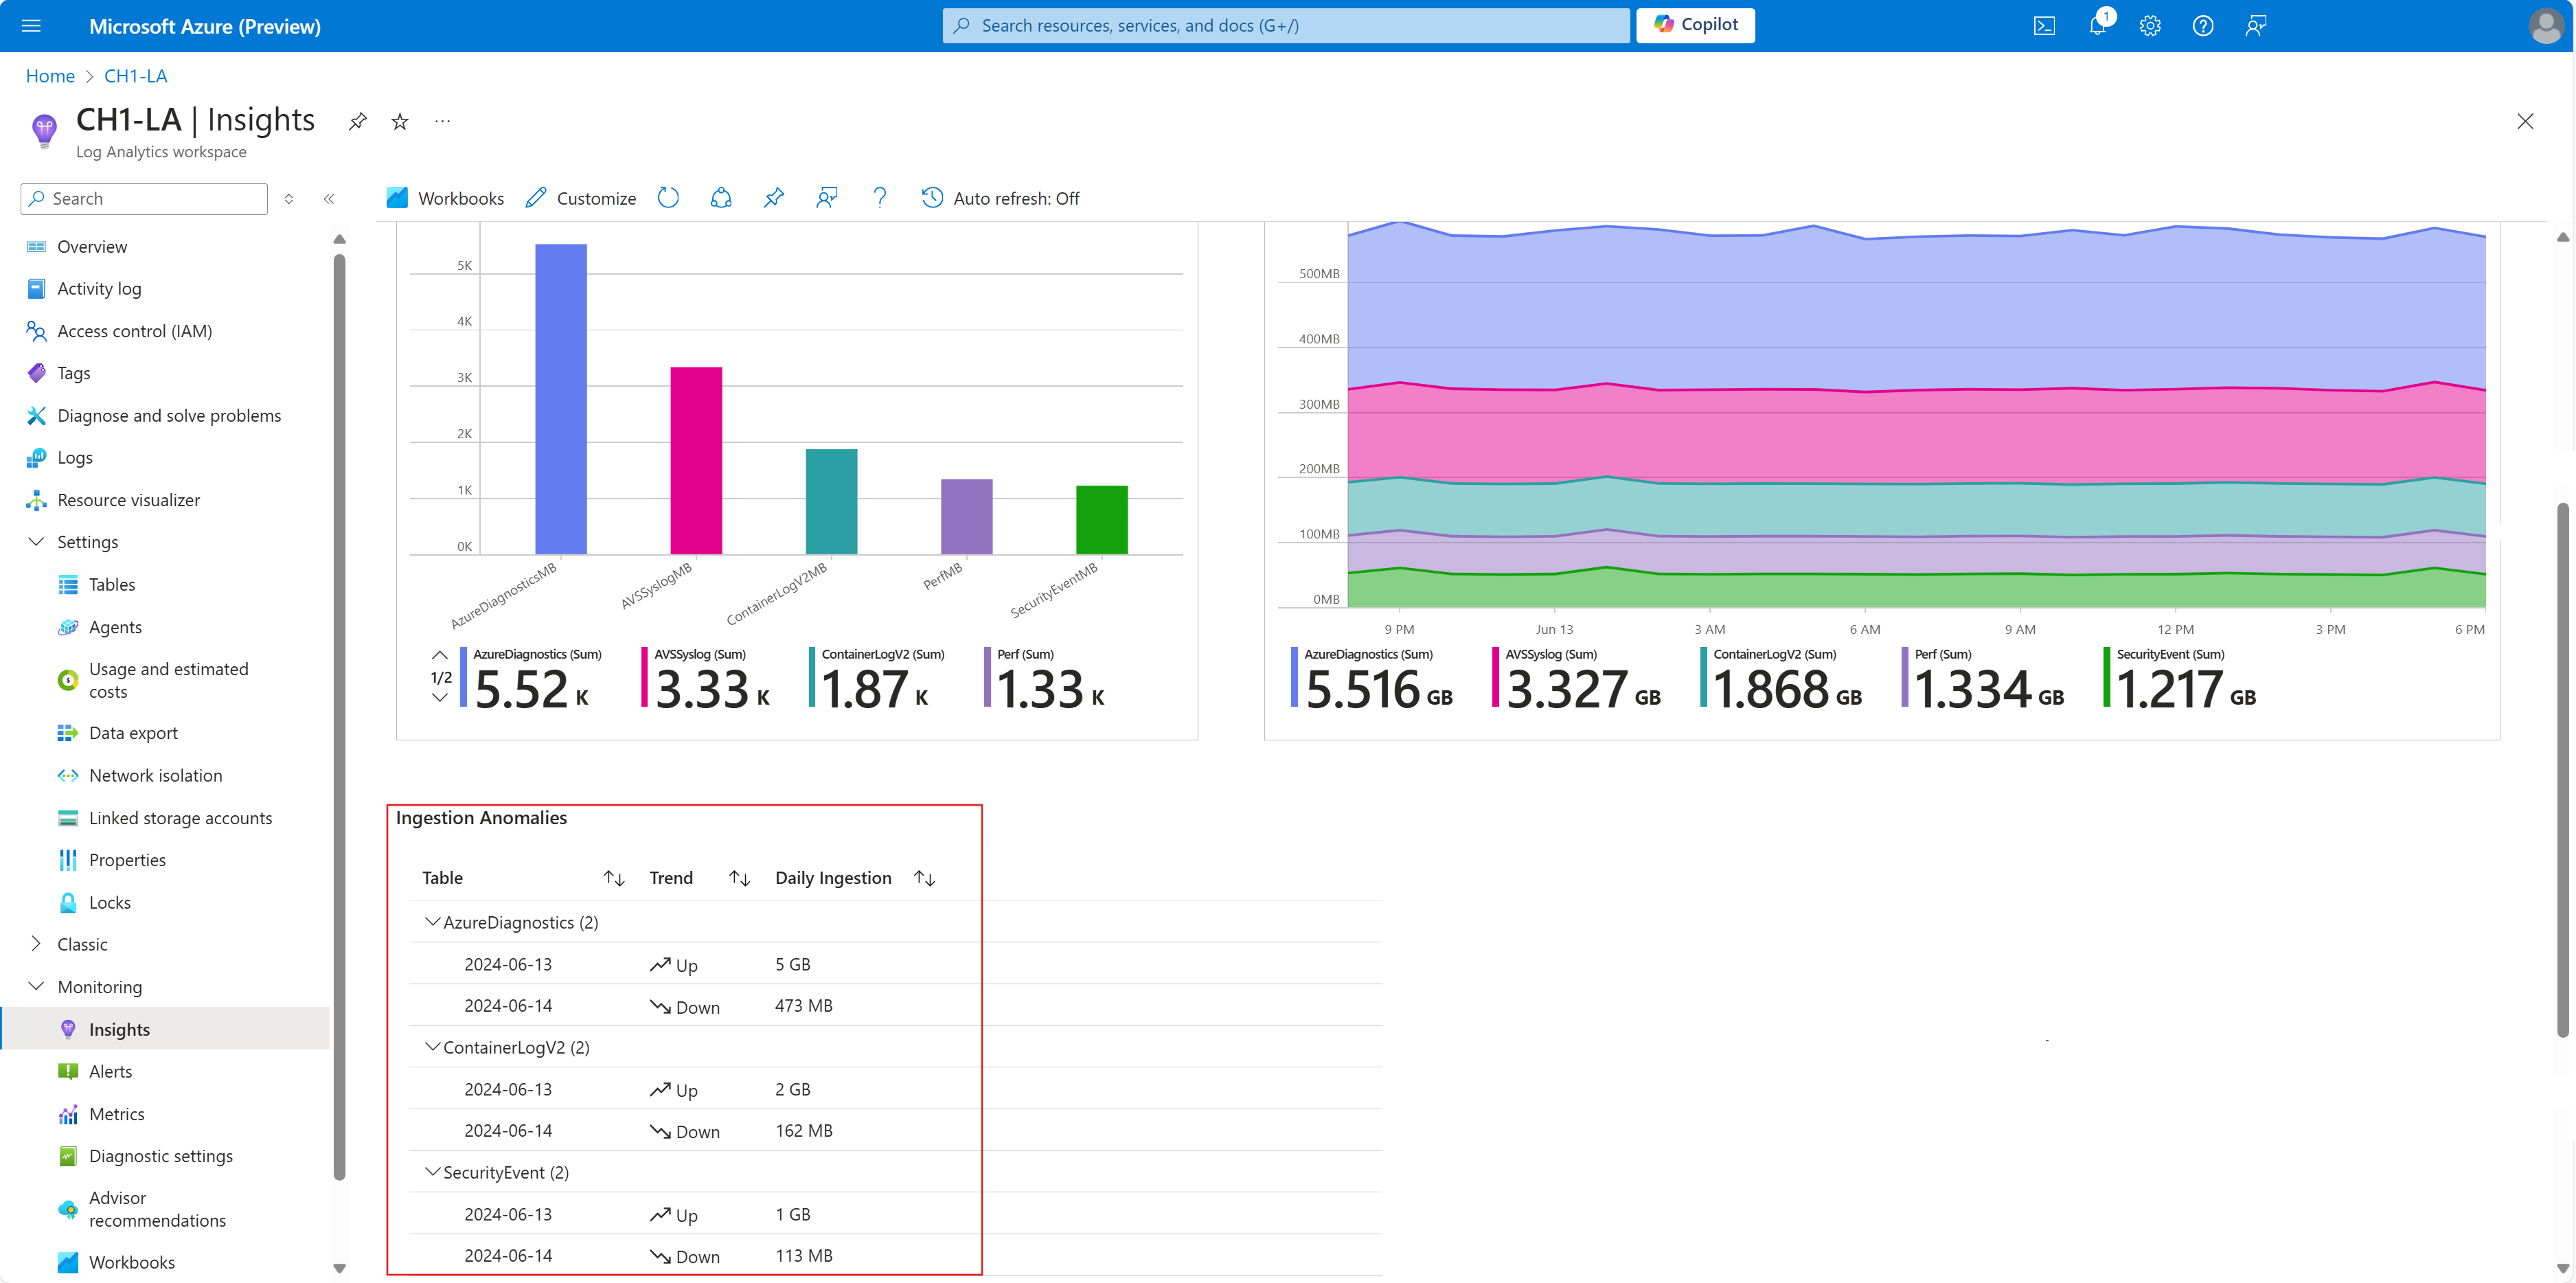
Scroll down to the Ingestion Anomalies section. Anomalies should be investigated further together with the appropriate resource provider to identify issues.
Select the Usage tab (1) on the Insights page. This tab provides information about workspace usage. The dashboard subtab shows the ingestion data that's displayed in tables. It defaults to the five most-ingested tables in the selected time range.
- In the Usage table, select a specific row (2) to show the Ingestion Statistics by Resource subtable.
- In the following example, the AVSSyslog and AzureDiagnostic tables contain a significant volume of ingestion. To identify the resource or application that's responsible for sending data to these tables, select the row in VSSyslog. The example shows that the 'ch1-avs' resource (4) is causing the notable ingestion.

Select the AzureDiagnostic row (1). Notice that most of the data originates from two Kubernetes services that are named KS1 and KS2 (2). Further investigation is necessary to understand why these Kubernetes services are generating high-volume log data.


