Note
Access to this page requires authorization. You can try signing in or changing directories.
Access to this page requires authorization. You can try changing directories.
This article provides troubleshooting steps for an issue where Linux performance counters and other non-heartbeat data are missing in a Log Analytics workspace.
Prerequisites
Ensure that the Linux agent is supported. For supported operating systems, see Linux operating systems supported by Log Analytics agents.
If you're uncertain, use one of the following methods to determine the Linux distribution:
Run the
cat /etc/system-releasecommand in a Linux terminal window.Collect logs for the Linux agent with Linux Agent Log Collector. Find the Linux distribution in the Linux Log Collector output.
Here are troubleshooting steps for this issue. If there are multiple faulty Linux agents, apply these steps to one agent first. After the issue is resolved, apply the same steps to the others.
Step 1: Check if Linux agent sends heartbeats
Basic heartbeats must work first. If the Linux agent doesn't send heartbeats to the workspace, performance counters or other data won't be sent to the workspace.
To check if the Linux agent sends heartbeats, go to the workspace in the Azure portal and run the following query:
Heartbeat | where OSType == "Linux" | summarize arg_max(TimeGenerated, *) by Computer
If the query result doesn't display the computer with the Linux agent installed, it means the Linux agent doesn't send heartbeats. To resolve this issue, see Missing Heartbeats for Linux Agent.
If the query result displays the computer, it means the Linux agent can communicate with the Log Analytics workspace, which rules out Log Analytics ingestion issues. In this case, proceed to Step 2.
Step 2: Check if other Linux agents send performance counters
To collect the most recent performance counter data based on the time frame that's set in the Log Search Dialog, run the following query in the workspace:
Perf | summarize arg_max(TimeGenerated, *) by Computer | order by TimeGenerated desc
If some Linux computers and desired performance counter data are displayed in the query result, and the time stamps are recent, it means that the Linux agents are configured to collect performance counter data and send them to the workspace successfully. In this case, the issue is isolated to these Linux agents, the workspace configuration is set correctly, and these Linux agents get correct configuration.
If the computer with the faulty agent installed is displayed in the query result, the issue is resolved. If not, proceed to the Step 3.
Step 3: Check if Linux agent receives current configuration from workspace
The workspace configuration tells an agent what data to collect and send to the workspace. Use the omsagent log to check the current configuration of the faulty Linux agent. The log can be found in /var/opt/microsoft/omsagent/<workspaceid>/log/. You can also get it through the collected logs in Step 1.
Open the log file and search through the [info]: using configuration file: <ROOT> string from the bottom up to get the most recent time when the Linux agent received configuration data from the workspace.
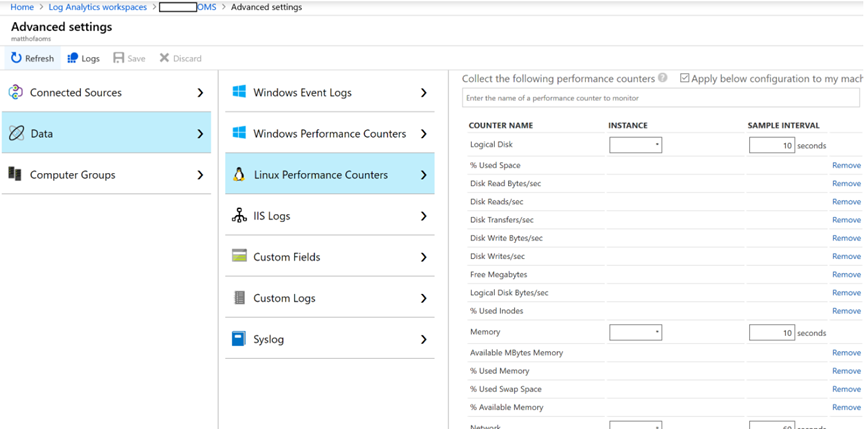
If there are some sources like the following output in the log file, the agent is set to collect some performance counters. Check if the entries match what is shown in Advanced Settings > Data > Linux Performance Counters.
<source>
    type oms_omi
    object_name Logical Disk
    instance_regex .*
    counter_name_r egex (Free Megabytes|% Used Space|Disk Transfers/sec|Disk Reads/sec|Disk Writes/sec)
    interval 90s
    omi_mapping_path /etc/opt/microsoft/omsagent/<workspaceid>/conf/omsagent.d/omi_mapping.json
</source>
<source>
    type oms_omi
    object_name Processor
    instance_regex .*
    counter_name_regex (% Processor Time|% Privileged Time)
    interval 90s
    omi_mapping_path /etc/opt/microsoft/omsagent/<workspaceid>/conf/omsagent.d/omi_mapping.json
</source>
<source>
    type oms_omi
    object_name Memory
    instance_regex .*
    counter_name_regex (Available MBytes Memory|% Used Memory|% Used Swap Space)
    interval 90s
    omi_mapping_path /etc/opt/microsoft/omsagent/<workspaceid>/conf/omsagent.d/omi_mapping.json
</source>
<source>
    type oms_omi
    object_name Network
    instance_regex .*
    counter_name_regex (Total Bytes Transmitted|Total Bytes Received)
    interval 90s
    omi_mapping_path /etc/opt/microsoft/omsagent/<workspaceid>/conf/omsagent.d/omi_mapping.json
</source>
If there's no such performance counter entry in the log file, check the time stamp for the [info]: using configuration file: entry. If the time stamp predates the time when performance counters are configured to collect, the Linux agent doesn't receive the current configuration from the workspace. To resolve this issue, force the Linux agent to pull the current configuration from the workspace.
Force Linux agent to pull current configuration from workspace
To force a Linux agent to pull the current configuration from a workspace, run the following command:
sudo -u omsagent python /opt/microsoft/omsconfig/Scripts/PerformRequiredConfigurationChecks.py
The following output is returned if it works:
[2020/02/20 02:13:25] [4427] [INFO] [0] [/opt/microsoft/omsconfig/Scripts/PerformRequiredConfigurationChecks.py:0] dsc_host lock file is acquired by: PerformRequiredConfigurationChecks
Operation PerformRequiredConfigurationChecks completed successfully. Operation was successful.
If it doesn't work, run the following command to stop and start the Linux agent by using a Linux terminal window:
sudo /opt/microsoft/omsagent/bin/service_control stop
sudo /opt/microsoft/omsagent/bin/service_control start
After this command runs, the Linux agent will pull new configuration from the workspace. Once the agent starts again, check if a performance counter entry is displayed in the omsagent log.
If a performance counter entry is displayed, go to the Azure portal and run the following query to check if the Linux agent sends performance counter data to the workspace (the Linux agent may take a few minutes to appear in the query result):
Perf | summarize arg_max(TimeGenerated, *) by Computer | order by TimeGenerated desc
If the Linux agent appears, this issue is resolved. If the Linux agent doesn't appear, consider that there are different issues with it.
Contact us for help
If you have questions, you can ask Azure community support. You can also submit product feedback to Azure feedback community.