Troubleshoot application pool crashes on a Cloud Services virtual machine
This article discusses how to resolve application pool crashes on a virtual machine (VM) in Microsoft Azure Cloud Services. If an application pool crashes, your application will stop responding.
Step 1: Check for errors in processes that serve application pools
In Event Viewer, if you select Windows Logs > System in the console tree, you might see one of the following events:
A process serving application pool '%1' suffered a fatal communication error with the Windows Process Activation Service. The process id was '%2'. The data field contains the error number.
A process serving application pool '%1' terminated unexpectedly. The process id was '%2'. The process exit code was '%3'.
These events clearly indicate an application pool crash. Because something went wrong within the application, the application pool had to be terminated. After the application pool is terminated, its corresponding w3wp.exe process is also terminated. Any cache-based or session-based information that you saved within the w3wp.exe process will be erased.
Step 2: Check whether the application pool was automatically disabled because of related process failures
Ideally, when an application pool crashes, a new w3wp.exe process is spawned automatically to honor the incoming requests. However, if the application pool crashes more than five times within a period of five minutes, the application pool goes into a stopped state. You'll have to restart the application pool manually to get it up and running. If something similar occurs, you'll observe the following event under the system logs in Event Viewer:
Application pool '%1' is being automatically disabled due to a series of failures in the process(es) serving that application pool.
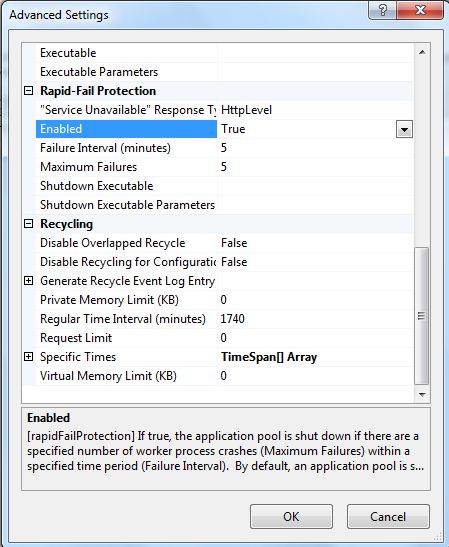
You can configure these settings in that application pool's Advanced Settings dialog box, under the Rapid-Fail Protection section. The Enabled property has a default value of True. If the Enabled property is True, the application pool will stop after the failure limit is reached within a certain time. The failure limit is represented by the Maximum Failures property. This property has a default value of 5. The time span is represented by the Failure Interval (minutes) property. This property also defaults to 5.
Step 3: Capture the w3wp.exe process dump files
After you determine that the application crashed, determine exactly why it crashed. You'll have to capture a dump file of the w3wp.exe process just before it terminates. There are many ways to capture this file. You can set up Windows Error Reporting (WER), ProcDump and DebugDiag to capture a crash dump file. This article discusses only the DebugDiag method of capturing data.
To download and install DebugDiag, follow these steps:
Go to the Debug Diagnostic Tool v2 site, and then select Download.
For Choose the download you want, select the appropriate Microsoft Windows Installer (MSI) file version for your computer architecture, and then select Next.
Open the downloaded file. In the setup wizard, accept the default options, and then finish installing the app.
To set up the DebugDiag 2 Collection application, follow these steps:
Select Start, enter DebugDiag 2 Collection, and then open the newly installed app from the results list.
In the Select Rule Type dialog box, select the Crash option, and then select Next.
In the Select Target Type dialog box, select the A specific IIS web application pool option, and then select Next.
In the Select Target dialog box, select the specific application pool that's crashing, and then select Next. If a window opens that states that Internet Information Services (IIS) management isn't installed and that the application pools won't be listed, select OK, and then enter the application name manually.
In the Advanced Configuration (Optional) dialog box, select Breakpoints > Add Breakpoint.
Make the following selections to create a new breakpoint, and then select OK.
Field Description Value Offset Expression The process to capture Ntdll!ZwTerminateProcess Action Type The type of dump that's captured Full userdump Action Limit The number of dumps to capture 10 In the Configure Breakpoints dialog box, verify that the new Breakpoint Expression item is shown. Select Save & Close to return to the Advanced Configuration (Optional) dialog box, and then select Next to activate the breakpoint.
In the Select Dump Location And Rule Name (Optional) dialog box, enter a Rule Name, and then, change the Userdump Location to a drive and directory that has enough free disk space, if this is necessary. (The size of each dump file will match what's consumed by the w3wp.exe process in memory.)
Select Next.
To activate the rule, select Finish.
Now, the crash rule is in an active state, and the Userdump Count is 0. When the issue occurs, the dump count immediately increases, and a corresponding dump file is generated.
Note
A normal recycle of the application pool can also trigger a dump file. This occurs because, when it recycles, the application pool's corresponding w3wp.exe process ID (PID) changes. This generates a dump file. This file is a false positive. Therefore, it won't help you to analyze the application pool crash. Whenever you see an increment in the userdump count, check the event logs to see whether the expected crash events occurred. If the events are as expected, then the dump that was captured is correct.
Step 4: Analyze the w3wp.exe process dump files
After the dump file is captured, you can open Start > DebugDiag 2 Analysis. This application lets you analyze the captured crash dump file.
Make sure that you have the symbol path set correctly. This is a two-part process. In DebugDiag 2 Analysis, select Settings (the gear icon). Under Symbol search paths to use for Analysis, verify that _NT_SYMBOL_PATH and Microsoft Public Symbol Servers are selected.
Reopen DebugDiag 2 Collection, and select Tools > Options and Settings. Then, in the Options & Settings dialog box, make sure that your Symbol Search Path for Debugging (i.e. Crash Rules) box is set to srv*c:\symcache*https://msdl.microsoft.com/download/symbols. This path causes DebugDiag to download symbols as needed from the Microsoft public symbol server, and then store them in the c:\symcache directory.
After you change or verify your symbol path settings, you can analyze the captured dump files. To start the analysis, return to DebugDiag 2 Analysis, and then double-click the name of a dump file. After the report is generated, you can open it in the browser and understand the call stack of the thread that triggered the breakpoint expression. Read the call stack from bottom to top, and then determine which method or component triggered the application pool to crash. If you can't find a precise exception call stack, look further at the .NET call-stack in the same dump file analysis.
Step 5: Check for unhandled exceptions in the w3wp.exe or WaWorkerHost.exe process
To also check for any unhandled exceptions that caused the w3wp.exe or WaWorkerHost.exe process to stop, see Unhandled exceptions cause ASP.NET-based applications to quit unexpectedly in the .NET Framework.
Third-party information disclaimer
The third-party products that this article discusses are manufactured by companies that are independent of Microsoft. Microsoft makes no warranty, implied or otherwise, about the performance or reliability of these products.
Contact us for help
If you have questions or need help, create a support request, or ask Azure community support. You can also submit product feedback to Azure feedback community.