Note
Access to this page requires authorization. You can try signing in or changing directories.
Access to this page requires authorization. You can try changing directories.
This article describes Azure Monitor Application Insights features that are useful to troubleshoot application-related issues.
Note
This article applies to both classic cloud service and cloud service extended support.
Configure Application Insights for Cloud Service apps
To monitor your app with Application Insights, follow these steps:
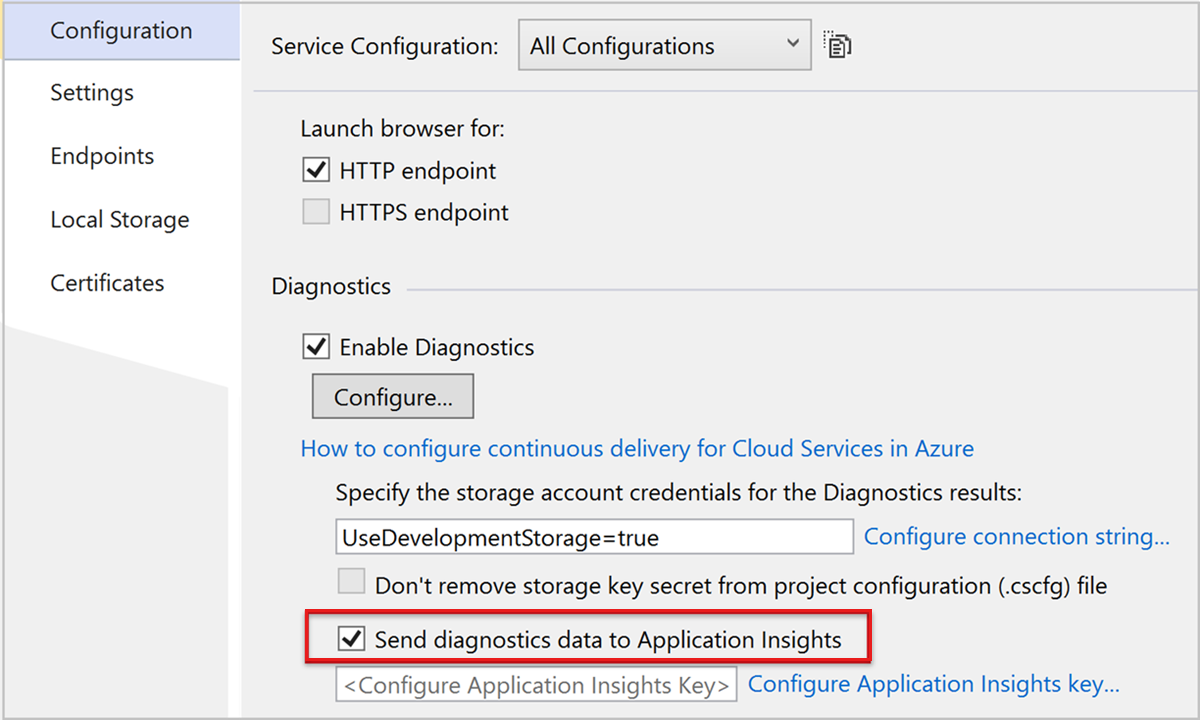
- In Visual Studio Solution Explorer, under Your Cloud Service > Roles, open the properties of each role.
- In Configuration, select the Send diagnostics data to Application Insights check box, and then select the Application Insights instance that you created before.
For web roles, this option provides performance monitoring, alerts, diagnostics, and usage analysis. For other roles, you can search and monitor Azure Diagnostics, such as restart and performance counters.
Diagnose failures in Application Insights
Application Insights comes with curated Application Performance Management experience to help diagnose failures in your monitored applications. To view the failures in the Azure portal, go to the Application Insights instance, and then select Failures under Investigate.
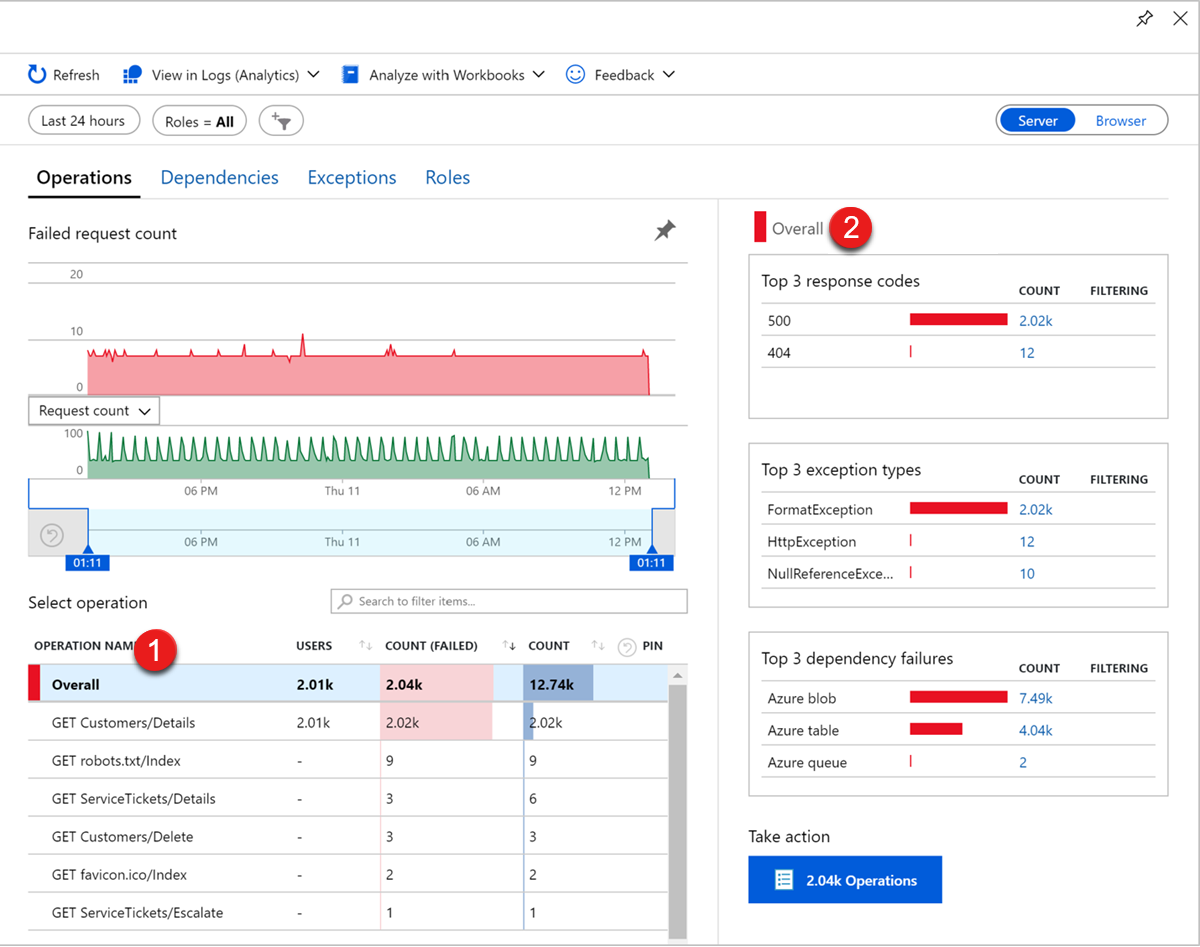
You'll see the failure rate trends for your requests, how many of them are failing, and how many users are affected. The failed operation table1 shows the failed requests that are grouped by request URL. In Overall view2, you'll see the top three response codes, the top three exception types, and the top three failing dependency types.
To review representative samples for each of these subsets of operations, select the corresponding link. As an example, to diagnose exceptions, you can select the count of a particular exception to be presented with the End-to-end transaction details tab.
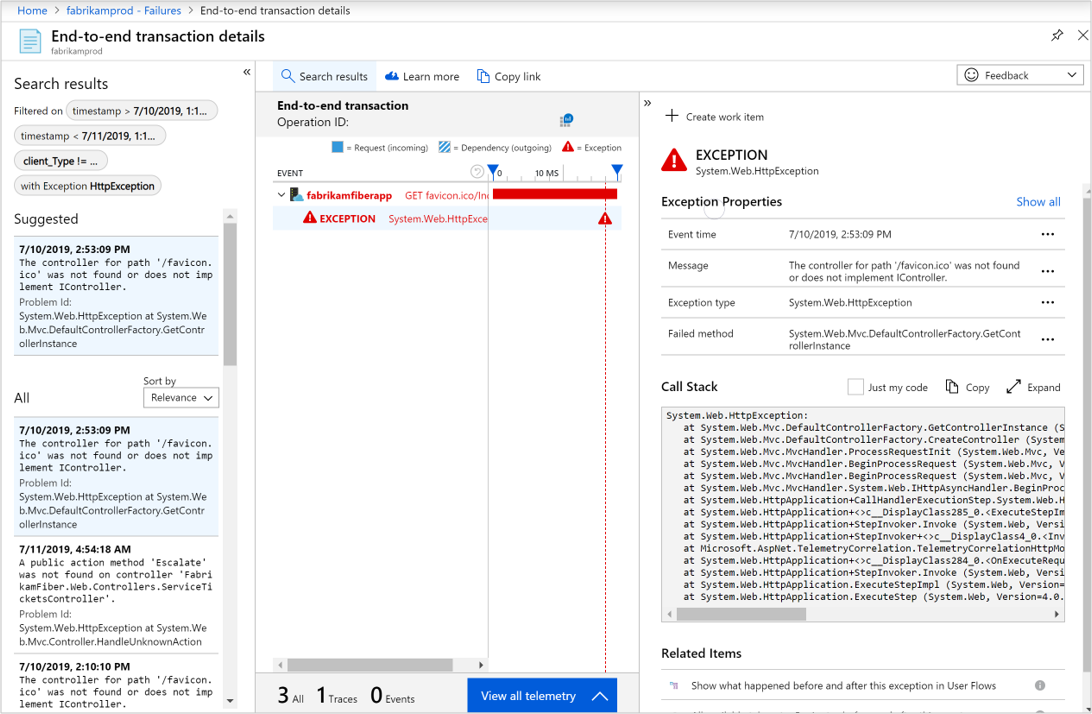
The following information in the End-to-end transaction details is useful for troubleshooting:
- The timestamp of the request
- The response code
- The response time
- Exception Message
- Exception Type
- Call Stack
Diagnose performance issues in Application Insights
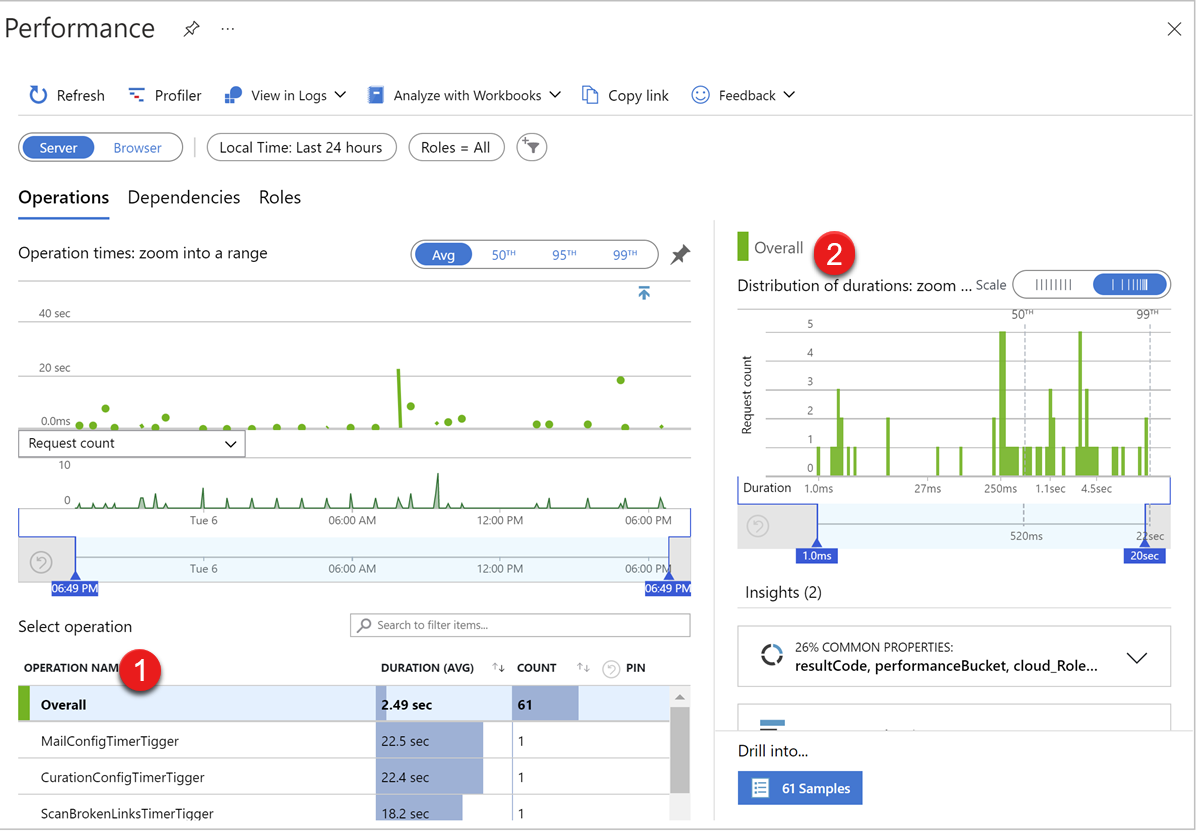
To diagnose performance issues for the web role, we can check the following data on the Performance page of the Application Insights instance:
- Web role requests response time
- CPU, Memory, Disk IO, Network IO of web role instance
In the Operations tab, the failed operations table1 shows the request operation name, duration, request count summary. Select an operation, and it will refresh the metrics chart2 to show the request volume and duration metrics chart.
The Roles tab shows the metrics data more related to the Cloud Service server, such as CPU, Available Memory, the requests handled by each instance, and so on.
Alert in Application Insights
The Alert allows users to set custom rules to monitor the cloud service role instance status. When the monitored event happens, users can get an email notification.
The rules mainly contain two important parts: conditions and actions. To create an alert, follow these steps:
In the Azure portal, go to the Application Insights instance and select Alert under the Monitoring section. On this page, you can see all triggered alerts. Expand + Create, and then select Alert rule.
Set up the conditions. The condition consists of three points: Signal, Dimension, and Alert Logic. For more information, see Types of Azure Monitor alerts.
- Signal is the type of metrics data that the alert rule will monitor. The common metrics data such as CPU, available memory, failed requests, exceptions, and response time can be used.
- Dimension specifies the scope or filter where this alert rule will be applied. For alert rules based on Cloud Service metrics data, they usually contain two possible dimension choices: Cloud role instance and Cloud role name. In addition to these two dimensions, there will also be some other choices depending on the signal.
- Alert logic is where you should set the logic of the alert rule condition. There are several important concepts:
- Threshold means whether the evaluation result is dynamic or static. If it's static, the evaluated metrics data (failed requests count in this example) will be compared to a static value, such as 5 or 10. If it's Dynamic, the evaluated data will be compared to the same data over the last short period, such as the last five minutes.
- Operator, Aggregation type, Threshold value, and Unit are easy to understand; they represent the main body of logic.
- Aggregation granularity, also called "period," is how long the metrics data in history will be evaluated. If it's five minutes, it means the metrics data of the last five minutes will be evaluated. Frequency of evaluation means how often the evaluation will be triggered.
Set the action when the Alert rule is triggered. You can either create a new action group and add it to this alert rule or use an existing action group.
To create a new action group, follow these steps:
- Select the subscription and resource group where the action group resource will be created and give a name and display name.
- Optional) Select how the user will be informed when the alert rule is triggered, such as sending an email to a specific email address.
- (Optional) Select what action it will take. We can trigger Automation Runbook, Azure Function, and five other service types in this option.
When the action group is created, it will also be added to the alert rule.
In the Details page, select the subscription and resource group in which to save the alert rule and set its name and severity level.
Metrics chart in Application Insights
The metrics chart in application insights can be used to visualize the data change. This is quite useful to monitor the status of the service over a time range, such as several days or weeks.
The data to be monitored can be configured by the following points:
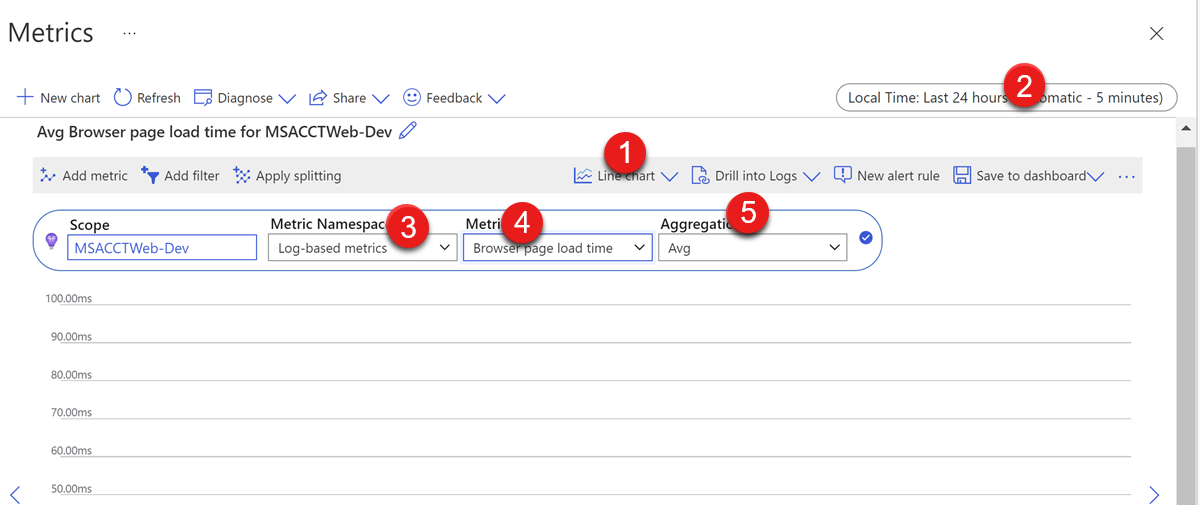
- Chart type - The type of chart you want to see. You can select Line chart, Area chart, Bar chart, Scatter chart, and Grid.
- Time range - The time range of the metrics data to generate the chart (Pay attention to the difference between local time and UTC).
- Metric Namespace - The group of possible metrics data. Normally, you only need to select between Log-based and Application Insights standard metrics. All data will be collected by default, such as CPU, Memory, requests, exceptions, and so on. Some more specific data collected by customized settings, such as the processor time of the w3wp process (which can be configured in the Diagnostic setting of Cloud Service), will be included in Log-based metrics.
- Metric - The data you want to generate a chart for.
- Aggregation - Type of statistic calculated from multiple metric values. For more details, please check this document. It's strongly recommended to keep this as the default value. You should only modify it when you understand how this metrics data type is collected and the difference among all aggregation types.
Tip
Sometimes, there will be dotted lines in the chart. It means that the data during that time range isn't accurate enough or is not collected. The reason is that the data during that period isn't continuing. Imagine that when the metrics data is collected every two minutes but the time difference between two points in the chart is one minute, the data won't be accurate enough to generate the chart, so it will be a dotted line.
Collected log in Application Insights
Almost all Application Insights features presented above are based on the data collected as a log. It's also possible for users to check these logs directly to get more detailed information that is not shown on the pages.
To view the logs, select Logs under the Monitoring section.
On the Logs page, you need to use Kusto Query Language (KQL) to query or filter the collected logs and get the needed information.
There are only two points that you need to pay attention to; the time range and the query.
The time range on the top side can set the time range of the logs we want to check. Please remember to pay attention to the difference between local time and UTC.
The query will be built in two parts: The table name in the first line and the condition we use to filter the results.
Here are the commonly used tables:
| Table in Application insights instance | Explanation |
|---|---|
| requests | Requests sent to Cloud service and recorded |
| exceptions | Unhandled exceptions and recorded handled exceptions |
| Performance Counters | performance data |
The data in the following tables are collected by a custom Diagnostic setting:
| Table in Application insights instance | Name in Diagnostic setting |
|---|---|
| traces | Application logs |
| traces | ETW logs |
| traces | Infrastructure logs |
| traces/custom events | Windows Event logs |
| Custom metrics | performance counters |