How to use PerfInsights
Note
CentOS referenced in this article is a Linux distribution and will reach End Of Life (EOL). Consider your use and plan accordingly. For more information, see CentOS End Of Life guidance.
PerfInsights Linux is a self-help diagnostics tool that collects and analyzes the diagnostic data, and provides a report to help troubleshoot Linux virtual machine performance problems in Azure. PerfInsights can be run on supported virtual machines as a standalone tool, or directly from the portal by using Performance Diagnostics for Azure virtual machines.
If you are experiencing performance problems with virtual machines, before contacting support, run this tool.
Supported troubleshooting scenarios
PerfInsights can collect and analyze several kinds of information. The following sections cover common scenarios.
Quick performance analysis
This scenario collects basic information such as storage and hardware configuration of your virtual machine, various logs, including:
Operating System information
PCI device information
General Guest OS logs
Configuration files
Storage information
Azure Virtual Machine Configuration (collected using Azure Instance Metadata Service
List of running processes, Disk, Memory, and CPU usage
Networking information
This is a passive collection of information that shouldn't affect the system.
Note
Quick performance analysis scenario is automatically included in each of the following scenarios:
Performance analysis
This scenario is similar to Quick performance analysis but allows capturing diagnostics information for longer duration.
HPC performance analysis
This scenario is meant for troubleshooting issues on HPC size VMs, meaning H-Series and N-Series. It checks a VMs configuration against what the Azure HPC Platform team has tested and recommends. It also collects logs and diagnostics related to the status and configuration of the special hardware that is available on those VMs, including:
GPU Driver information
GPU hardware diagnostics
InfiniBand driver information and configuration
InfiniBand device diagnostics
Network configuration files
Performance tuning information
Note
Some tools used by the HPC performance analysis scenario, such as cli commands that are packaged in with device drivers, are not present on all VMs. In such cases, those portions of the analysis will be skipped. Running this scenario does not install any software on VMs or make any other permanent changes.
Note
Running the HPC scenario directly from the Azure Portal is not supported at this time, so PerfInsights must be downloaded and run from the command line to use it.
What kind of information is collected by PerfInsights
Information about the Linux virtual machine, operating system, block devices, high resource consumers, configuration, and various logs are collected. Here are more details:
Operating system
- Linux distribution and version
- Kernel information
- Driver information
- Azure HPC Driver VM Extension logs
* - SELinux configuration
*
Hardware
- PCI devices [
*] - Output of lscpu
* - System Management BIOS table dump
*
- PCI devices [
Processes and memory
- List of processes (task name, memory used, files opened)
- Total, available, and free physical memory
- Total, available, and free swap memory
- Profiling capture of CPU and processes CPU usage at 5-second interval
- Profiling capture of processes memory usage at 5-second interval
- User-limits for memory access
* - NUMA configuration
*
GPU
- Nvidia SMI output
* - Nvidia DCGM Diagnostics
* - Nvidia debug dump
*
- Nvidia SMI output
Networking
- List of network adapters with adapters statistics
- Network routing table
- Opened ports and status
- InfiniBand Partition Keys
* - Output of ibstat
*
Storage
- Block devices list
- Partitions list
- Mount points list
- MDADM volume information
- LVM volume information
- Profiling capture on all disks at 5-second interval
Logs
- /var/log/messages
- /var/log/syslog
- /var/log/kern.log
- /var/log/cron.log
- /var/log/boot.log
- /var/log/yum.log
- /var/log/dpkg.log
- /var/log/sysstat or /var/log/sa [
**] - /var/log/cloud-init.log
- /var/log/cloud-init-output.log
- /var/log/gpu-manager.log
- /var/log/waagent.log
- /var/log/azure/[extension folder]/*log*
- /var/opt/microsoft/omsconfig/omsconfig.log
- /var/opt/microsoft/omsagent/log/omsagent.log
- /etc/waagent.config
- Output of journalctl for the last five days
* Only in HPC scenario
Performance diagnostics trace
Runs a rule-based engine in the background to collect data and diagnose ongoing performance issues. Rules are displayed in the report under the Category -> Finding tab.
Each rule consists of the following:
- Finding: Description of the finding.
- Recommendation: Recommendation on what action could be taken for the finding. There are also reference link(s) to documentation that provide more information on the finding and/or recommendation.
- Impact Level: Represents the potential for having an impact on performance.
The following categories of rules are currently supported:
High resource usage:
- High CPU usage: Detects high CPU usage periods, and shows the top CPU usage consumers during those periods.
- High memory usage: Detects high memory usage periods, and shows the top memory usage consumers during those periods.
- High disk usage: Detects high disk usage periods on physical disks, and shows the top disk usage consumers during those periods.
Storage: Detects specific storage configurations.
Memory: Detects specific memory configurations.
GPU: Detects specific GPU configurations.
Network: Detects specific network settings.
System: Detects specific system settings.
Note
[*] PCI information is not yet collected on Debian and SLES distributions.
[**] /var/log/sysstat or /var/log/sa contains the System Activity Report (SAR) files that are collected by the sysstat package. If the sysstat package is not installed on the VM, the PerfInsights tool provides a recommendation to install it.
Run the PerfInsights Linux on your VM
What do I have to know before I run the tool
Tool requirements
This tool must be run on the VM that has the performance issue.
Python 3.6 or a later version, must be installed on the VM.
Note
Python 2 is no longer supported by the Python Software Foundation (PSF). If Python 2.7 is installed on the VM, PerfInsights can be installed. However, no changes or bug fixes will be made in PerfInsights to support Python 2.7. For more information, see Sunsetting Python 2.
The following distributions are currently supported:
Note
Microsoft has only tested the versions that are listed in the table. If a version isn't listed in the table, then it isn't explicitly tested by Microsoft, but the version might still work.
Distribution Version Oracle Linux Server 6.10 [ *], 7.3, 7.5, 7.6, 7.7, 7.8, 7.9CentOS 6.5 [ *], 7.6, 7.7, 7.8, 7.9RHEL 7.2, 7.5, 8.0 [ *], 8.1, 8.2, 8.6, 8.8Ubuntu 14.04, 16.04, 18.04, 20.04, 22.04 Debian 8, 9, 10, 11 [ *]SLES 12 SP4 [ *], 12 SP5 [*], 15 [*], 15 SP1 [*], 15 SP2 [*], 15 SP4 [*]AlmaLinux 8.4, 8.5 Azure Linux 2.0
Note
[*] Please refer to Known issues section
Note
[*] The HPC scenario relies on the HPCDiag tool, so check its support matrix for supported VM sizes and OSes. In particular, NDv4 size VMs aren't yet supported and reports for those VMs may show extraneous findings.
Known issues
RHEL 8 does not have Python installed by default. To run PerfInsights Linux, you must first install Python 3.6 or a later version.
Guest Agent information collection may fail on CentOS 6.x.
PCI devices information is not collected on Debian based distributions.
LVM information is partially collected on some distributions.
How do I run PerfInsights
You can run PerfInsights on a virtual machine by installing Azure Performance Diagnostics from Azure portal. You can also run it as a standalone tool.
Note
PerfInsights simply collects and analyzes the data. It does not make any modifications to the system.
Install and run PerfInsights from the Azure portal
For more information about this option, see Azure Performance Diagnostics.
Run PerfInsights in standalone mode
To run the PerfInsights tool, follow these steps:
Download PerfInsights.tar.gz to a folder on your virtual machine and extract the contents using the below commands from the terminal.
wget https://download.microsoft.com/download/9/F/8/9F80419C-D60D-45F1-8A98-718855F25722/PerfInsights.tar.gztar xzvf PerfInsights.tar.gzNavigate to the folder that contains
perfinsights.pyfile, and then runperfinsights.pyto view the available commandline parameters.cd <the path of PerfInsights folder> sudo python perfinsights.py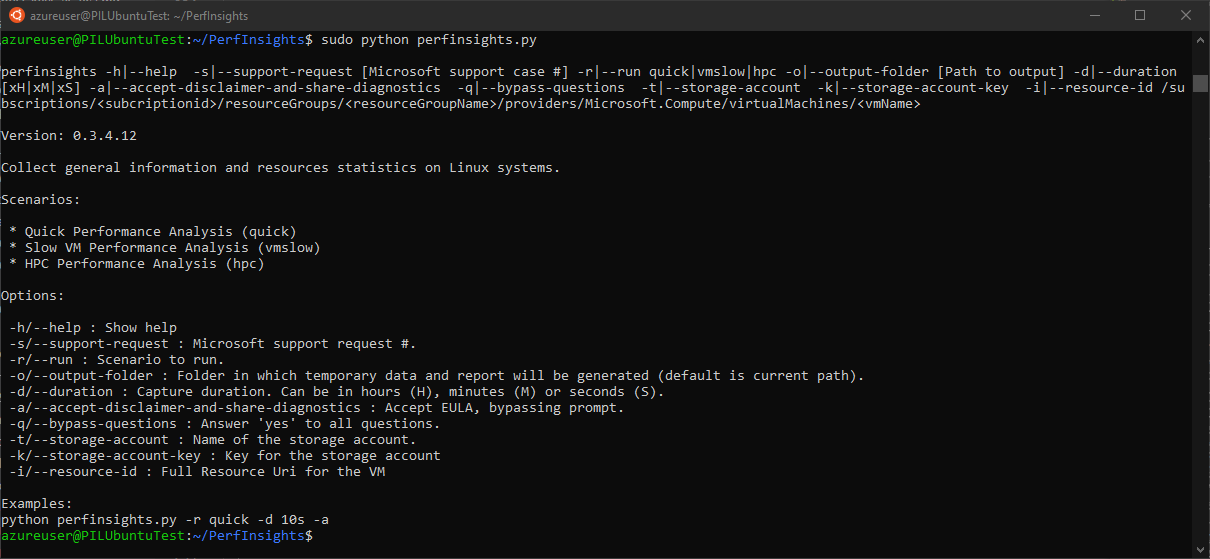
The basic syntax for running PerfInsights scenarios is:
sudo python perfinsights.py -r <ScenarioName> -d [duration]<H | M | S> [AdditionalOptions]You can use the below example to run Quick performance analysis scenario for 1 minute and create the results under /tmp/output folder:
sudo python perfinsights.py -r quick -d 1M -a -o /tmp/outputYou can use the below example to run performance analysis scenario for 5 mins and upload the result (stores in a TAR file) to the storage account:
sudo python perfinsights.py -r vmslow -d 300S -a -t <StorageAccountName> -k <StorageAccountKey> -i <full resource Uri of the current VM>You can use the below example to run the HPC performance analysis scenario for 1 mins and upload the result TAR file to the storage account:
sudo python perfinsights.py -r hpc -d 60S -a -t <StorageAccountName> -k <StorageAccountKey> -i <full resource Uri of the current VM>Note
Before running a scenario, PerfInsights prompts the user to agree to share diagnostic information and to agree to the EULA. Use -a or --accept-disclaimer-and-share-diagnostics option to skip these prompts.
If you have an active support ticket with Microsoft and running PerfInsights per the request of the support engineer you are working with, make sure to provide the support ticket number using the -s or --support-request option.
When the run is completed, a new tar file appears in the same folder as PerfInsights unless no output folder is specified. The name of the file is PerformanceDiagnostics_yyyy-MM-dd_hh-mm-ss-fff.tar.gz. You can send this file to the support agent for analysis or open the report inside the file to review findings and recommendations.
Review the diagnostics report
Within the PerformanceDiagnostics_yyyy-MM-dd_hh-mm-ss-fff.tar.gz file, you can find an HTML report that details the findings of PerfInsights. To review the report, expand the PerformanceDiagnostics_yyyy-MM-dd_hh-mm-ss-fff.tar.gz file, and then open the PerfInsights Report.html file.
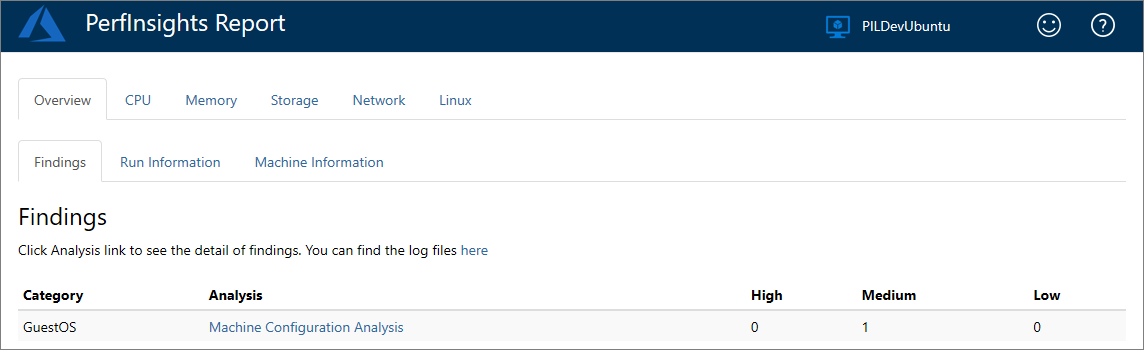
Overview tab
The Overview tab provides basic run details and virtual machine information. The Findings tab displays a summary of the recommendations from all the different sections of the PerfInsights report.
Note
Findings categorized as high are known issues that might cause performance issues. Findings categorized as medium represent non-optimal configurations that do not necessarily cause performance issues. Findings categorized as low are informative statements only.
Review the recommendations and links for all high and medium findings. Learn about how they can affect performance, and also about best practices for performance-optimized configurations.
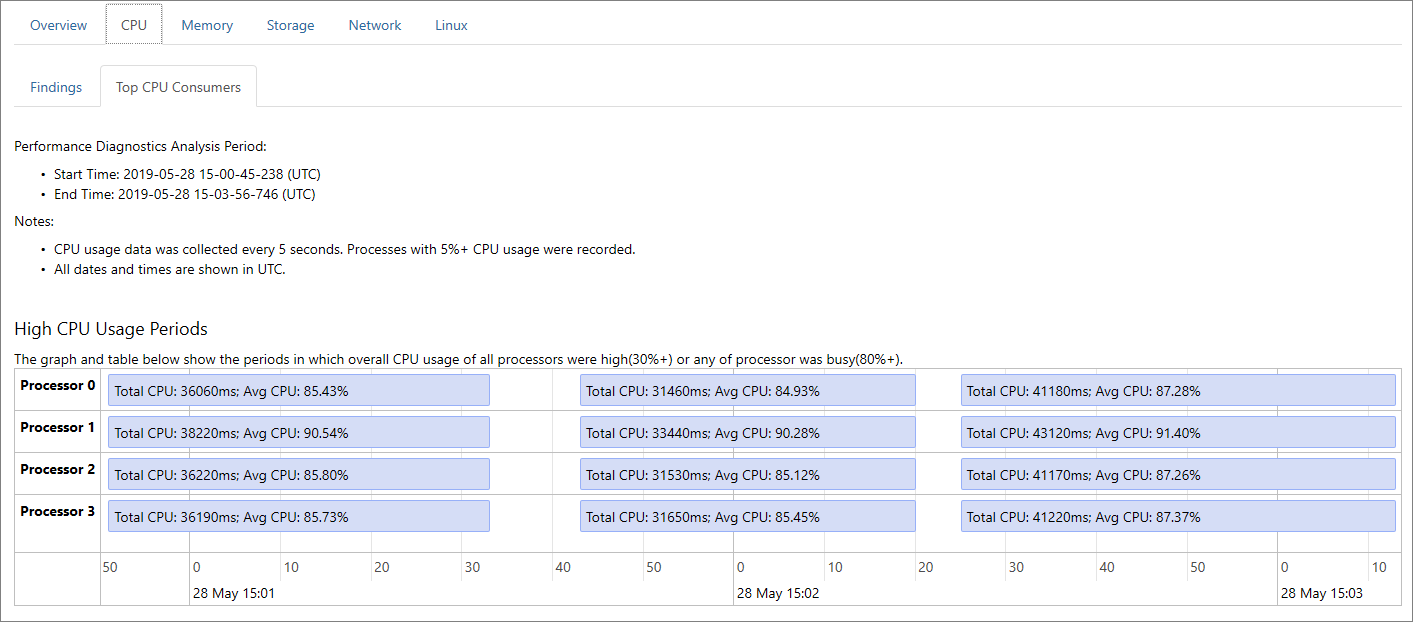
CPU tab
CPU tab provides information about system-wide CPU consumption during the PerfInsights run. Information about high CPU usage periods and top long running CPU consumers will be helpful to troubleshoot high CPU-related issues.
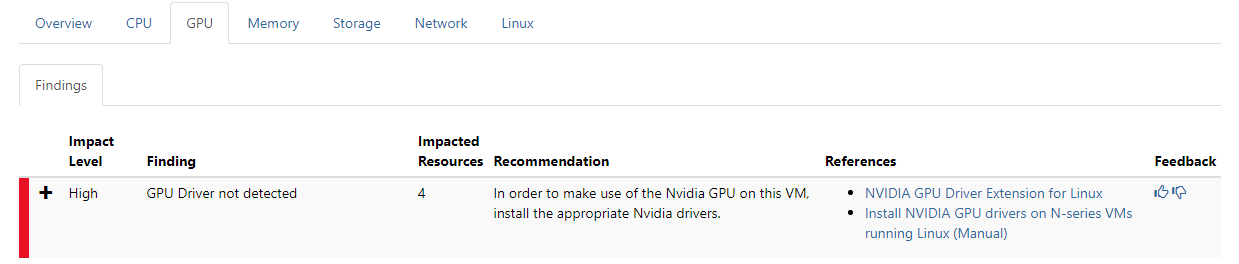
GPU tab
GPU tab provides information about findings that will be helpful in troubleshooting GPU-related issues.
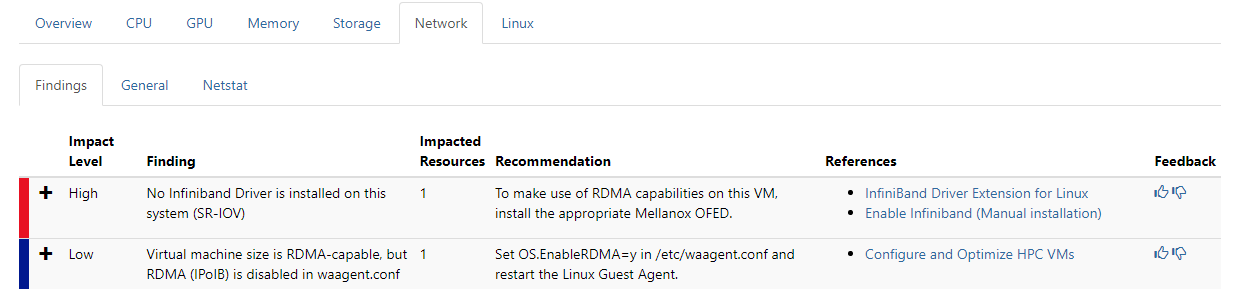
Network tab
Network tab provides information about network configuration and status. Information about network-related findings, including InfiniBand issues in the HPC scenario, can be found here.
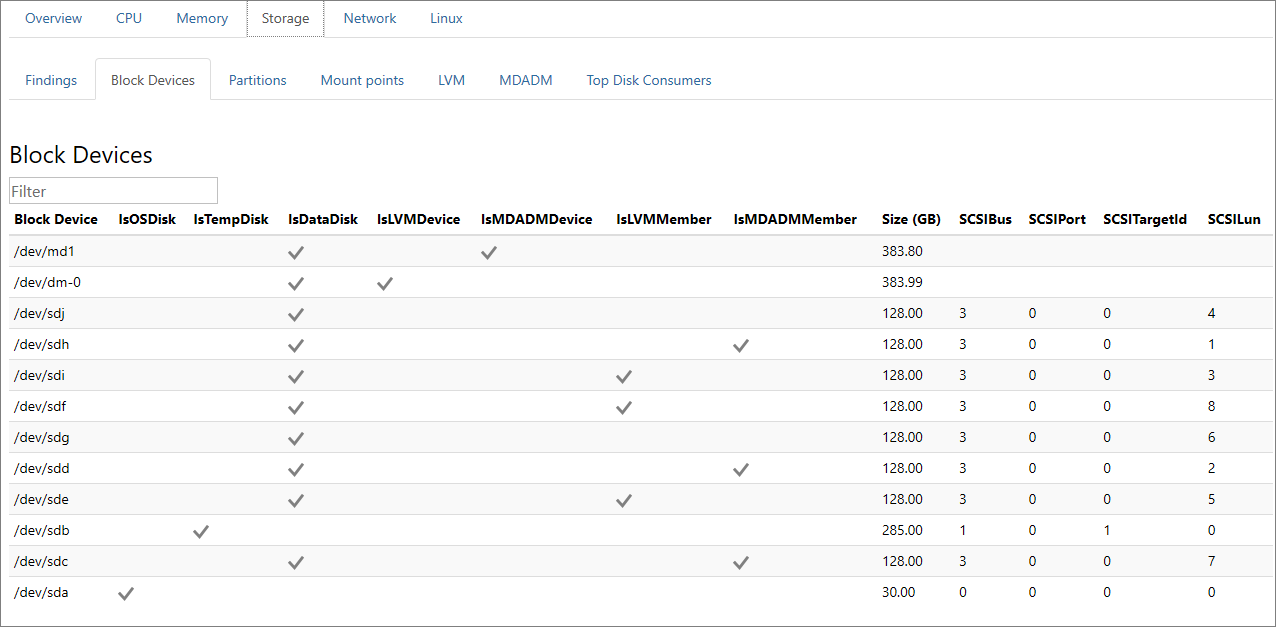
Storage tab
The Findings section displays various findings and recommendations related to storage.
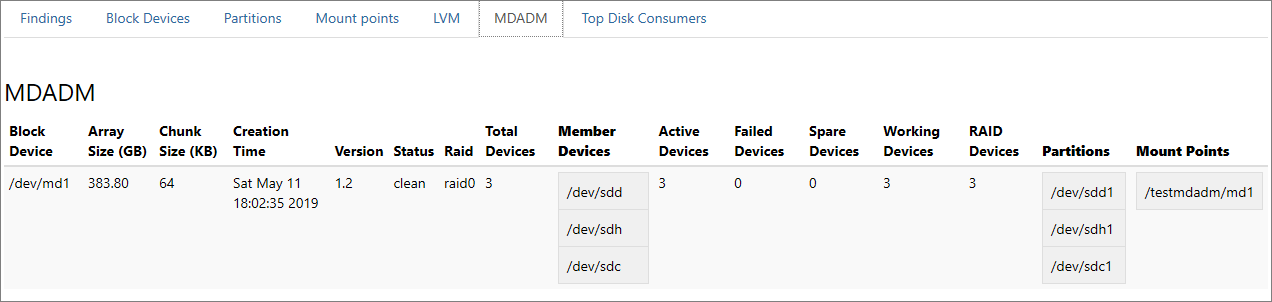
The Block Devices and other related sections such as Partitions, LVM, and MDADM tabs describe how block devices are configured and related to each other.
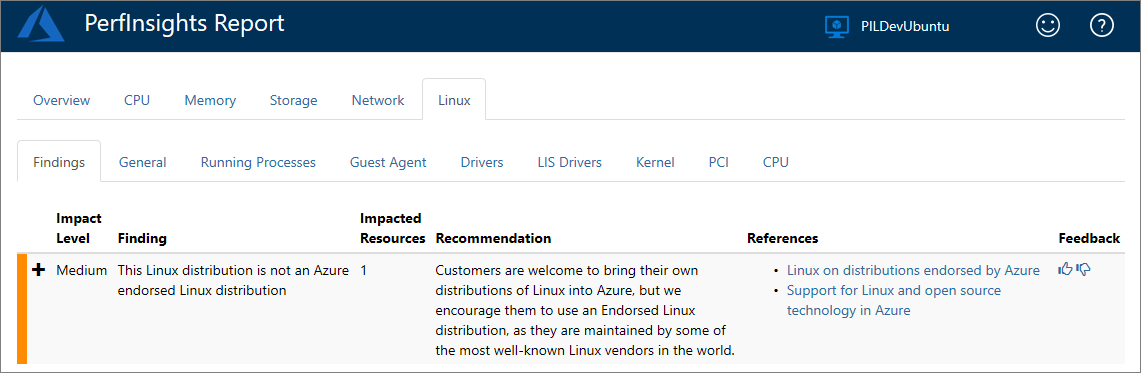
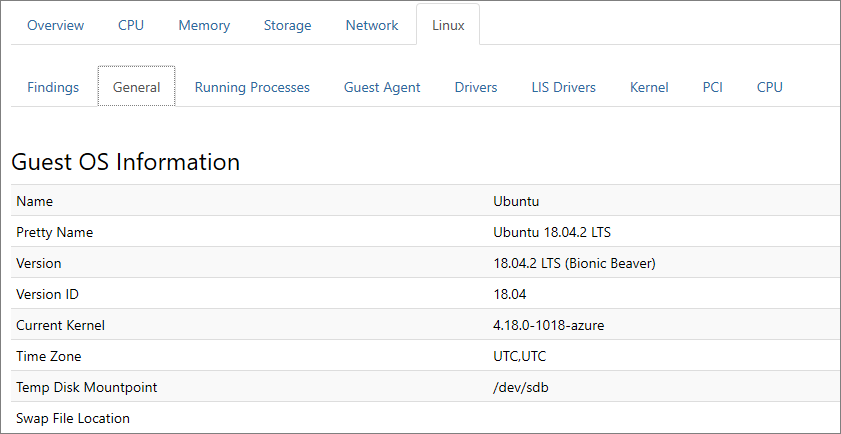
Linux tab
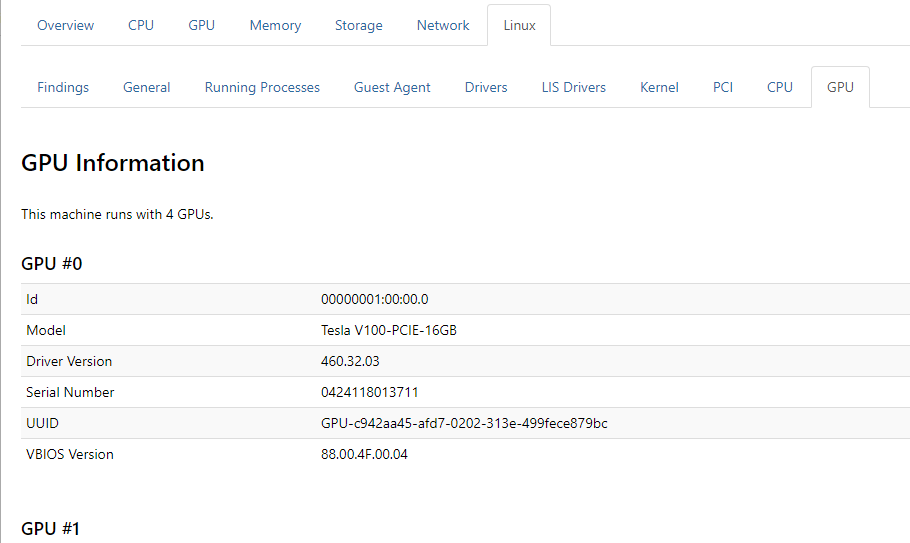
The Linux tab contains information on the hardware and the operating system running in your VM. Details include a list of running processes and information about Guest Agent, PCI, CPU, GPU, Drivers, and LIS drivers.
Or on a GPU-enabled VM:
Next steps
You can upload diagnostics logs and reports to Microsoft Support for further review. When you work with the Microsoft Support staff, they might request that you transmit the output that is generated by PerfInsights to assist with the troubleshooting process.
The following screenshot shows a message similar to what you might receive:
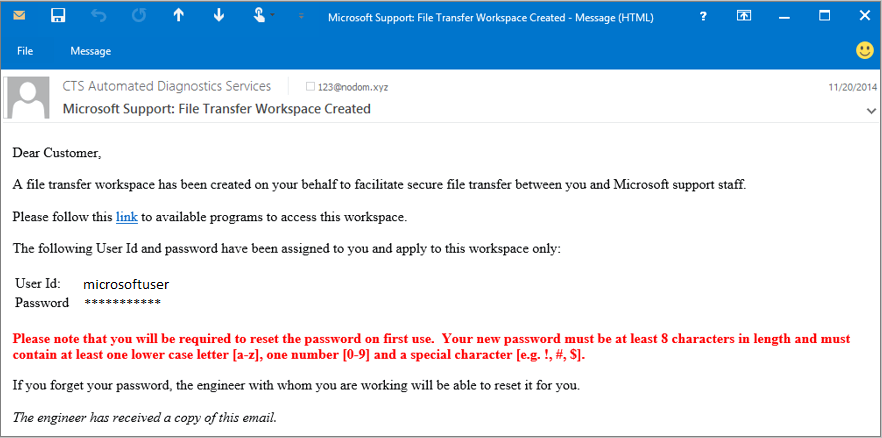
Follow the instructions in the message to access the file transfer workspace. For additional security, you have to change your password on first use.
After you sign in, you will find a dialog box to upload the PerformanceDiagnostics_yyyy-MM-dd_hh-mm-ss-fff.tar.gz file that was collected by PerfInsights.
Contact us for help
If you have questions or need help, create a support request, or ask Azure community support. You can also submit product feedback to Azure feedback community.
Feedback
Coming soon: Throughout 2024 we will be phasing out GitHub Issues as the feedback mechanism for content and replacing it with a new feedback system. For more information see: https://aka.ms/ContentUserFeedback.
Submit and view feedback for