Note
Access to this page requires authorization. You can try signing in or changing directories.
Access to this page requires authorization. You can try changing directories.
Applies to: Internet Information Services
This article describes the troubleshooting steps to identify performance issues by using Microsoft LogParser to analyze Internet Information Services (IIS) logs.
Tools and knowledge used in this Troubleshooter
- Microsoft LogParser
- Command Prompt
- Basic knowledge of IIS HTTP Status Codes
- Basic knowledge of SQL queries
Overview
This article helps you analyze IIS log files in an effort to determine the cause when an application that is hosted on IIS is failing or experiencing performance issues. Before you start, it's important to note that all the fields IIS can log aren't enabled by default. For example, Bytes Sent and Bytes Received aren't enabled by default, but they're very useful when troubleshooting a performance problem. Therefore, the best time to include these additional fields is before you're experiencing system problems. So, make sure that you have enabled these additional fields. They'll help you find solutions when problems happen. For more information about how to enable these fields, see Modifying IIS 7 log data in Windows 2008.
Scenario
As a system administrator you begin to hear reports from users of your system hosted on IIS that the responses are slow. Some of them mention that Web browsers simply time out or stop responding completely when they're accessing your website.
You jump into action and recycle the worker process. All appears to be working again, as normal.
However, you can't accept that as a solution and need to know why it happened, but don't know where to start. You have no details from the users, such as error codes, screenshots and worse, you have no performance data to compare what just happened to normal performance. In many cases, other new issues take you away from any serious root cause analysis.
Microsoft LogParser is a good tool that is quick and easy to use. In many situations, the tool helps you quickly get to a deeper understanding of what happened on the server and may help you identify problems. You can take the information you gather with LogParser and pass it along to your database team, your network team or to your developers for more analysis.
Data collection
By default, IIS log files are located in the following directories:
- IIS 7 and later: %SystemDrive%\inetpub\logs\LogFiles
- IIS 6 and earlier: %WinDir%\System32\LogFiles
In this troubleshooter, I'll be using IIS 8. Open IIS Manager and select Sites, as shown in Figure 1. This shows you the ID of each website hosted on your server. You need this ID to determine which W3SVC* directory to analyze.
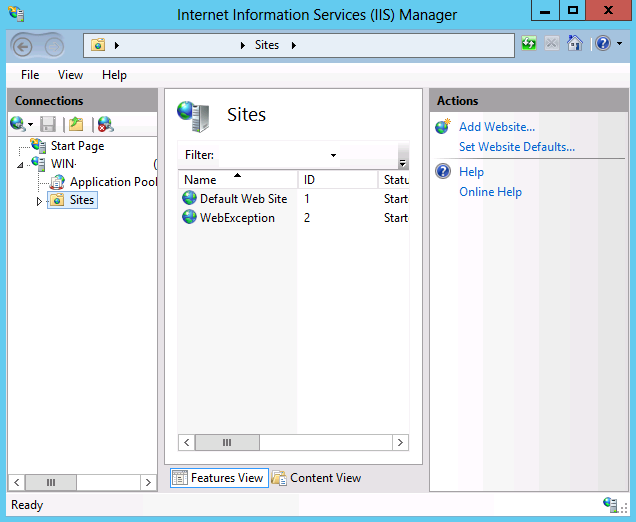
Figure 1: Getting the ID of your website
Open Windows Explorer and navigate to the directory that contains the IIS log files of the website that experienced the performance problem. Figure 2 shows how that might look like.
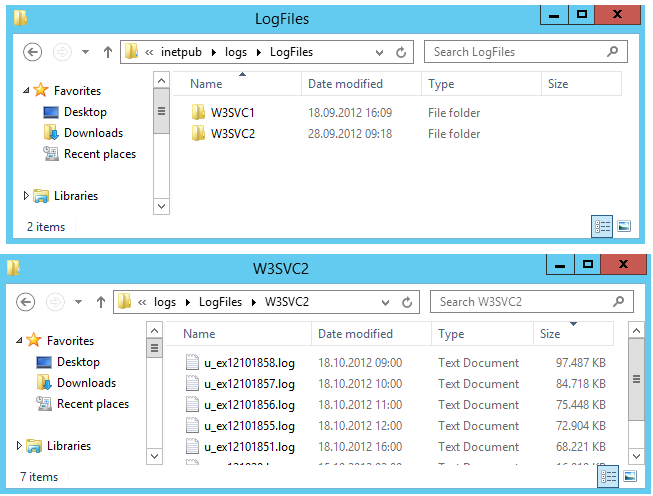
Figure 2: IIS Log file location
IIS log files can be quite large; for example, in Figure 2, the log file u_ex12101858.log is nearly 100MB in size. Because these log files may be huge and contain hundreds of thousands of individual log file entries, manually looking through each of these files for an error isn't a good approach, and returns few results for the time that you invest.
This is when LogParser becomes an indispensable tool in your troubleshooting arsenal.
Data analysis
Your first step is to determine which log files may contain errors. For example, if customers were complaining about performance on the 3rd of June, 2012, the log file might be u_ex120603.log, where:
12is the abbreviated year for 201206refers to the sixth month (June)03is the third day of the month
Note: The above example assumes that IIS logging is configured to rotate log files on a daily basis, which is the default. If you have changed the settings for IIS to rotate log files on a different time interval, such as weekly or hourly, then the log files names would be different. For more information about the syntax for IIS log file names, see IIS Log File Formats.
Note
By default, the date and time in IIS logs are stored using GMT; you'll need to take this into account when you're determining which logs contain errors. That being said, you can adjust the dates/times by using LogParser's TO_LOCALTIME() function, as illustrated in the following example:
logparser.exe "SELECT TO_STRING(TO_LOCALTIME(TO_TIMESTAMP(date,time)),'yyyy-MM-dd hh:mm:ss') AS LocalTime, COUNT(*) AS Hits FROM *.log WHERE date='2012-10-18' GROUP BY LocalTime ORDER BY LocalTime" -i:w3c
Once you have identified the IIS log files that contain errors, you should copy them to a location where they can be analyzed. This step is optional, but it isn't recommended that you analyze your logs on your IIS server since your LogParser queries may take a long time to run, and if your log files are large then Log Parser may compete for system resources.
For example, you might copy your IIS logs to a folder on your personal computer where you have already copied the LogParser files, which is how I typically analyze my log files. Figure 3 shows an example of where I stored them to create this article.
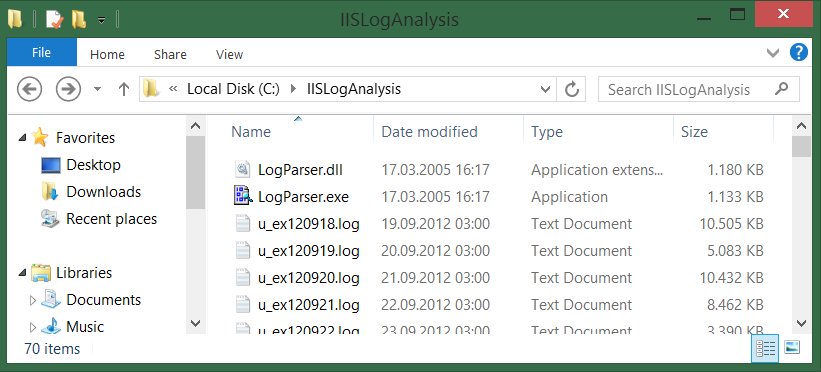
Figure 3: IIS Logs files locally hosted for analysis using LogParser
After you have downloaded LogParser, you're ready to begin the analysis. The first query I run is shown in Figure 4. The results give you an overview of how IIS has been responding to the requests.
logparser.exe "SELECT sc-status, sc-substatus, COUNT(*) FROM *.log GROUP BY sc-status, sc-substatus ORDER BY sc-status" -i:w3c
sc-status sc-substatus COUNT(ALL *)
--------- ------------ ------------
200       0            3920658
206       0            2096
301       0            1031
302       0            65386
304       0            178705
400       0            35
401       2            692096
404       0            2935
404       11           7
405       0            1
406       0            36
500       0            11418

Statistics:
-----------
Elements processed: 4189228
Elements output:    12
Execution time:     7.70 seconds
Figure 4: LogParser Query (sc-status and sc-substatus)
The points of interest within the results are:
- The ratio between 200 and 304 HTTP status codes (successful requests)
- The number of 500 HTTP status codes (failed requests)
The significance for each of these status codes is explained below.
The ratio between HTTP 200 and 304 status codes (analyzing successful requests)
The ratio between the 200 and 304 HTTP status codes is important because it shows how many requests are being retrieved from the clients' cache instead of directly from the server. The results in Figure 4 show that there are 3,920,658 requests which resulted in an HTTP Status code of 200. This means that the requested file was served from the server each time. In contrast, there were 178,705 requests which resulted in a 304 HTTP status code. This means that the requested file was retrieved from the local cache. In other words, 95.5% of the requests are being handled from the server.
Caching can have some very positive impact on your system's performance; see the details for both static and dynamic compression in the Configuring HTTP Compression in IIS 7 article.
HTTP 500 status codes (analyzing failed requests)
HTTP 500 Status codes may indicate serious issues on your system. The level of impact that the root cause of an HTTP 500 error may have on your system can range from nothing to the crash of a worker process. Therefore, when you see these, you should execute the query shown in Figure 5 in order to find which requests resulted in a 500 HTTP Status code.
logparser.exe "SELECT cs-uri-stem, COUNT(*) FROM *.log WHERE sc-status=500 GROUP BY cs-uri-stem ORDER BY COUNT(*) DESC" -i:w3c
cs-uri-stem                 COUNT(ALL *)
--------------------------- ------------
/ShoppingCart/ViewCart.aspx 1378
/DataService.asmx           1377
/Start/default.aspx         949
/GetDetailsView.aspx        753
/Details/ImageUrls.asmx     722

Statistics:
-----------
Elements processed: 4189228
Elements output:    5
Execution time:     24.89 seconds
Figure 5: LogParser Query (cs-uri-stem with a 500 sc-status)
These results show the path and the name of the file which, when requested, responded with an HTTP 500 Status code. This kind of information would be valuable to the development team. For example, the development team could look further into that specific code and search for code that executes without being contained in a try {...} catch {...} code block, or they are executing large data queries which need to be optimized.
Let's take this example a step further and focus on the top contributor for HTTP 500 Status codes. It would be interesting to know when these errors occurred, because this information can be used to check if dependencies were having any problems at the same time.
logparser.exe "SELECT TO_STRING(TO_TIMESTAMP(date,time),'yyyy-MM-dd hh') AS Hour, COUNT(*) FROM *.log WHERE sc-status=500 AND cs-uri-stem='/Start/default.aspx' AND date='2012-10-18' GROUP BY Hour ORDER BY Hour" -i:w3c
Hour          COUNT(ALL *)
------------- ------------
2012-10-18 08 191
2012-10-18 09 163
2012-10-18 14 150

Statistics:
-----------
Elements processed: 4189228
Elements output:    3
Execution time:     6.36 seconds
Figure 6: LogParser Query (cs-uri-stem with a 500 sc-status)
The subset of results in Figure 6 restricts the date range of the issue. This information can be passed along to network, database, operating system administrators and the development teams to check if anything else was happening at that same time. For example: Were there any additional problems between 08:00 and 09:59:59 GMT and between 14:00:00 and 14:59:59 GMT?
The next set of LogParser queries utilize the following fields, which may give better insight into performance problems:
| Field | Description | Enabled by default |
|---|---|---|
time-taken |
The length of time the action took, in milliseconds | Yes |
sc-bytes |
The number of bytes sent by the server | No |
cs-bytes |
The number of bytes the server received | No |
As mentioned before, take the time now to request the sc-bytes and cs-bytes fields be enabled or, if possible, enable them yourself. They provide some valuable insight into your system and its' behavior. Take Figure 7, for example. You see that the average time is pretty good at a few hundred milliseconds. However, look at the maximum time-taken, that is way too much time.
logparser.exe "SELECT cs-method, COUNT(*) AS TotalCount, MAX(time-taken) AS MaximumTime, AVG(time-taken) AS AverageTime FROM *.log GROUP BY cs-method ORDER BY TotalCount DESC" -i:w3c
cs-method TotalCount MaximumTime AverageTime
--------- ---------- ----------- -----------
GET       3172034    1366976     153
POST      1011765    256539      359
HEAD      5363       26750       209

Statistics:
-----------
Elements processed: 4189228
Elements output:    3
Execution time:     6.36 seconds
Figure 7: LogParser Query (MAX and AVG time-taken)
I know you're asking yourself already the next question that needs to be answered. Which request is taking so much time? Figure 8 shows the answer to that question. As you will notice, I have gone ahead and included the sc-bytes field in the LogParser query. Remember, sc-bytes represents the size of the file sent from the server back to the client.
logparser.exe "SELECT cs-uri-stem, time-taken, sc-bytes FROM *.log WHERE time-taken > 250000 ORDER BY time-taken DESC" -i:w3c
cs-uri-stem                 time-taken sc-bytes
--------------------------- ---------- --------
/ShoppingCart/ViewCart.aspx 1366976    256328
/DataService.asmx           1265383    53860
/Start/default.aspx         262796     8077
/GetDetailsView.aspx        261305     5038
/Details/ImageUrls.asmx     256539     2351

Statistics:
-----------
Elements processed: 4189228
Elements output:    5
Execution time:     8.98 seconds
Figure 8: LogParser Query (MAX and AVG time-taken)
We would likely all agree that the time-taken for the requests exceeds a normal response time. However, the size of the files is something which the administrator or developer would need to analyze to determine if the sizes are within an acceptable range.
The conclusion is that the GetDetailsView.aspx file has been throwing a number of 500 HTTP Status codes and has at some point taken a long time to complete, even though it was a relatively small file. You may want to look at the date and time when problems where occurring for this file, and examine the code in the file with any issues that occurred. (For example, the IIS logs contain a list of variables that were passed in the query string; you could check those values for bad data.)
The examples provided in figures 4 - 8 help gain an understanding around where the root cause of an issue may exist. It's likely, however, that this analysis has only rendered a better view of the situation which will lead to more questions and deeper analysis. If that's the case you may want to create a representation of this data in a more presentable manner. The following section covers this in detail.
Reporting
Screenshots of a command window containing LogParser queries and their results may be fine during the analysis phase of a performance problem; however, if you need to go in front of managers or directors to explain what happened, it may not meet the mark.
Note
In order to get charting to work via LogParser, you'll need to install the Office Web Components. The following articles explain how to do this:
Figure 9 shows the LogParser query to create a 3D pie chart containing the number of requests and their associated HTTP Status code. I removed status 200, as those are successful. What I am after here are the requests which are something other than OK.
logparser.exe "SELECT sc-status AS Status, COUNT(*) AS Count INTO status.gif FROM *.log WHERE sc-status > 200 GROUP BY Status ORDER BY Status" -i:w3c -o:CHART -chartType:PieExploded3D -ChartTitle:"Request Status"
Statistics:
-----------
Elements processed: 4189228
Elements output:    10
Execution time:     6.20 seconds
Figure 9: LogParser Query (Create a 3D pie chart)
The result of the query is illustrated in Figure 10. There are many additional parameters which you can pass to LogParser that affect the image. For example, legend, groupSize, config, etc. To get a complete list enter: LogParser -h -o:CHART for a list of all parameters. This command will also provide a list of the different chart types.
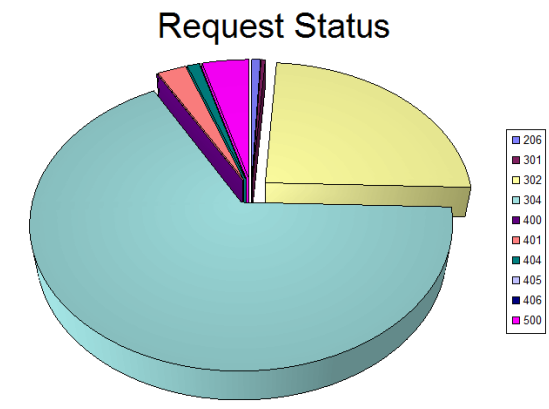
Figure 10: LogParser 3D pie chart
Another useful chart is the ratio between cached and actual requests. Recall from the Data Analysis section where I discussed that an HTTP Status code of 200 means that the requested files are retrieved from the server however, a 304 is retrieved from the client. Figure 11 shows the LogParser query for the creation of this chart. Notice that I used the -values parameter.
logparser.exe "SELECT sc-status AS Status, COUNT(*) AS Count INTO cache.gif FROM *.log WHERE sc-status=200 OR sc-status=304 GROUP BY Status ORDER BY Status" -i:w3c -o:CHART -chartType:PieExploded3D -ChartTitle:"Cache" -values:ON
Statistics:
-----------
Elements processed: 4189228
Elements output:    2
Execution time:     6.35 seconds
Figure 11: LogParser Query (Create a 3D pie chart)
Although the difference between HTTP Status code 200 and 304 are clearly visible, I thought it may add some value to include the number of hits for each. Figure 12 illustrates the output of the previous LogParser query.
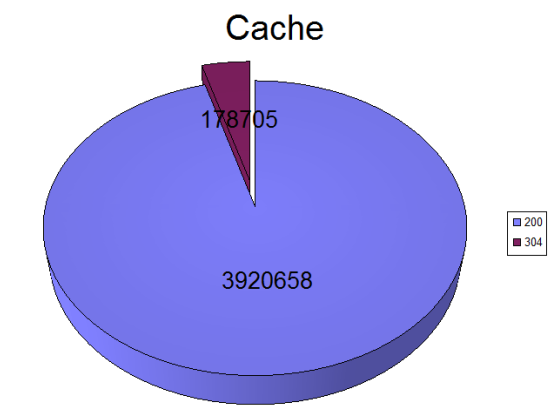
Figure 12: LogParser 3D pie chart
I think you're getting the picture now about how charting the IIS Logs using LogParser can help convey what is happening much better than a table of data. But before I stop, I want to show you one more example using the Column chart type. The LogParser query shown in Figure 13 produces a 3D Column chart showing the count of 500 HTTPS Status codes per hour.
logparser.exe "SELECT to_string(to_timestamp(date, time), 'yyyy-MM-dd hh') AS Hour, COUNT(*) AS Count INTO 500.gif FROM *.log WHERE sc-status=500 GROUP BY Hour ORDER BY Hour" -i:w3c -o:CHART -chartType:Column3D -ChartTitle:"500 Errors by Hour"
Statistics:
-----------
Elements processed: 4189228
Elements output:    13
Execution time:     6.32 seconds
Figure 13: LogParser Query (Create a 3D column chart)
The resulting chart is illustrated in Figure 14.
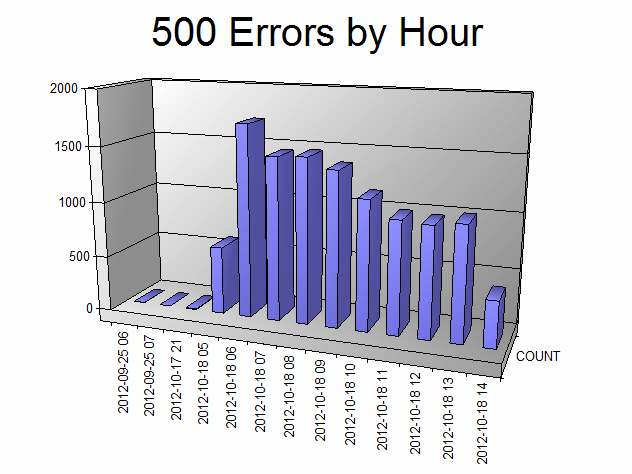
Figure 14: LogParser 3D column chart
Creating charts using Excel and CSV
At the beginning of this section I mentioned that the installation of the Office Web Component (OWC) is a requirement if you want to use the LogParser charting capabilities. In your organization, there may be restrictions that prohibit this or you simply might not want to install it. If either is the case, then consider exporting the LogParser query result to a CSV file and import it into Excel.
Figure 15 shows the LogParser query that extracts the HTTP Status codes for all request which aren't 200 to a CSV file.
logparser.exe "SELECT sc-status AS Status, COUNT(*) AS Count INTO status.csv FROM *.log WHERE sc-status > 200 GROUP BY Status ORDER BY Status" -i:w3c -o:csv
Statistics:
-----------
Elements processed: 4189228
Elements output:    10
Execution time:     6.20 seconds
Figure 15: LogParser Query (Create a CSV file for import into Excel)
Notice in Figure 15 that I used the -o parameter so that LogParser creates the output in CSV format.
To import the CSV file into Excel so that a chart can be created from it, open Excel, navigate to the DATA tab and select From Text. Figure 16 shows what this looks like.
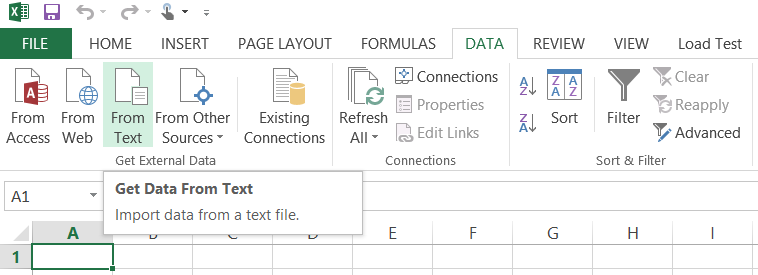
Figure 16: Import CSV file created by LogParser into Excel
Select the status.csv file created by the LogParser query and navigate through the import wizard. Import the comma-delimited CSV file and you'll end up with the Status in column A and the number of occurrences for each status in column B. This assumes you executed the LogParser query shown in Figure 15. Lastly, select all the data from column A and B, including the headers and choose the type of Pie chart to create. Figure 17, illustrates how this may look.
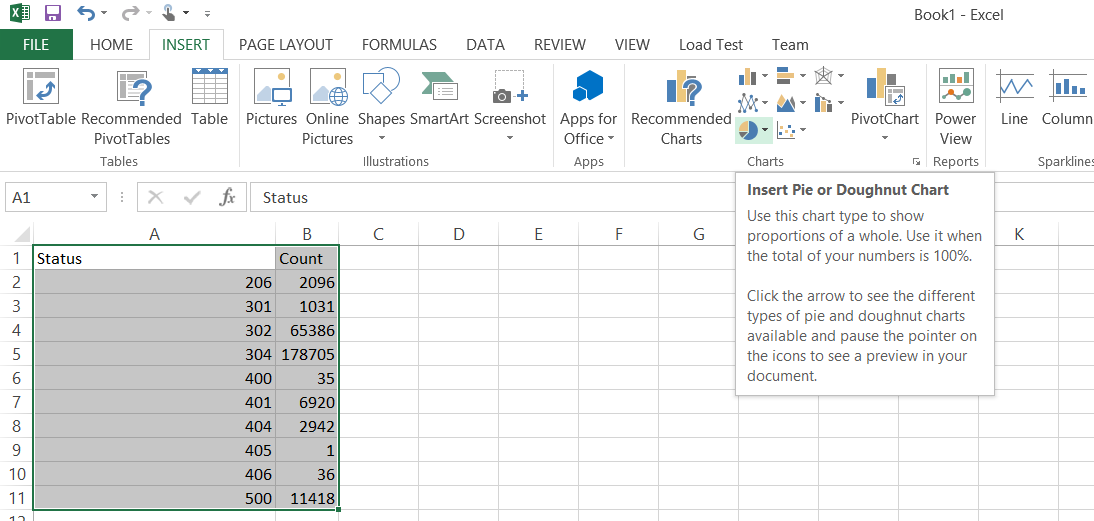
Figure 17: Create a Pie chart using a CSV file
The end result is a Pie chart, Figure 18 that is similar to that shown previously in Figure 10. There are many options in regards to color, chart type, labels, etc. With a select of a button you can change the chart type from Pie to Bar or to Line. There are a lot of options for creating professional looking charts within Excel.
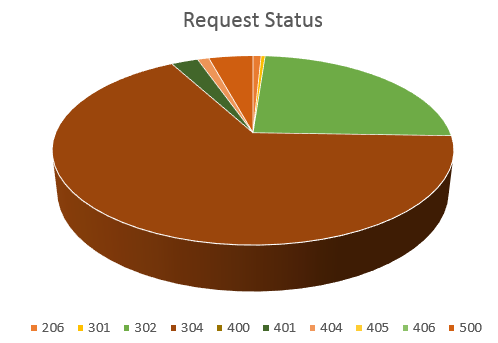
Figure 18: A Pie chart using a CSV file similar to Figure 10
There are so many options and possibilities for analyzing and presenting the results of that analysis using LogParser. For some additional tips and examples, check out the blogs about LogParser written by Robert McMurray. There's also a very useful help file and many pre-written scripts provided within the installation package of LogParser. The next section will discuss this and other topics in more detail.
Help
When you install LogParser 2.2 on your machine, it installs into the C:\Program Files (x86)\Log Parser 2.2 directory by default. Navigate to that location and review the Samples\Queries and Samples\Scripts directories for an abundant supply of pre-written code that will get you moving fast.
You'll also realize a great benefit by reading through the contents within the LogParser.chm file.
Reducing the size of or splitting IIS log files
You may encounter a situation where the IIS log file is too large for LogParser to query. This is most likely on a 32-bit machine, but can happen on a 64-bit machine too. Nonetheless, if you experience "out of memory" errors when running a LogParser query, consider executing the command shown in Figure 19. The query extracts some essential fields from a large IIS log file and places them into another, which results in a smaller log file.
logparser.exe "SELECT date, time, c-ip, cs-uri-stem, cs-uri-query, sc-status, sc-substatus, sc-win32-status, sc-bytes, cs-bytes, time-taken INTO u_exJUSTRIGHT.log FROM u_exTOOBIG.log" -i:w3c -o:w3c
Statistics:
-----------
Elements processed: 19712301
Elements output:    19712301
Execution time:     3.07 seconds
Figure 19: Reducing the size of an IIS log file (by removing fields)
In this example, I realized a file size reduction of about 45%. In many cases this may be enough, in others maybe not. It depends on the size of the original log file. If you find that you still need to reduce the size of the IIS log file, consider adding a date time constraint to the LogParser query as shown in Figure 20.
logparser.exe "SELECT date, time, c-ip, cs-uri-stem, cs-uri-query, sc-status, sc-substatus, sc-win32-status, sc-bytes, cs-bytes, time-taken INTO u_exJUSTRIGHT.log FROM u_exTOOBIG.log WHERE to_timestamp(date, time) >= timestamp('2012-11-09 00:00:00', 'yyyy-MM-dd hh:mm:ss')" -i:w3c -o:w3c
Statistics:
-----------
Elements processed: 240123
Elements output:    240123
Execution time:     0.45 seconds
Figure 20: Further reducing the size of an IIS log file by adding a WHERE clause
This is a valuable technique for reducing the file size, but it's also useful to remove unwanted entries from the IIS Log. For example, when beginning to troubleshoot an issue you realize that time-take, sc-bytes and cs-bytes weren't being logged. You enabled them in IIS and want the query to only analyze those entries with the recently enabled fields. Use the where statement to extract the data from the IIS log file from the time in which those fields have been enabled. This is important when you use the AVG, MIN and MAX aggregates.
Conclusion
LogParser is a small but powerful tool to analyze many different system log types. This article focused on queries applicable to IIS Logs. When performance problems or errors are experienced in your IIS environment, it's sometimes difficult to know where to start.
LogParser can be used as a starting point, because a system administrator who has some SQL skills can quickly build some very sophisticated LogParser queries. These queries can be used to further the root cause analysis of the problem.