Note
Access to this page requires authorization. You can try signing in or changing directories.
Access to this page requires authorization. You can try changing directories.
This article provides troubleshooting steps for resolving 4xx and 5xx HTTP status code errors in Internet Information Services (IIS). 4xx status codes indicate an issue on the client side, while 5xx status codes indicate an issue on the server side. The guidance will help you identify the cause of these errors and resolve them effectively.
Identify 4xx errors
The 4xx HTTP status codes indicate that an error occurred due to a client-side issue. For example, the client browser might have requested a page that doesn't exist, or the client browser might not have provided valid authentication information.
To identify 4xx errors, examine the IIS logs and the HTTPERR logs:
The HTTP status code is recorded in the IIS logs. This file is usually stored in C:\inetpub\logs\Logfiles but can be configured via IIS Logging in IIS Manager.
A 4xx error code can be generated by the HTTP.sys kernel driver, which means these requests might not reach IIS and thus won't be logged in IIS logs. HTTP.sys logs these errors in separate files called HTTPERR logs. This file is usually stored in C:\Windows\System32\LogFiles\HTTPERR but can be configured via the registry
HKEY\LOCAL\MACHINE\System\CurrentControlSet\Services\HTTP\Parameters\ErrorLoggingDir.One way to confirm if the 4xx response is coming from HTTP.sys is to collect a HAR trace file on the client and look for the response header Microsoft-HttpApi/2.0.
To capture a HAR trace file, which records your browser's interaction with the website, follow the instructions in Capture a browser trace for troubleshooting.
Examine the IIS logs
If you find errors in the IIS logs, note the status code (sc-status) and substatus code (sc-substatus) and see HTTP status code overview for more information.
To get more information on the status code and understand which module or handler returned 4xx errors, collect Failed Request Trace (FREB) logs around the time the issue occurred by configuring a FREB rule to be triggered by the status code seen in the IIS logs.
Examine the HTTPERR logs
If you find errors in the HTTPERR logs, note the reason (s-reason) and see Types of Errors Logged by the HTTP Server API for more information.
Identify 5xx errors
The 5xx HTTP status codes indicate that the server couldn't complete the request because the server encountered an error when processing the request. Use the following instructions based on your application type.
500 errors in classic ASP
If a 500 error occurs in classic ASP, check the error code or error message in the cs-uri-query query of the IIS logs.
For more information, capture and examine Failed Request Trace (FREB) logs for the 500 errors.
500 errors in general IIS
If a 500 error occurs in general IIS, examine the IIS logs, note the status code (sc-status) and substatus code (sc-substatus) and see HTTP status code overview for more information on the failure.
Enable detailed error messages if feasible to get more details. To enable detailed error messages, follow these steps:
Open the Run command window.
Launch inetmgr.
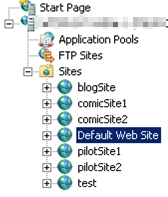
In IIS Manager, under the Connections pane located on the left side of the console, expand the machine name, expand Sites, and then select the target website.
Double-click the Error Pages icon in the middle pane.

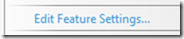
On the right, in the Actions pane, select Edit Feature Settings.
In the Edit Error Pages Settings dialog (where you choose to send both local and remote requests), the second option button is what you need to select to return detailed errors for both local and remote requests. By default, the bottom option is selected to send detailed errors only sent for local requests.
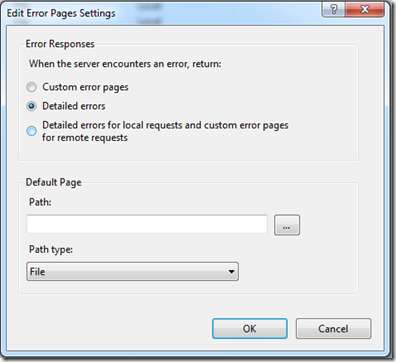
We don't recommend sending detailed errors for remote requests since this option might expose sensitive information to the Internet. You need to revert the changes once you have more information on the failure.
For more information, capture and examine Failed Request Trace (FREB) logs for the 500 errors.
500 errors in ASP.NET
If a 500 error occurs in ASP.NET, use the following methods to identify the root cause of the error:
Check the Application Event Logs.
Check the Application Event Logs around the time the issue occurred. ASP.NET will log the details of the error, including the call stack, in the Application Event Logs.
To access the Application Event Logs, follow these steps:
- Open the Start menu, search for Event Viewer, and select Event Viewer.
- In Event Viewer, open the Windows Logs node.
- Select Application to open the Application Event Logs.
- Search for errors associated with the failed application. The value in the Source column for the errors is IIS AspNetCore Module or IIS Express AspNetCore Module.
Capture memory dumps.
In some cases, it might be necessary to capture a memory dump of a specific exception to examine the details surrounding the exception that caused the 500 HTTP status.
To capture dumps, follow the instructions in Collect memory dumps for a first-chance exception when it occurs.
Use the DebugDiag 2 Analysis tool (part of the DebugDiag suite) with the CrashHangAnalysis rule on the collected dumps to generate a report that can be used to review the call stack and identify the root cause.
To generate a report using the DebugDiag Analysis tool, follow these steps:
- Open DebugDiag 2 Analysis.
- Select Add Data Files and add the .dmp file(s).
- Select CrashHangAnalysis and PerfAnalysis and select Start Analysis.
When finished, a report (.mht) will be created in C:\Program Files\DebugDiag\Reports and displayed in Internet Explorer with the results and recommendations.
If using custom DLLs, you can specify the Symbol Search Path for the custom PDB files by following these steps:
- Open the DebugDiag 2 Collection tool.
- Select Tools > Options And Settings > Folders And Search Paths.
- Under Symbol Search Path For Debugging, select Browse to set the path.
Capture Perfview trace to identify ExecutionTimeout issues.
For 500 errors due to exceeding the ASP.NET ExecutionTimeout, capture a PerfView trace and dumps to identify any delays.
500 errors in ASP.NET Core
If a 500 error occurs in ASP.NET Core, use the following methods to identify the root cause of the error:
Check the Application Event Logs.
To access the Application Event Logs, follow these steps:
- Open the Start menu, search for Event Viewer, and select Event Viewer.
- In Event Viewer, open the Windows Logs node.
- Select Application to open the Application Event Logs.
- Search for errors associated with the failed application. The value in the Source column for the errors is IIS AspNetCore Module or IIS Express AspNetCore Module.
Enable the Developer Exception Page.
The
ASPNETCORE_ENVIRONMENTenvironment variable can be added to web.config to run the application in the development environment. If you don't override the environment setting in your application's startup code using theUseEnvironmentmethod on the host builder, the environment variable allows the Developer Exception Page to appear when the application is run.<aspNetCore processPath="dotnet" arguments=".\MyApp.dll" stdoutLogEnabled="false" stdoutLogFile=".\logs\stdout" hostingModel="InProcess"> <environmentVariables> <environmentVariable name="ASPNETCORE_ENVIRONMENT" value="Development" /> </environmentVariables> </aspNetCore>Setting the environment variable for
ASPNETCORE_ENVIRONMENTis only recommended on staging and test servers not exposed to the Internet. Remove the environment variable from the web.config file after troubleshooting.Enable the ASP.NET Core Module
stdoutlog.To enable and view
stdoutlogs, follow these steps:Navigate to the site's deployment folder on the hosting system.
If the logs folder isn't present, create the folder. For instructions on how to enable MSBuild to create the logs folder in the deployment automatically, see ASP.NET Core directory structure.
Edit the web.config file. Set
stdoutLogEnabledtotrueand change thestdoutLogFilepath to point to the logs folder (for example, .\logs\stdout) like the following one:<aspNetCore processPath="dotnet" arguments=".\App.dll" stdoutLogEnabled="true" stdoutLogFile=".\logs\stdout"> </aspNetCore>Use
stdoutas the file name prefix. A timestamp, process ID (PID), and file extension are added automatically when the log is created. A typical log file name is stdout_<timestamp>_<PID>.log.Ensure your application pool's identity has write permissions to the logs folder.
Save the updated web.config file.
Make a request to the application.
Navigate to the logs folder. Find and open the most recent
stdoutlog.Investigate the errors in the log.
To disable
stdoutlogging when troubleshooting is complete, follow these steps:- Edit the web.config file.
- Set
stdoutLogEnabledtofalse. - Save the file.
Enable the ASP.NET Core Module debug log (IIS).
To enable the ASP.NET Core Module debug log, add the following handler settings to the application's web.config file:
<aspNetCore ...>
   <handlerSettings>
     <handlerSetting name="debugLevel" value="file" />
     <handlerSetting name="debugFile" value="c:\temp\ancm.log" />
   </handlerSettings>
</aspNetCore>
Confirm that the path specified for the log exists and that the application pool's identity has write permissions to the location.
502 errors in ARR
If a 502 error occurs in Application Request Routing (ARR), follow the instructions in Troubleshooting 502 errors in ARR.
503 errors
If you encounter 503 errors, the substatus code (sc-substatus) in the IIS logs or s-reason in the HTTPERR logs can provide some hints.
For more information, see:
Also, refer to the following article, which highlights a known issue that can cause 503 errors:
HTTP response 503 Service Unavailable from IIS: one common generic cause
Data collection
Steps to capture FREB logs
Important
To configure FREB logs, make sure the Tracing role service is installed for IIS.
To install the Tracing role service for IIS, follow these steps:
- Open Server Manager, and select Manage > Add Roles and Features.
- In the Add Roles and Features Wizard window, select Next until you reach the Server Roles page.
- Expand Web Server (IIS) > Web Server > Health and Diagnostics, and select the Tracing checkbox.
- Select Next for the subsequent steps, and then select Install.
Once the Tracing role service is installed, follow these steps to capture FREB:
Open the Run command window.
Launch inetmgr.
In IIS Manager, under the Connections pane, expand the machine name, expand Sites, and then select the target website.
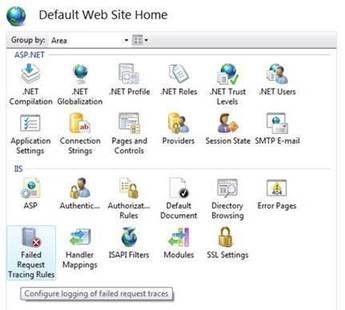
Double-click Failed Request Tracing Rules.
In the Actions pane, select Add.
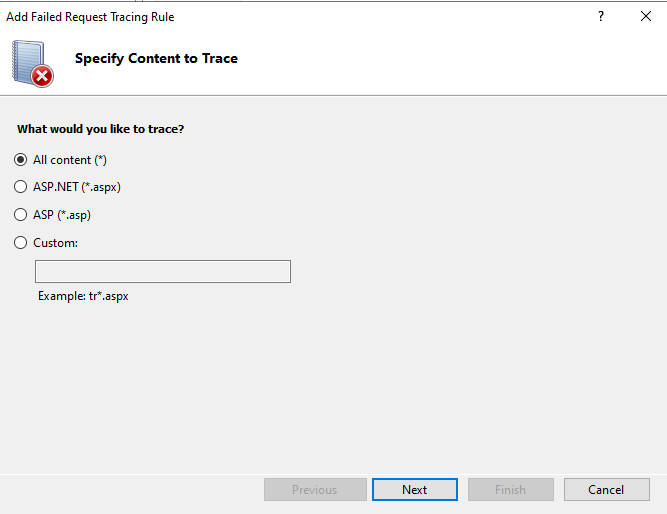
In the Add Failed Request Tracing Rule wizard, on the Specify Content to Trace page, select All content > Next.
On the Define Trace Conditions page, update the Status code(s) field to 400-600 and select Next.

On the Select Trace Providers page, under Providers, select all the checkboxes. Under Areas, make sure all the checkboxes are selected for each provider. Under Verbosity, select Verbose. Select Finish.
Enable Failed Request Tracing for the site and configure the Log File Directory:
In the Connections pane, expand the machine name, expand Sites, and then select Default Web Site.
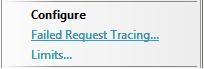
In the Actions pane, under Configure, select Failed Request Tracing.
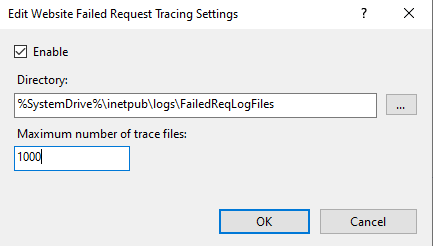
In the Edit Web Site Failed Request Tracing Settings dialog, select the Enable checkbox, set the Directory field to %SystemDrive%\inetpub\logs\FailedReqLogFiles, and set Maximum number of trace files to 1000.
Select OK.
Steps to capture a PerfView trace and dumps
To capture a PerfView trace and dumps, follow the steps in the following sections.
Configure PerfView and Procdump before the issue
Before the issue occurs, follow these steps to configure PerfView and Procdump for data collection:
Download ProcDump. It's a lightweight executable file that doesn't require installation and automates dump collection.
Extract the procdump.exe file to a particular folder on the server.
Download the PerfView tool on the server. It's a profiler tool that captures Event Tracing for Windows (ETW) events (no installation required).
For PerfView to provide useful information, add Tracing as a Role Service for IIS. Without Tracing enabled, an ETW trace will only include HTTP.sys information. If you aren't sure whether the Tracing role service is installed, follow these steps:
- Open Server Manager, and select Manage > Add Roles and Features.
- In the Add Roles and Features Wizard window, select Next until you reach the Server Roles page.
- Expand Web Server (IIS) > Web Server > Health and Diagnostics, and select the Tracing checkbox.
- Select Next for the subsequent steps, and then select Install.
Open the PerfView tool, select the Collect menu, and select the Collect option.
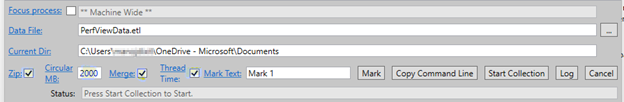
Select the Zip, Merge, and Thread Time checkboxes, as shown in the following screenshot. Modify the Circular MB field to 2000:
Expand the Advanced Options tab and select the IIS checkbox, as shown in the following screenshot.
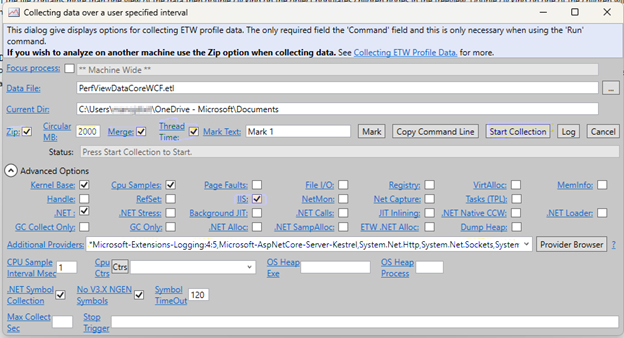
If you're running an ASP.NET Core application, add the following string in the Additional Providers:
*Microsoft-Extensions-Logging:4:5,Microsoft-AspNetCore-Server-Kestrel,System.Net.Http,System.Net.Sockets,System.Net.NameResolution,System.Threading.Tasks.TplEventSource::5,Microsoft-System-Net-Http,Microsoft-Windows-Application Server-Applications::VerboseNote
Don't miss the asterisk (
*) at the beginning.
Collect data during the issue
During the time of the issue, follow these steps to collect data:
Select the Start Collection button in PerfView with the configuration settings you set up in the Configure PerfView and Procdump before the issue section.
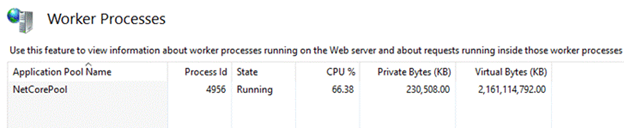
Open Internet Information Services (IIS) Manager.
Select your server name (on the left).
Double-click Worker Processes to see the Process Id of the services. For example:
Open Command Prompt as an administrator.
Navigate to the folder where procdump.exe is extracted by running
cd <path to procdump.exe>in the Command Prompt window.Run the following command to capture consecutive dumps.
procdump.exe -accepteula -ma <PID of W3WP.exe)> -s 10 -n 3Note
Replace
<PID of W3WP.exe>with the actual PID of the W3WP.exe process you found in step 4.- You can specify a path at the end of the command to store the dumps in a specific location.
- This command will capture three sets of dumps at 10-second intervals.
Once the dumps are collected by procdump, stop PerfView by selecting Stop collection, or wait two and a half minutes for it to stop automatically. Allow PerfView to merge the collected data, which might take some time. And it will generate a Perfview.etl.zip file. If you're prompt for symbols, select Use Microsoft Symbol Servers.