Note
Access to this page requires authorization. You can try signing in or changing directories.
Access to this page requires authorization. You can try changing directories.
This article describes the state messaging system in Configuration Manager.
Original product version: Configuration Manager (current branch)
Original KB number: 4459394
Understanding state messaging
State messaging in Configuration Manager is a mechanism that reflects a client condition at a certain point in time. Status messages, by contrast, work to help administrators track the workflow of data through various Configuration Manager components.
A status message viewer is built right into the console so that status messages can be viewed and tracked. There's no equivalent viewer for state messages. The result of state messages is seen in:
- reports
- various data in the console, such as the number of systems that have to be updated
- client logs
State messages contain concise information about conditions in-place on the client. The state messaging system is used by specific components of Configuration Manager, including:
- software updates
- desired configuration management
- network access protection
Critical software update data relies on the state messaging system in Configuration Manager. Understanding state messaging will become even more important in future versions of Configuration Manager as more components take advantage of it.
The following diagram provides a good description of how the state messaging system works.
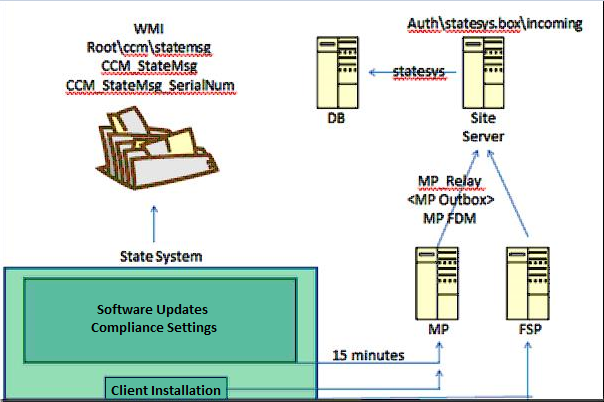
The green box represents the state messaging system. The components inside the box are components that feed information to the system.
When state messages are received, two things occur:
- State messages are stored in the Windows Management Instrumentation (WMI) provider.
- The state system scrapes WMI on a 15-minute cycle (default) for any state messages that haven't been sent, and then forwards them to the management point. The cycle period can be changed.
In the diagram, the client installation piece is shown separately for clarity. During the client installation, the management point is located and targeted for state messages. State messages about the client installation are forwarded to the fallback status point (FSP) (if it's configured) under one of the following conditions:
- The management point isn't reached.
- The management point is down for some reason.
For everything else, traffic goes directly to the management point.
State messages that arrive at the management point are processed into the .smx files by the MP Relay component, and put into the auth\statesys.box\incoming folder on the site server. Then, they're processed into the database to complete the workflow.
Digging deeper
We have to make sure that verbose logging is enabled for:
- the client
- the management point
- the state messaging components on the site server
To set verbose or debug logging on a Configuration Manager client or management point, edit or create the following registry entries:
| Registry subkey | DWORD name | Value data |
|---|---|---|
HKEY_LOCAL_MACHINE/SOFTWARE/Microsoft/CCM/Logging/@Global |
LogLevel | 0 |
KEY_LOCAL_MACHINE/SOFTWARE /Microsoft/CCM/Logging/DebugLogging |
Enabled | True |
On the site server, edit the following registry entry to enable verbose logging, and then restart the SMS_Executive service (or the state system component):
| Registry subkey | DWORD name | Value data |
|---|---|---|
HKEY_LOCAL_MACHINE/SOFTWARE/Microsoft/SMS/Components/SMS_STATE_SYSTEM |
Verbose Logging | 1 |
Tracing SQL commands requires that SQL tracing is enabled for Configuration Manager components. But not much useful data can be obtained directly from the tracing. It's true even if Profiler is enabled. So we'll examine the Updatesdeployment.log and Statemessage.log files on the client. By interpreting the state messages in these logs, we can get a clear picture of what's occurring at the various steps in the process.
Before we examine log code examples, we have to understand the state message format. The state message itself consists of several parts, including Topic Type and State Message ID. At some locations in the logs, the Topic Type seems to already be interpreted for you.
You won't always see Topic Type and State Message ID together in the same log. One type of data without the other doesn't really help you determine what's needed. However, even if you have both Topic Type and State Message ID, the information isn't helpful unless you can interpret it.
The following chart can help you to interpret the combination of TopicType and StateID to obtain meaningful data.
select * from v_StateNames
Note
The following chart includes the 300, 400, and 500 series Topic Type codes.
State messaging data
| TopicType | StateID | StateName |
|---|---|---|
| 300 | 0 | Compliance state unknown |
| 300 | 1 | Compliant |
| 300 | 2 | Non-compliant |
| 300 | 3 | Conflict detected |
| 301 | 0 | Enforcement state unknown |
| 301 | 1 | Installing update(s) |
| 301 | 2 | Waiting for restart |
| 301 | 3 | Waiting for another installation to complete |
| 301 | 4 | Successfully installed update(s) |
| 301 | 5 | Pending system restart |
| 301 | 6 | Failed to install update(s) |
| 301 | 7 | Downloading update(s) |
| 301 | 8 | Downloaded update(s) |
| 301 | 9 | Failed to download update(s) |
| 301 | 10 | Waiting for maintenance window before installing |
| 301 | 11 | Waiting for third-party orchestrator to initiate installation |
| 302 | 0 | Evaluation state unknown |
| 302 | 1 | Evaluation activated |
| 302 | 2 | Evaluation succeeded |
| 302 | 3 | Evaluation failed |
| 400 | 0 | Detection state unknown |
| 400 | 1 | Not Required |
| 400 | 2 | Not Detected |
| 400 | 3 | Detected |
| 401 | 0 | Compliance state unknown |
| 401 | 1 | Compliant |
| 401 | 2 | Non-Compliant |
| 401 | 3 | Conflict Detected |
| 401 | 4 | Error |
| 401 | 5 | Not Applicable |
| 401 | 6 | Not Detected |
| 401 | 7 | Enforced |
| 402 | 0 | Enforcement state unknown |
| 402 | 1 | Enforcement started |
| 402 | 2 | Enforcement waiting for content |
| 402 | 3 | Waiting for another installation to complete |
| 402 | 4 | Waiting for maintenance window before installing |
| 402 | 5 | Restart required before installing |
| 402 | 6 | General failure |
| 402 | 7 | Pending installation |
| 402 | 8 | Installing update |
| 402 | 9 | Pending system restart |
| 402 | 10 | Successfully installed update |
| 402 | 11 | Failed to install update |
| 402 | 12 | Downloading update |
| 402 | 13 | Downloaded update |
| 402 | 14 | Failed to download update |
| 500 | 0 | Detection state unknown |
| 500 | 1 | Update is not required |
| 500 | 2 | Update is required |
| 500 | 3 | Update is installed |
| 501 | 0 | Scan state unknown |
| 501 | 1 | Scan is waiting for catalog location |
| 501 | 2 | Scan is running |
| 501 | 3 | Scan completed |
| 501 | 4 | Scan is pending retry |
| 501 | 5 | Scan failed |
| 501 | 6 | Scan completed with errors |
For more information, see State messages in Configuration Manager.
The following example aligns and compares the Updatesdeployment.log and Statemessage.log files. Make sure that the logs refer to the same state message by aligning the same TopicID (green text). It clearly indicates that the two logs are referring to the same state message. The TopicType is shown in light blue text. Notice that one log might show the actual number that can be interpreted from the State messaging data chart. The other might show a generic value (already interpreted). The State Message ID (StateId) is shown in purple text.
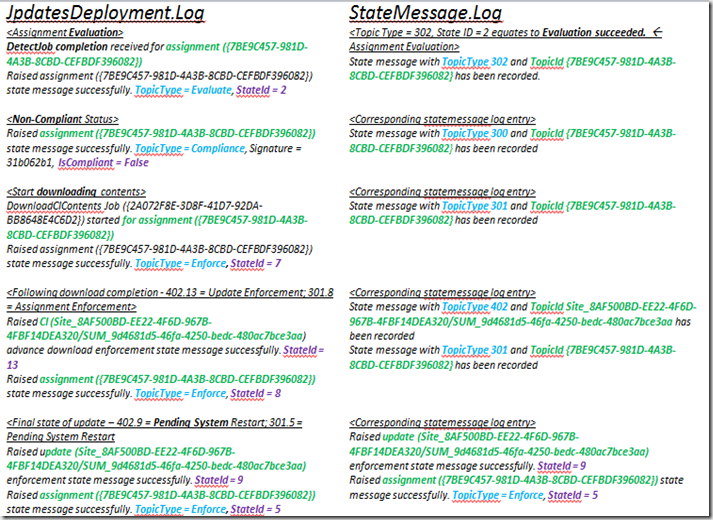
By combining the TopicType and State Message ID (StateId) from the chart, you can track exactly what's occurring in the logs. In this example, these code examples show the following information:
- Update evaluation
- The result of the evaluation
- The update being downloaded
- The update being installed
- A pending system restart
It's just one example of how state messages are sent into the state system.
State messaging data flow
The following image is an actual example of how state messaging data makes its way to the management point and is processed to the database.
This example uses a test client. It starts by forcing the client to scrape WMI for all state messaging information, and then sends that information to the management point on its next polling cycle.
In WMI, state messages are stored in the root\ccm\statemsg namespace. In that namespace, there are two classes of interest: CCM_StateMsg_SerialNum and CCM_StateMsg.
The CCM_StateMsg_SerialNum class is used to record the last serial number that's used for a state message. Every state message has a unique serial number, similar to the hardware inventory. In this manner, the site server can keep track of whether it's missing any state messages from the system. It's important because missing state messages may cause incomplete or inaccurate state reporting.
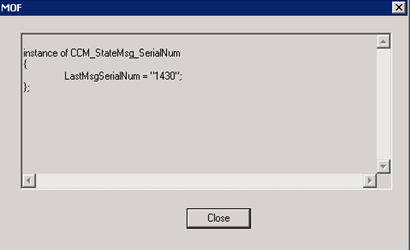
The CCM_StateMsg class contains the state messages themselves. In the class instance, you can find all the state messages that are recorded.
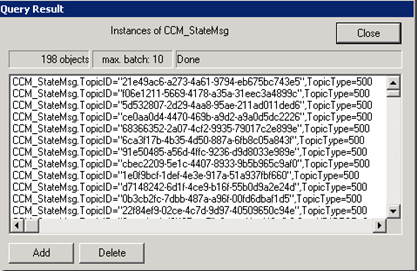
If you open one of these messages, you'll find the details of the state message and some data that we previously discussed, as shown in the following example.
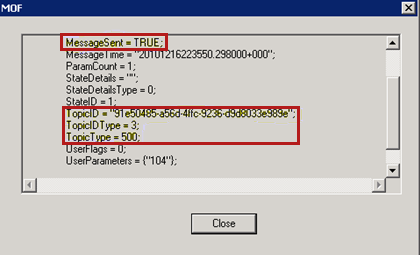
We can resend the data to the management point, and track its progress by using the following resync scripts.
RefreshServerComplianceState()

Sub RefreshServerComplianceState()
dim newCCMUpdatesStore
set newCCMUpdatesStore = CreateObject ("Microsoft.CCM.UpdatesStore")
newCCMUpdatesStore.RefreshServerComplianceState
wscript.echo "Ran RefreshServerComplianceState."
End Sub
$UpdatesStore = New-Object -ComObject Microsoft.CCM.UpdatesStore
$UpdatesStore.RefreshServerComplianceState()
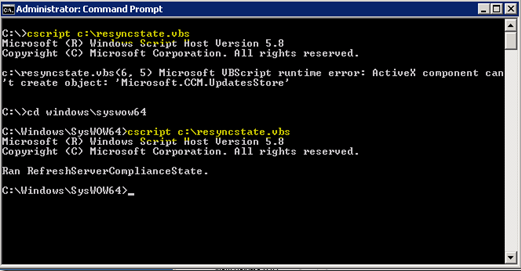
This script can be found on the web in various locations. It uses the Configuration Manager SDK to cause the client to resend its data to the management point.
Typically, a Visual Basic script (VBScript) is run by using cscript. Notice that the script may fail if you try to run it yourself. The problem is that Configuration Manager is a 32-bit application that's running on a 64-bit server. The default version of cscript is the 64-bit version and generally works fine with any VBScript. However, in this case, the call that's being made requires the 32-bit version of cscript that you must run out of the syswow64 folder.
When the next state message polling cycle occurs, all state messages are sent to the management point.
In the Statemessage.log file, you can see that the state message information is pulled, formatted into XML, and then sent to the management point. The state message information should resemble the following example:
<![LOG[StateMessage body: <?xml version="1.0" encoding="UTF-16"?>
<Report><ReportHeader><Identification><Machine><ClientInstalled>1</ClientInstalled><ClientType>1</ClientType><ClientID>GUID:GUID</ClientID>
<ClientVersion>client_version_number</ClientVersion><NetBIOSName>name</NetBIOSName><CodePage>437</CodePage>
<SystemDefaultLCID>1033</SystemDefaultLCID></Machine></Identification><ReportDetails><ReportContent>State Message Data</ReportContent>
<ReportType>Full</ReportType><Date>date</Date><Version>1.0</Version><Format>1.0</Format></ReportDetails></ReportHeader><ReportBody><StateMessage MessageTime="time" SerialNumber="serial_number"><Topic ID="21e49ac6-a273-4a61-9794-eb675bc743e5" Type="500" IDType="3"/><State ID="2" Criticality="0"/><UserParameters Flags="0" Count="1"><Param>102</Param></UserParameters></StateMessageserParameters></StateMessage></ReportBody></Report>
]LOG<![LOG[CStateMsgManager::GetSignEncyptMode]LOG]!><time="time" date="date" component="StateMessage" context="" type="1" thread="3592" file="statemsg.cpp:1820">
<![LOG[Successfully forwarded State Messages to the management point]LOG]!><time="time" date="date" component="StateMessage" context="" type="1" thread="3592" file="statemsg.cpp:1527">
Note
This example is truncated to a single state message because of the size of the XML file.
Although the Statemessage.log file records that the messages are dispatched to the management point, the state messaging system doesn't actually move data to the management point. In the following example, you can see that CCMMessaging does this operation. There's more that go on behind the scenes at this point. However, it's sufficient to know that CCMMessaging sends the data to the management point (in this case, the MP_Relay component).
<![LOG[OutgoingMessage(Queue='mp_mp_relayendpoint', ID={A9E7A07D-223D-4F5D-93D5-15AF5B72E05C}): Delivered successfully to host 'host_name'.]LOG]!>
When the data arrives for processing at MP_Relay, it's processed and translated to the .smx file format, and then put into the auth\statesys.box\incoming folder.
Inv-Relay Task: Processing message body
Relay: FileType= SMX
Relay: Outbox dir: C:\Program Files (x86)\Microsoft Configuration Manager\inboxes\auth\statesys.box\incoming
Relay: Received 0 attachments
Relay: 0 of 0 attachments successfully processed
Inv-Relay: Task completed successfully
In the auth\statesys.box\incoming folder, you can see the .smx files being processed. Typically, you won't see them here. But if the files remain in this folder, you need to investigate what the messages are and why they aren't being processed. If you find an .smx file, you can open it by using a text editor such as Notepad to see the details. However, the formatting of the file may be unreadable, as in the following example:
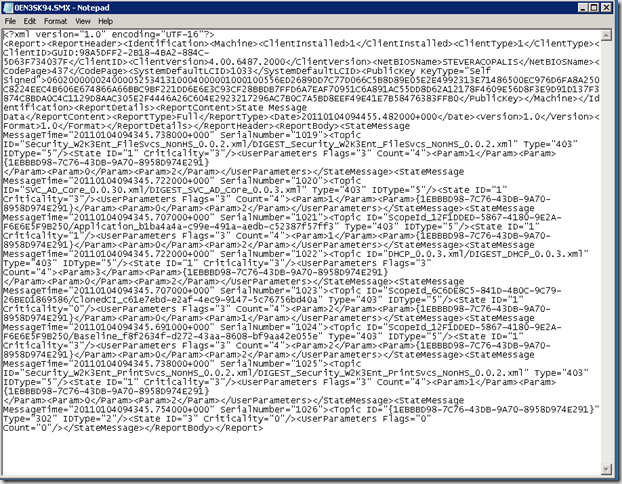
If you rename the .smx file by adding the .xml extension so that the file is named file_name.smx.xml, and then you double-click the new file name, the XML file is opened in Internet Explorer and is much easier to read.
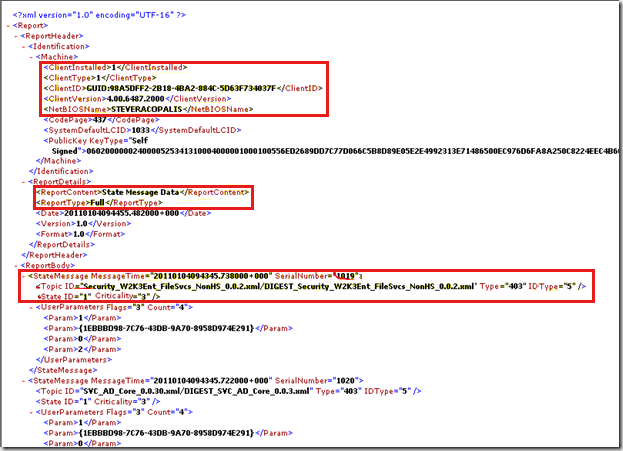
The following image is an example of an XML file opened in Internet Explorer. The details of the computer and state message are highlighted. It contains the information that we've previously discussed, combined with the unique State Message ID value.
Note
If you rename these files, first copy them to a different folder so that you don't affect the Statesys.box folder.
Finally, the state messages must be processed into the database. In the Statesys.log file, you can see such messages similar to the following example:
Found new state messages to process, starting processing thread
Thread "State Message Processing Thread #0" id:5076 started
CMessageProcessor - Detected parent site 'site_name'
CMessageProcessor - Processing file: mdlbp169.SMW
CMessageProcessor - Processed 1 records with 0 invalid records.
CMessageProcessor - Successfully replicated file "mdlbp169.SMW" to parent site site_name.
CMessageProcessor - Processed 1 message files in this batch, with 0 bad files.
Thread "State Message Processing Thread #0" id:5076 terminated normally
The database processing component can be made visible by enabling SQL tracing, but it doesn't help much. We must use the SQL profiler instead. The profiler gives us a hint of what's occurring behind the scenes, but not completely. Several SQL stored procedures are responsible for processing state messages. Besides, several tables in the database store the state messaging data. The stored procedures that do state message processing generally start with the name spProcess. There are many of such procedures.
The site server tracks state messages as they arrive, so it can flag any missing messages and periodically request a resync when necessary. State messages are important. You don't want to miss any.
As state messages arrive, the unique ID is read and stored in the database. As processing continues, the data is regularly updated. If a gap is detected, that data is flagged and stored as missing state messages in the SR_MissingMessageRanges table. Ideally, this table will be empty. However, in production, you may see data in the table. This table helps track state messages that require a resync.
The site control file is located in the database. To obtain the specific settings for STATE_MESSAGE_SYSTEM, run the following query on a primary or CAS site:
select * from SC_Component_Property where ComponentID in (select ID from SC_Component where ComponentName like 'SMS_STATE_SYSTEM') and sitenumber in (select SiteNumber from SC_SiteDefinition where Sitecode = (Select ThisSiteCode from SMSData))
STATE_MESSAGE_SYSTEM settings
| Name | Value1 | Value2 | Value3 |
|---|---|---|---|
| Heartbeat Msg Interval | 60 | ||
| Inbox Polling Interval | 900 | ||
| Loader Chunk Size | 256 | ||
| Loader Threads | 4 | ||
| Max Chunks Fetched | 100 | ||
| Min Missing Message Age | 2880 | ||
| Resync Check Interval | 15 | ||
| Retry Config | REG_SZ | <Config><Retry PatternID="0" RetryQueue="0">7200,28800,86400</Retry></Config> | 0 |
Note
- Resync Check Interval is set to 60 minutes. This is the schedule for checking systems that require state message resyncs.
- Min Missing Message Age is set to 2880. This is how long a message must be missing before a resync is requested.