Note
Access to this page requires authorization. You can try signing in or changing directories.
Access to this page requires authorization. You can try changing directories.
Note
To automate the manual analysis described in this article, see Use AGDiag to diagnose availability group health events.
This article provides troubleshooting steps to help you determine why your availability group failed over.
Effects of Always On health issues or failover
Always On implements robust health monitoring through different mechanisms to ensure the health of the Microsoft SQL Server instance that hosts the primary replica, the underlying cluster, and the system health. The production workload is momentarily interrupted when a Windows cluster or Always On health problem is identified.
When a health condition is detected, the following sequence of events usually occurs. Throughout this troubleshooter, health events are mentioned in reference to the following events:
Availability group replicas and databases transition from primary role to resolving role.
Availability group databases transition to offline and are no longer accessible.
Windows Cluster marks the availability group clustered resource as failed.
Windows Cluster tries to bring the availability group role back online (on original or automatic failover partner replica).
The availability group role comes online successfully if it's detected to be healthy by Always On and Windows Cluster health monitoring.
If successful, the availability group replicas and databases transition to the primary role and the availability group databases come online and are accessible by your application.
Applications can't access the availability group databases
When a health condition is detected, the availability group replica and databases transition to the Resolving role, and the availability group databases are taken offline. After the replica comes online in the primary role (on the original replica server or the failover partner replica server), the replica and databases again transition to online. While the replica and databases are resolving and are offline, any applications that try to access those availability group databases fail and generate an "Error 983" message: Unable to access availability database.... This error is also recorded in the Microsoft SQL Server error log if SQL Server is configured to record failed login attempts:
Logon Error: 983, Severity: 14, State: 1.

Logon Unable to access availability database '<databasename>' because the database replica is not in the PRIMARY or SECONDARY role. Connections to an availability database is permitted only when the database replica is in the PRIMARY or SECONDARY role. Try the operation again later.
The period during which the availability group is in the Resolving role before it comes back online in the primary role typically last only a few seconds or even less than a second.
Identify and diagnose Always On availability group health events or failover
1. Identify Always On health trends
You might investigate a single Always On health event, or there might be a recent or ongoing trend of health problems that are intermittently interrupting production. The following questions can help you to narrow down and correlate recent changes in your production environment that might be related to these health problems:
- When did the Always On or cluster health events trend begin?
- Do the health events occur on a certain day?
- Do the health events occur at a certain time of day?
- Do the health events occur on a certain day or week of the month?
If you detect a trend, check the scheduled maintenance on the system (the host system in a virtual environment), ETL batches, and other jobs that might correlate with these health events. If the system is a virtual machine, investigate the host system for changes that were possibly introduced at the time of the outages.
Consider busy ad-hoc production workloads that might correlate to the time of the health issues (for example, when users first log on to the system, or after users return from lunch).
Note
This is a good time to consider a plan to collect performance data throughout the week and month. To better understand when the system is busiest, you can measure Windows performance monitor counters such as Processor Information::% Processor Time, Memory::Available MBytes, and MSSQLServer:SQL Statistics::Batch Requests/sec.
2. Review the cluster log
The Windows Cluster log is the most comprehensive log to use to identify the kind of Always On or cluster health event and also the detected health condition that caused the event. To generate and open the cluster log, follow these steps:
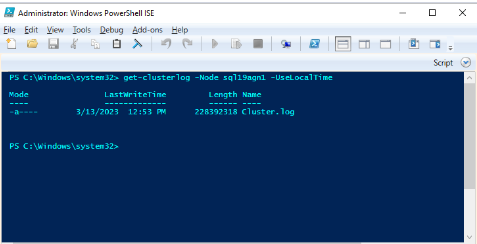
Use Windows PowerShell to generate the Windows Cluster log on the cluster node that hosts the primary replica at the time of the health event. For example, run the following cmdlet in an elevated PowerShell window by using 'sql19agn1' as the SQL Server-based server name:
get-clusterlog -Node sql19agn1 -UseLocalTime
Note
By default, the log file is created in %WINDIR%\cluster\reports.
3. Find the health event in the cluster log
Always On uses several health monitoring mechanisms to monitor availability group health. In addition to a Windows Cluster health event (in which Windows Cluster detects a health issue among the cluster nodes), Always On has four different kinds of health checks:
- The SQL Server service isn't running
- A SQL Server lease time-out
- A SQL Server health check time-out
- A SQL Server internal health issue
You can locate any of these Always On specific health events by searching the cluster log for the string, [hadrag] Resource Alive result 0. This string is saved in the cluster log when any of these events are detected. For example:
00001334.00002ef4::2019/06/24-18:24:36.153 ERR [RES] SQL Server Availability Group : [hadrag] Resource Alive result 0.
You can use a tool to find all the health events in the cluster log so that you can generate a summary report of Always On health problems. This can be useful to identify chronological trends and determine whether a particular Always On health condition is recurring. The following screenshot shows how to use a text editor (NotePad++, in this case) to find all the lines in the cluster log that contain the [hadrag] Resource Alive result 0 string:

Identify and resolve the health issue that triggered the failover
To identify the health issues in the cluster log of the primary replica, compare them to the issues described in the following sections. Common reasons for AG failover include:
- Cluster health event
- SQL Server service is down (an Always On health event)
- Lease time-out (an Always On health event)
- Health check time-out (an Always On health event)
- SQL Server health (an Always On health event)
Cluster health events
Microsoft Windows Cluster monitors the health of the member servers in the cluster. If a health problem is detected, a cluster member server might be removed from the cluster. Also, the cluster resources (including the availability group role that's hosted on the removed cluster member server) will be moved to the availability group failover partner replica if it's configured for automatic failover.
Symptoms
Here's an example of a cluster health event in the cluster log. To find it, you can search for Lost quorum or Cluster service has terminated because either might be present during the availability group role change or failover.
00000fe4.00001628::2022/12/15-14:26:02.654 WARN [QUORUM] Node 1: Lost quorum (1)
00000fe4.00001628::2022/12/15-14:26:02.654 WARN [QUORUM] Node 1: goingAway: 0, core.IsServiceShutdown: 0
00000fe4.00001628::2022/12/15-14:26:02.654 WARN lost quorum (status = 5925)
00000fe4.00001628::2022/12/15-14:26:02.654 INFO [NETFT] Cluster Service preterminate succeeded.
00000fe4.00001628::2022/12/15-14:26:02.654 WARN lost quorum (status = 5925), executing OnStop
00000fe4.00001628::2022/12/15-14:26:02.654 INFO [DM]: Shutting down, so unloading the cluster database.
00000fe4.00001628::2022/12/15-14:26:02.654 INFO [DM] Shutting down, so unloading the cluster database (waitForLock: false).
000019cc.000019d0::2022/12/15-14:26:02.654 WARN [RHS] Cluster service has terminated. Cluster.Service.Running.Event got signaled.
Another way to identify this event is to search the Windows system event log:
Critical SQL19AGN1.CSSSQL 1135 Microsoft-Windows-FailoverClusterin Node Mgr NT AUTHORITY\SYSTEM Cluster node 'SQL19AGN2' was removed from the active failover cluster membership. The Cluster service on this node may have stopped. This could also be due to the node having lost communication with other active nodes in the failover cluster. Run the Validate a Configuration wizard to check your network configuration. If the condition persists, check for hardware or software errors related to the network adapters on this node. Also check for failures in any other network components to which the node is connected such as hubs, switches, or bridges.
Critical SQL19AGN1.CSSSQL 1177 Microsoft-Windows-FailoverClusterin Quorum Manager NT AUTHORITY\SYSTEM The Cluster service is shutting down because quorum was lost. This could be due to the loss of network connectivity between some or all nodes in the cluster, or a failover of the witness disk. Run the Validate a Configuration wizard to check your network configuration. If the condition persists, check for hardware or software errors related to the network adapter. Also check for failures in any other network components to which the node is connected such as hubs, switches, or bridges.
Diagnose a cluster health event
The errors in the Windows event log (Events 1135 and 1177) suggest that network connectivity is a cause of the event. This is the most common reason that a cluster health issue is detected. The following example shows that other cluster member servers couldn't communicate with this server that hosts the availability group primary replica, and that this problem triggered the removal of the cluster node from the cluster:
00000fe4.00001edc::2022/12/14-22:44:36.870 INFO [NODE] Node 1: New join with n3: stage: 'Attempt Initial Connection' status (10060) reason: 'Failed to connect to remote endpoint <endpoint address>'
00000fe4.00001620::2022/12/15-14:26:02.050 INFO [IM] got event: Remote endpoint <endpoint address> unreachable from <endpoint address>
00000fe4.00001620::2022/12/15-14:26:02.050 WARN [NDP] All routes for route (virtual) local <local address> to remote <remote address> are down
00000fe4.0000179c::2022/12/15-14:26:02.053 WARN [NODE] Node 1: Connection to Node 2 is broken. Reason GracefulClose(1226)' because of 'channel to remote endpoint <endpoint address> is closed'
You can search the cluster log for evidence of a connection failure to the node. From the location in the cluster log where you found Lost quorum, search backwards for strings such as Failed to connect to remote endpoint, unreachable, and is broken.
Resolution
Make sure that cluster health monitoring is appropriate for the host environment. For more information about SQL Server Always On availability groups that are hosted in Microsoft Azure, see Windows Server Failover Cluster overview - SQL Server on Azure VMs.
If it's necessary, consider contacting Microsoft Windows High Availability support to open a support incident.
SQL Server service is down: An Always On health event
Always On health monitoring can detect whether the SQL Server service that hosts the availability group primary replica is no longer running.
Symptoms
Here's a sample of the cluster log report for the availability group role 'ag' that indicates a failure because QueryServiceStatusEx returned a process ID 0:
00001898.0000185c::2023/02/27-13:27:41.121 ERR [RES] SQL Server Availability Group <ag>: [hadrag] QueryServiceStatusEx returned a process id 0
00001898.0000185c::2023/02/27-13:27:41.121 ERR [RES] SQL Server Availability Group <ag>: [hadrag] SQL server service is not alive
00001898.0000185c::2023/02/27-13:27:41.121 ERR [RES] SQL Server Availability Group <ag>: [hadrag] Resource Alive result 0.
00001898.0000185c::2023/02/27-13:27:41.121 WARN [RHS] Resource ag IsAlive has indicated failure.
Diagnose SQL Service shutdown events
Check the Windows system event log and SQL Server error log for an unexpected SQL Server shutdown.
If SQL Server was shut down by a system shutdown or an administrative shutdown, you would see the following entry in the SQL Server error log:
2023-03-10 09:38:46.73 spid9s SQL Server is terminating in response to a 'stop' request from Service Control Manager. This is an informational message only. No user action is required.
The Windows system event log would show the following error entry:
Information 3/10/2023 9:41:06 AM Service Control Manager 7036 None The SQL Server (MSSQLSERVER) service entered the stopped state.
The Windows system event log shows the following error entry if SQL Server shuts down unexpectedly:
Error 3/10/2023 8:37:46 AM Service Control Manager 7034 None The SQL Server (MSSQLSERVER) service terminated unexpectedly. It has done this 1 time(s).
Check the end of the SQL Server error log for clues. If the error log ends abruptly, this means that it was shut down by force. For instance, if SQL Server was terminated by using Task Manager, the SQL Server error report wouldn't reveal any information about any internal problems that might have caused the process to shut down.
Resolution
Ensure that authorized database and system administrators have access to the system to minimize unexpected terminations of the SQL Server service. After you examine the event logs, investigate why a service had to be terminated unexpectedly.
If a SQL Server internal health issue caused SQL Server to terminate unexpectedly, there might be clues of a possible fatal exception (including a memory dump diagnostic file being generated) at the end of the SQL error log. Review the clues and take the necessary action. If you find a dump file, consider contacting Microsoft SQL Server support, and provide the SQL Server error log and dump file content for further investigation.
Lease time-out: An Always On health event
Always On uses a "lease" mechanism to monitor the health of the computer on which SQL Server is installed. The default lease time-out is 20 seconds.
Symptoms
Here's a sample output of an Always On lease time-out from the cluster log. You can search these strings to locate a lease time-out in the cluster log.
00001a0c.00001c5c::2023/01/04-15:36:54.762 ERR [RES] SQL Server Availability Group : [hadrag] Availability Group lease is no longer valid
00001a0c.00001c5c::2023/01/04-15:36:54.762 ERR [RES] SQL Server Availability Group : [hadrag] Resource Alive result 0.
00001a0c.00001c5c::2023/01/04-15:36:54.762 WARN [RES] SQL Server Availability Group: [hadrag] Lease timeout detected, logging perf counter data collected so far
00001a0c.00001c5c::2023/01/04-15:36:54.762 WARN [RES] SQL Server Availability Group: [hadrag] Date/Time, Processor time(%), Available memory(bytes), Avg disk read(secs), Avg disk write(secs)
00001a0c.00001c5c::2023/01/04-15:36:54.762 WARN [RES] SQL Server Availability Group: [hadrag] 1/4/2023 15:35:57.0, 98.068572, 509227008.000000, 0.000395, 0.000350 00001a0c.00001c5c::2023/01/04-15:36:54.762 WARN [RES] SQL Server Availability Group: [hadrag] 1/4/2023 15:36:7.0, 12.314941, 451817472.000000, 0.000278, 0.000266 00001a0c.00001c5c::2023/01/04-15:36:54.762 WARN [RES] SQL Server Availability Group: [hadrag] 1/4/2023 15:36:17.0, 17.270742, 416096256.000000, 0.000376, 0.000292 00001a0c.00001c5c::2023/01/04-15:36:54.762 WARN [RES] SQL Server Availability Group: [hadrag] 1/4/2023 15:36:27.0, 38.399895, 416301056.000000, 0.000446, 0.000304 00001a0c.00001c5c::2023/01/04-15:36:54.762 WARN [RES] SQL Server Availability Group: [hadrag] 1/4/2023 15:36:37.0, 100.000000, 417517568.000000, 0.001292, 0.000666
For more information about lease time-out, see the Lease Mechanism section in Mechanics and guidelines of lease, cluster, and health check timeouts for Always On availability groups.
Diagnose and resolve Always On lease time-out events
There are two main issues that can trigger a lease time-out:
SQL Server memory dump: When SQL Server detects certain internal health events, such as an access violation, an assertion, or scheduler deadlock, it generates a diagnostic dump file (.mdmp) in the SQL Server \LOG folder. The process of generating a memory dump suspends SQL Server execution for a brief period. In that period the lease mechanism can detect lack of service response and trigger action. For more information, see Impact of dump generation.
A system wide performance issue: A lease time-out doesn't necessarily indicate a SQL Server health issue. Instead, it could indicate a system-wide health issue that also affects the health of the SQL Server-based server.
- High CPU usage on the system (close to 100%).
- Out-of-memory conditions - low virtual memory and/or one of the processes is being paged out.
- WSFC going offline due to quorum loss
- VM throttling affecting performance and causing lease expiration.
Resolution
For detailed troubleshooting steps, see MSSQLSERVER_19407. Here are the two most common issues:
1. SQL Server dump file diagnostic
SQL Server might detect an internal health issue such as an access violation, assertion, or deadlocked schedulers. In this situation, the program generates a mini dump file (.mdmp) in the SQL Server \LOG folder of the SQL Server process for diagnosis. The SQL Server process is frozen for several seconds while the mini dump file is written to disk. During this time, all threads within the SQL Server process are in a frozen state, which includes the lease thread that's monitored by Always On health monitoring. Therefore, Always On might detect a lease time-out.
**Dump thread - spid = 0, EC = 0x0000000000000000
***Stack Dump being sent to C:\Program Files\Microsoft SQL Server\MSSQL12.MSSQLSERVER\MSSQL\LOG\SQLDump0001.txt
* *******************************************************************************
*
* BEGIN STACK DUMP:
*   11/02/14 21:21:10 spid 1920
*
* Deadlocked Schedulers
*
* *******************************************************************************
* -------------------------------------------------------------------------------
* Short Stack Dump
Stack Signature for the dump is 0x00000000000002BA
Error: 19407, Severity: 16, State: 1.
The lease between availability group 'ag' and the Windows Server Failover Cluster has expired. A connectivity issue occurred between the instance of SQL Server and the Windows Server Failover Cluster. To determine whether the availability group is failing over correctly, check the corresponding availability group resource in the Windows Server Failover Cluster.
To resolve this issue, the memory dump file diagnostic must be examined for the root cause. Consider contacting Microsoft SQL Server support to provide the SQL Server error log and dump file content for further investigation.
2. High CPU usage or other system performance issue
A lease time-out indicates a performance issue that affects the entire system, including SQL Server. To diagnose the system issue, Always On health diagnostics reports performance monitor data in the cluster log and includes the lease time-out event. The performance data spans approximately 50 seconds leading up to the lease time-out event, reporting on CPU utilization, free memory, and disk latency.
Here's an example of the reported performance data that shows a lease time-out in the cluster log. In this sample output, high overall CPU utilization that might be related to the lease time-out.
00000f90.000015c0::2020/08/07-14:16:41.378 WARN [RES] SQL Server Availability Group: [hadrag] Lease timeout detected, logging perf counter data collected so far
00000f90.000015c0::2020/08/07-14:16:41.382 WARN [RES] SQL Server Availability Group: [hadrag] Date/Time, Processor time(%), Available memory(bytes), Avg disk read(secs), Avg disk write(secs)
00000f90.000015c0::2020/08/07-14:16:41.431 WARN [RES] SQL Server Availability Group: [hadrag] 8/7/2020 14:15:20.0, 83.266073, 31700828160.000000, 0.018094, 0.015752
00000f90.000015c0::2020/08/07-14:16:41.431 WARN [RES] SQL Server Availability Group: [hadrag] 8/7/2020 14:15:30.0, 93.653224, 31697063936.000000, 0.038590, 0.026897
00000f90.000015c0::2020/08/07-14:16:41.431 WARN [RES] SQL Server Availability Group: [hadrag] 8/7/2020 14:15:40.0, 94.270691, 31696265216.000000, 0.166000, 0.038962
00000f90.000015c0::2020/08/07-14:16:41.434 WARN [RES] SQL Server Availability Group: [hadrag] 8/7/2020 14:15:50.0, 90.272016, 31695409152.000000, 0.215141, 0.106084
00000f90.000015c0::2020/08/07-14:16:41.434 WARN [RES] SQL Server Availability Group: [hadrag] 8/7/2020 14:16:1.0, 99.991336, 31695892480.000000, 0.046983, 0.035440
If the performance data shows high CPU utilization, a low memory condition, or high disk latency at the time of a lease time-out, begin collecting Performance Monitor data for the full day on the primary replica to investigate these symptoms. By capturing performance monitor data over a longer period, you can better identify baseline and peak values for these resources and monitor changes in these resources when a lease time-out occurs. As you collect this data, consider whether there are certain scheduled or ad-hoc workloads in SQL Server that correlate to the time of these resource problems and health events.
You should also capture counters that report the same system resource usage, including the following:
Processor Information::% Processor TimeMemory::Available MBytesLogical Disk::Avg. Disk sec/ReadLogical Disk::Avg. Disk sec/WriteLogical Disk::Avg. Disk Read Queue LengthLogical Disk::Avg. Disk Write Queue LengthMSSQLServer:SQL Statistics::Batch Requests/sec
Health check time-out: An Always On health event
Always On uses a health check mechanism to monitor the health of SQL Server and the ability for client applications to connect.
Symptoms
When an availability group replica transitions into the primary role, Always On health monitoring establishes a local ODBC connection to the SQL Server instance. While Always On is connected and monitoring, if SQL Server doesn't respond over the ODBC connection within the period that's set for the availability group's health check time-out (default is 30 seconds), then a health check time-out event is triggered. In this situation, the availability group transitions from the primary role to the Resolving role and initiates failover, if it's configured to do this.
For more information about health check time-outs, see the "Health check timeout operation" section in Mechanics and guidelines of lease, cluster, and health check timeouts for Always On availability groups.
Here's an Always On health check time-out as reported in the cluster log:
0000211c.00002d70::2021/02/24-02:50:01.890 WARN [RES] SQL Server Availability Group: [hadrag] Failed to retrieve data column. Return code -1
0000211c.00002594::2021/02/24-02:50:02.452 ERR [RES] SQL Server Availability Group: [hadrag] Failure detected, diagnostics heartbeat is lost
0000211c.00002594::2021/02/24-02:50:02.452 ERR [RES] SQL Server Availability Group <AG>: [hadrag] Availability Group is not healthy with given HealthCheckTimeout and FailureConditionLevel
0000211c.00002594::2021/02/24-02:50:02.452 ERR [RES] SQL Server Availability Group <AG>: [hadrag] Resource Alive result 0.
0000211c.00002594::2021/02/24-02:50:02.453 WARN [RHS] Resource AG IsAlive has indicated failure.
00001278.00002ed8::2021/02/24-02:50:02.453 INFO [RCM] HandleMonitorReply: FAILURENOTIFICATION for 'AG', gen(0) result 1/0.
Diagnose and resolve Always On health check time-out event
The following section helps you to review the SQL Server logs for "bread crumb" events that you might find and that correlate to Always On health check time-outs that are detected and reported. The logs that are reviewed here include the cluster log (where the health check time-out is confirmed), the system_health extended event logs and SQL Server error logs (both found in the SQL Server \LOG folder), and the Windows system event log. Use these and other logs to look for correlating events that might help you scope the cause of the health check time-out.
1. Check for non-yielding scheduler events
The Always On health check time-out is frequently caused by "non-yielding" events in SQL Server. When SQL Server detects that a thread hasn't yielded on a scheduler, it will report that a non-yielding scheduler event has occurred. If you see other tasks on the same scheduler that aren't receiving CPU time, this is the primary sign of a non-yielding scheduler. This behavior can cause a delayed execution of those tasks and "starve" workloads that are assigned to a certain scheduler of CPU time.
To check for non-yielding scheduler events, follow these steps:
Check the SQL Server
system_healthextended event logs to determine whether a non-yielding scheduler event of some kind was reported around the time of the Always On health check time-out event. Non-yielding events that you might find include the following:scheduler_monitor_non_yielding_ring_buffer_recordedscheduler_monitor_non_yielding_iocp_ring_buffer_recordedscheduler_monitor_stalled_dispatcher_ring_buffer_recordedscheduler_monitor_non_yielding_rm_ring_buffer_recorded
Open the SQL Server system health extended event logs on the primary replica to the time of the suspected health check time-out.
In SQL Server Management Studio (SSMS), go to File > Open, and select Merge Extended Event Files.
Select the Add button.
In the File Open dialog box, navigate to the files in the SQL Server \LOG directory.
Press and hold Control, and then select the files whose names begin with
system_health_xxx.xel.Select Open > OK.
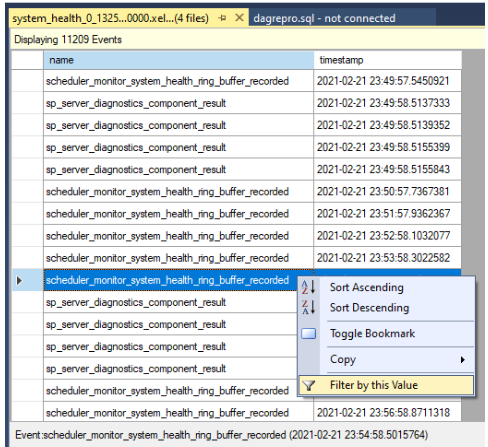
Filter the results. Right-click an event under the name column, and select Filter by this Value.
Define a filter to sort rows in which the values in the name column contains
yield, as shown in the following screenshot. This returns all kinds of non-yielding events that might have been recorded in thesystem_healthlogs.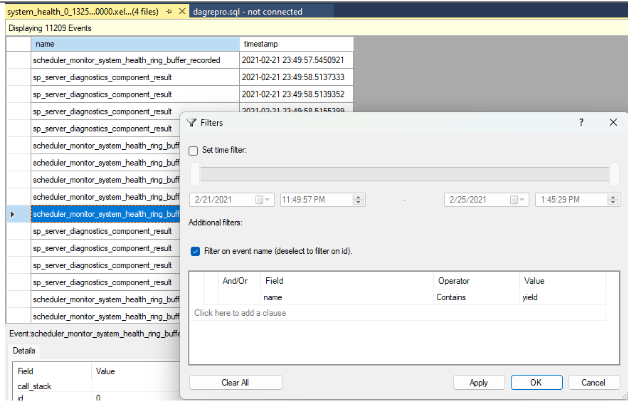
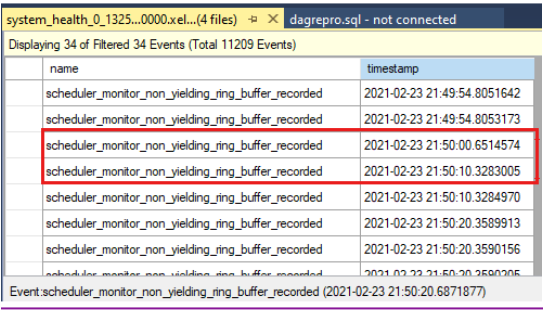
Compare the timestamps to see whether there were non-yielding events at the time of the health check time-out. Here's the health check time-out as reported in the cluster log:
0000211c.00002594::2021/02/24-21:50:02.452 ERR [RES] SQL Server Availability Group: [hadrag] Failure detected, diagnostics heartbeat is lost 0000211c.00002594::2021/02/24-21:50:02.452 ERR [RES] SQL Server Availability Group < SQL19AGN1>: [hadrag] Availability Group is not healthy with given HealthCheckTimeout and FailureConditionLevel 0000211c.00002594::2021/02/24-21:50:02.452 ERR [RES] SQL Server Availability Group < SQL19AGN1: [hadrag] Resource Alive result 0.You can see that there were non-yielding events that occurred at the time of the health check time-out.
If non-yielding events are detected, check the cause of the non-yielding event. Consider contacting the SQL Server support team to investigate the non-yielding events.
2. Check the SQL Server error log
Check the SQL Server error log for correlating events at the time of the health check time-out. These events might provide "bread crumbs" that suggest further steps to scope the root cause of the health check time-outs.
For example, the following log entry shows that a health check time-out occurred in the cluster log:
0000211c.00002594::2021/02/24-02:50:02.452 ERR [RES] SQL Server Availability Group: [hadrag] Failure detected, diagnostics heartbeat is lost
0000211c.00002594::2021/02/24-02:50:02.452 ERR [RES] SQL Server Availability Group <SQL19AGN1>: [hadrag] Availability Group is not healthy with given HealthCheckTimeout and FailureConditionLevel
0000211c.00002594::2021/02/24-02:50:02.452 ERR [RES] SQL Server Availability Group <SQL19AGN1>: [hadrag] Resource Alive result 0.
In the SQL Server error log, within seconds of the health check time-out, SQL Server reports that it detected severe I/O latency:
2021-02-23 20:49:54.64 spid12s SQL Server has encountered 1 occurrence(s) of I/O requests taking longer than 15 seconds to complete on file [C:\Program Files\Microsoft SQL Server\MSSQL15.MSSQLSERVER\MSSQL\DATA\agdb_log.ldf] in database id 12. The OS file handle is 0x0000000000001594. The offset of the latest long I/O is: 0x000030435b0000. The duration of the long I/O is: 26728 ms.
Review the system event log for possible system clues that could be related to the health check time-out event. When you review the Windows system event log, you might find an I/O issue that's reported at the same time for the same health check time-out:
02/23/2021,08:50:16 PM,Warning,SQL19AGN1.CSSSQL.local.local,<...>,"Reset to device, \Device\<device ID>, was issued."
02/23/2021,08:50:16 PM,Warning,SQL19AGN1.CSSSQL.local.local,<...>,"The IO operation at logical block address <block address> for Disk 6 (PDO name: \Device\<device ID>) was retried."
SQL Server health: An Always On health event
Always On monitors different kinds of SQL Server health events. While it hosts an availability group primary replica, SQL Server continuously runs sp_server_diagnostics that reports on SQL Server health by using different components. When any health problems are detected, sp_server_diagnostics reports an error for that particular component, and then sends the results back to the Always On health detection process. When an error is reported, the Availability Group role shows the failed state and possible failover if the availability group is configured to do this.
Symptoms
Here's an example of a SQL Server health issue as reported by sp_server_diagnostics in the cluster log. SQL Server reports an "error" state in the system component to Always On health monitoring, and the "contoso-ag" availability group is transitioned to a failed state.
Note
A SQL Server health issue generates a similar report to that of health check time-out. Both health events report Availability Group is not healthy with given HealthCheckTimeout and FailureConditionLevel. The distinction for a SQL Server health event is that it reports that the SQL Server component changed from "warning" to "error."
INFO [RES] SQL Server Availability Group: [hadrag] SQL Server component 'system' health state has been changed from 'warning' to 'error' at 2019-06-20 15:05:52.330
ERR [RES] SQL Server Availability Group: [hadrag] Failure detected, the state of system component is error
ERR [RES] SQL Server Availability Group <contoso-ag>: [hadrag] Availability Group is not healthy with given HealthCheckTimeout and FailureConditionLevel
ERR [RES] SQL Server Availability Group <contoso-ag>: [hadrag] Resource Alive result 0.
ERR [RES] SQL Server Availability Group: [hadrag] Failure detected, the state of system component is error
WARN [RHS] Resource contoso-ag IsAlive has indicated failure.
INFO [RCM] HandleMonitorReply: FAILURENOTIFICATION for 'contoso-ag', gen(0) result 1/0.
Diagnose SQL Server health events
The kind of health issue that's reported by SQL Server health should dictate the direction of the root cause analysis.
By default, when you deploy an availability group, the FAILURE_CONDITION_LEVEL is set as three. This activates monitoring of some, but not all SQL Server health profiles. At the default level, Always On triggers a health event when SQL Server produces too many dump files, a write-access violation, or an orphaned spinlock. Setting the availability group up to level four or five will expand the types of SQL Server health issues that are monitored. For more information about the SQL Server health Always On monitors, see Configure a flexible automatic failover policy for an availability group - SQL Server Always On.
To identify the Always On specific health issue, follow these steps:
Open the SQL Server cluster diagnostic extended event logs on the primary replica to the time of the suspected SQL Server health event occurred.
In SSMS, go to File > Open, and then select Merge Extended Event Files.
Select Add.
In the File Open dialog box, navigate to the files in the SQL Server \LOG directory.
Press Control, select the files whose names match
<servername>_<instance>_SQLDIAG_xxx.xel, and then select Open > OK.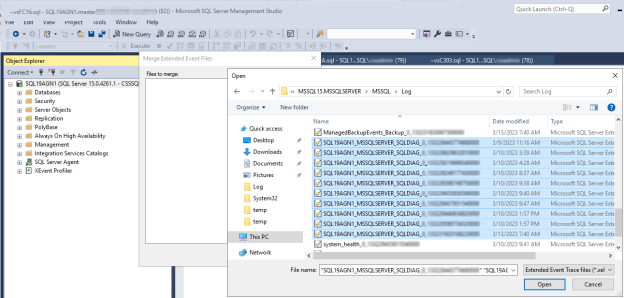
You'll see a new tabbed window in SSMS that includes the extended events, as shown in the following screenshot.
To investigate a SQL Server health issue, locate the
component_health_resultwhosestate_descvalue iserror. Here's an example of a system component event that reported an error back to Always On health monitoring: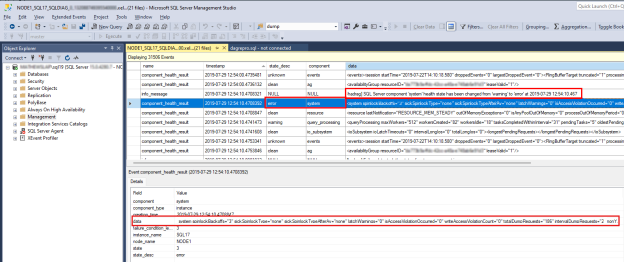
Double-click the data column in the lower pane. This opens the detailed component data in a new SSMS window pane for review. Here's what the system component data looks like:
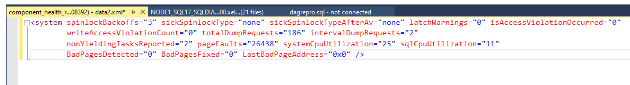
Notice that the 'totalDumprequests=186' data indicates there have been too many dump file diagnostic events generated on this SQL Server. This is the reason that the system component reported an error state. When Always On health monitoring receives this error state, it triggers an availability group health event. You can also verify that no write access violations or orphan spinlocks have been detected from the data provided in the system component data.


Resolution
Depending on the type of problem you discover, you must address it accordingly. As the Configure a flexible automatic failover policy for an availability group - SQL Server Always On article discusses, there could be various issues that lead to this. Examples include:
- The SQL Server service is down.
- Lease timeout.
- The availability replica is in failed state.
- Memory dumps generated by orphaned spinlocks, access violations, or too many memory dumps generated in a short period of time.
- Persistent out-of-memory condition in the SQL Server internal resource pool.
- Detection of Scheduler deadlock.
- Detection of an unsolvable deadlock.
If it's necessary, contact SQL Server support to open a support incident for further assistance in finding the root cause for these internal SQL Server health problems