Note
Access to this page requires authorization. You can try signing in or changing directories.
Access to this page requires authorization. You can try changing directories.
This article provides resolutions to problems related to log send queueing.
What is log send queueing?
Changes that are made to an availability group database on the primary replica (such as INSERT, UPDATE, and DELETE) are written to the transaction log and sent to the availability group secondary replicas. The Log Send Queue defines the number of log records in the log files of the primary database that haven't been sent to the secondary replicas.
Symptoms and effect of log send queueing
Log send queue stores all the vulnerable data
If the primary replica is lost in a sudden disaster, and you fail over to the secondary replica where these changes haven't yet arrived, those changes won't appear in the new primary replica copy of the database. This excludes any changes that are stored when full database and log backups are run.
Growing log send queue causes growing transaction log file growth
For a database that's defined in an availability group, Microsoft SQL Server must retain at the primary replica all transactions in the transaction log that haven't yet been delivered to the secondary replicas. The log send queue represents the quantity of logged changes at the primary replica that can't be truncated during normal log truncation events (for example, during a database log backup). A large and growing log send queue can exhaust free space on the drive that hosts the database log file or can exceed the configured maximum transaction log file size. For more information, see Error 9002 when transaction log is large.
Various diagnostic features report availability group log send queueing
The Always On dashboard in the SQL Server Management Studio reports on log send queueing. It might report that the availability group is unhealthy.
How to check for log send queueing
Log send queue is a per-database measurement. You can check this value by using the Always On dashboard on the primary replica or by using the sys.dm_hadr_database_replica_states Dynamic Management Views (DMV) on the primary or secondary replica. Performance Monitor counters are used to check for log send queueing against the secondary replica.
The next several sections provide methods to actively monitor your availability group database log send queue.
Query sys.dm_hadr_database_replica_state
The sys.dm_hadr_database_replica_states DMV reports a row for each availability group database. One column in that report is log_send_queue_size. This value is the log send queue size in kilobytes (KB). You can set up a query such as the following query to monitor any trend in the log send queue size. The query is run on the primary replica. It uses the is_local=0 predicate to report the data for the secondary replica, where log_send_queue_size and log_send_rate are relevant.
WHILE 1=1
BEGIN
  SELECT drcs.database_name, ars.role_desc, drs.log_send_queue_size, drs.log_send_rate,
ars.recovery_health_desc, ars.connected_state_desc, ars.operational_state_desc, ars.synchronization_health_desc, *
  FROM sys.dm_hadr_availability_replica_states ars JOIN sys.dm_hadr_database_replica_cluster_states drcs ON ars.replica_id=drcs.replica_id
  JOIN sys.dm_hadr_database_replica_states drs ON drcs.group_database_id=drs.group_database_id
  WHERE ars.role_desc='SECONDARY' AND drs.is_local=0
  waitfor delay '00:00:30'
END
Here's what the output looks like.

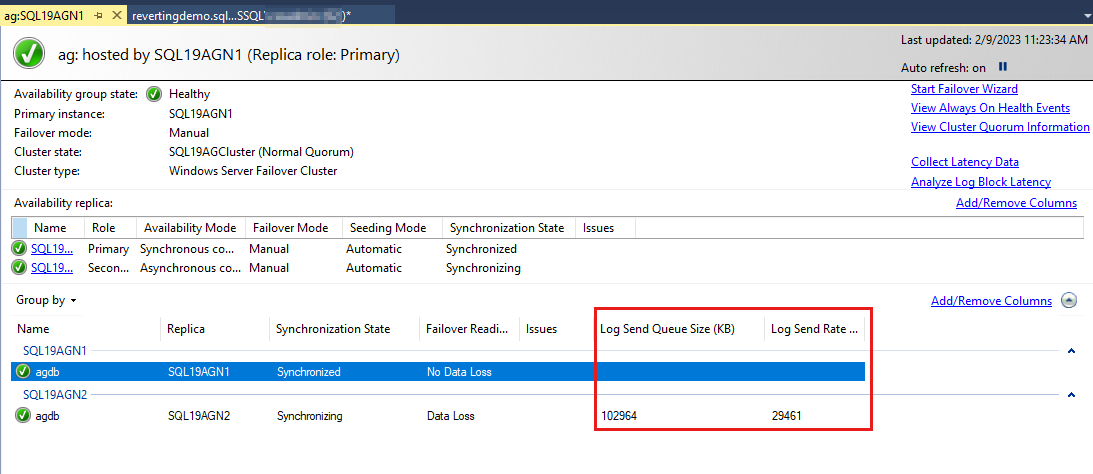
Review the log send queue in Always On dashboard
To review the log send queue, follow these steps:
Open the Always On dashboard in SQL Server Management Studio (SSMS) by right-clicking on an availability group in SSMS Object Explorer.
Select Show Dashboard.
The availability group databases are listed last, and there's some data reported on the databases. Although Log Send Queue Size (KB) and Log Send Rate (KB/sec) aren't listed by default, you can add them to this view, as shown in the screenshot in the next step.
To add these columns, right-click the availability group database column header, and select from the list of available columns.
To Add Log Send Queue Size, right-click the header that's shown as highlighted in red in the following screenshot.
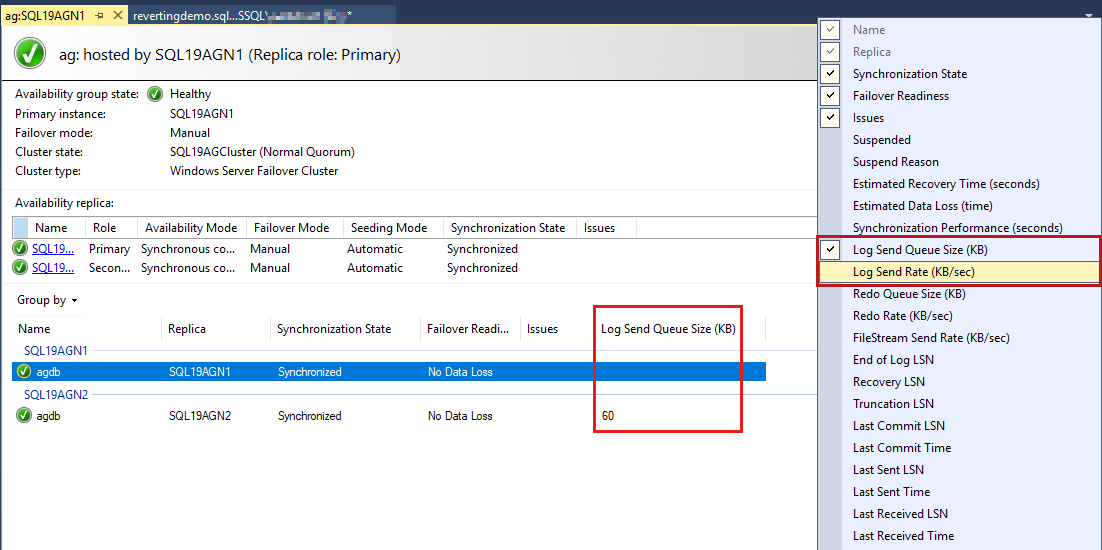
By default, the Always On dashboard auto refreshes this data every 60 seconds.


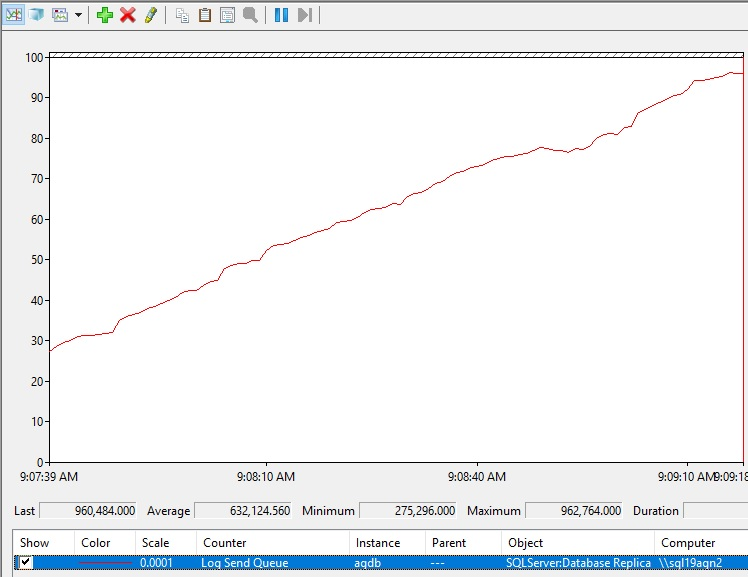
Review the Log Send Queue in Performance Monitor
The log send queue is specific to each secondary replica database. Therefore, to review the log send queue of an availability group database, follow these steps:
Open Performance Monitor on the secondary replica.
Select the Add (counter) button.
Under Available counters, select the SQLServer:Database Replica and Log Send Queue counters.
In the Instance list box, select the availability group database that you want to check for log send queueing.
Select Add and OK.
Here's what increasing log send queueing might look like.

Interpreting log send queuing values
This section explains how to interpret the values of the log send queue size.
When is log send queuing bad? How much log send queuing should be tolerated?
You might assume that if the log send queue is reporting a value of 0, this means that no log send queuing is occurring at the time of that report. However, when your production environment is busy, you should expect to observe the log send queue frequently report a value other than zero even in a healthy AlwaysOn environment. During typical production, you should expect to observe this value fluctuate between 0 and a non-zero value.
If you observe increasing log send queueing over time, further investigation is warranted. This extra activity indicates that something has changed. If you observe a sudden growth in the log send queue, the following measurements are useful for troubleshooting:
- Log Send Rate (KB/sec) (AlwaysOn dashboard)
- sys.dm_hadr_database_replica_states (DMV)
- Database Replica::Mirrored Transactions/sec (Performance Monitor)
Get baseline rates for log send rate and mirrored transactions/sec
During healthy AlwaysOn performance, monitor the log send rate and mirrored transactions/sec values for your busy availability group databases. What do they look like during typically busy business hours? What do they look like during periods of maintenance, when large transactions drive higher transaction throughput on the system? You can compare these values when you observe log send queue growth to help determine what has changed. The workload might be greater than usual. If the log send rate is less than usual, further investigation might be required to determine why.
Workload volumes matter
When you have large workloads (such as an UPDATE statement against 1 million rows, an index rebuild on a 1-terabyte table, or even an ETL batch that's inserting millions of rows), you should expect to see some log send queue growth, either immediately or over time. This is expected when a large number of changes are made suddenly in the availability group database.
How to diagnose log send queueing
After you identify log send queueing for a specific availability group database, you should check for several different possible root causes of the problem, as discussed in the following sections.
Important
For meaningful wait type output, check for an increase in the log send queue by using one of the methods that are described in the previous sections when you monitor for the following conditions.
System is too busy
Check whether the workload on the primary replica is overloading the system's CPUs. If you see an increase in the log send queue, query the sys.dm_os_schedulers DMV and monitor for high runnable_tasks_count. This count indicates outstanding tasks that ran at that time.
SELECT scheduler_address, scheduler_id, cpu_id, status, current_tasks_count, runnable_tasks_count, current_workers_count, active_workers_count
FROM sys.dm_os_schedulers
The following table is sample of results. An increase in the runnable_tasks_count value indicates that a large number of tasks are waiting for CPU time.
| scheduler_address | scheduler_id | cpu_id | status | current_tasks_count | runnable_tasks_count | current_workers_count | active_workers_count |
|---|---|---|---|---|---|---|---|
| 0x000002778D 200040 | 0 | 0 | VISIBLE OFFLINE | 1 | 0 | 2 | 1 |
| 0x000002778D 220040 | 1 | 1 | VISIBLE ONLINE | 108 | 12 | 115 | 107 |
| 0x000002778D 240040 | 2 | 2 | VISIBLE ONLINE | 113 | 2 | 123 | 113 |
| 0x000002778D 260040 | 3 | 3 | VISIBLE ONLINE | 105 | 11 | 116 | 105 |
| 0x000002778D 480040 | 4 | 4 | VISIBLE ONLINE | 108 | 15 | 117 | 108 |
| 0x000002778D 4A0040 | 5 | 5 | VISIBLE ONLINE | 100 | 25 | 110 | 99 |
| 0x000002778D 4C0040 | 6 | 6 | VISIBLE ONLINE | 105 | 23 | 113 | 105 |
| 0x000002778D 4E0040 | 7 | 7 | VISIBLE | 109 | 25 | 116 | 109 |
| 0x000002778D 700040 | 8 | 8 | VISIBLE ONLINE | 98 | 10 | 112 | 98 |
| 0x000002778D 720040 | 9 | 9 | VISIBLE ONLINE | 114 | 1 | 130 | 114 |
| 0x000002778D 740040 | 10 | 10 | VISIBLE ONLINE | 110 | 25 | 120 | 110 |
| 0x000002778D 760040 | 11 | 11 | VISIBLE ONLINE | 83 | 8 | 93 | 83 |
| 0x000002778D A00040 | 12 | 12 | VISIBLE ONLINE | 104 | 4 | 117 | 104 |
| 0x000002778D A20040 | 13 | 13 | VISIBLE ONLINE | 108 | 32 | 118 | 108 |
| 0x000002778D A40040 | 14 | 14 | VISIBLE ONLINE | 102 | 12 | 113 | 102 |
| 0x000002778D A60040 | 15 | 15 | VISIBLE ONLINE | 104 | 16 | 116 | 103 |
Solution: If you detect high runnable_task_count, reduce the workload on the system or increase the number of CPUs that are available to the system.
Network latency
This condition is especially common if the secondary replica is physically remote from the primary replica. Multi-site availability groups let customers deploy copies of business data across multiple sites for disaster recovery and reporting. This makes near-real-time changes available to the copies of the production data at remote locations.
If a secondary replica is hosted far from the primary replica, log send queueing can be caused by network latency and an inability to send changes to the remote secondary as fast as they're being produced in the primary replica database.
Important
SQL Server uses a single connection to synchronize changes from the primary to the secondary replicas. Therefore, if a secondary replica is remote, the width of the pipe will not affect how much data SQL Server can send. Instead, this amount is more dependent on the network latency in the pipe (connection speed).
Test for network latency
Check whether flow control settings contribute to network latency
Microsoft SQL Server availability groups use flow control gates to avoid excessive consumption of network resources, memory, and other resources on all availability replicas. These flow control gates don't affect the synchronization health state of the availability replicas. However, they can affect the overall performance of your availability databases, including RPO.
Later versions of SQL Server change the thresholds at which flow control is entered. This can help relieve the effect that flow control has on symptoms such as log send queueing. For more information about flow control and the history of changes to flow control thresholds, see Flow control gates.
You can monitor for flow control by using Performance Monitor to capture data on the primary replica. To monitor database flow control, add SQLServer:Database Replica counters, and select the Database Flow Control Delay and Database Flow Controls/sec counters. In the Instance dialog box, select the availability group database that you want to check for database flow control. To detect and monitor availability replica flow control, add SQLServer:Availability Replica counters, and select the Flow Control Time (ms/sec) and Flow Control/sec counters.
Check whether Congestion Windows Restart contributes to network latency
Network performance issues that cause log send queueing can be triggered by having the Congestion Windows Restart TCP setting set to True. This was the default setting in Windows Server 2016. Make sure that Congestion Window Restart is set to False on Windows servers that host availability group replicas on which log send queueing is observed.
PS C:\WINDOWS\system32> Get-NetTCPSetting | Select SettingName, CwndRestart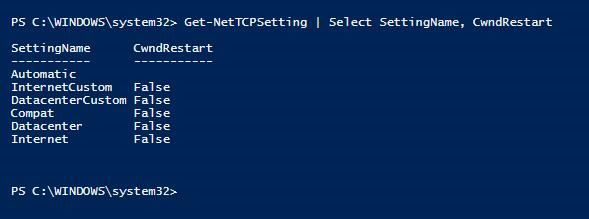
For more information about how to set the TCP Congestion Windows Restart property to False, see Set-NetTCPSetting (NetTCPIP).
Also see Monitor performance for Always On availability groups for information about the synchronization process. This article also shows you how to calculate some of the key metrics, and provides links to some of the common performance troubleshooting scenarios.
Use ping to get a latency sample
At a command line on node1 (primary replica), ping node2 (secondary replica):
C:\Users\customer>ping node2
Pinging node2.customer.corp.company.com [<ip address>] with 32 bytes of data:
Reply from 2001:4898:4018:3005:25f3:d931:2507:e353: time=94ms
Reply from 2001:4898:4018:3005:25f3:d931:2507:e353: time=97ms
Reply from 2001:4898:4018:3005:25f3:d931:2507:e353: time=94ms
Reply from 2001:4898:4018:3005:25f3:d931:2507:e353: time=119ms

Ping statistics for 2<ip address>:
Packets: Sent = 4, Received = 4, Lost = 0 (0% loss),
Approximate round trip times in milli-seconds:
Minimum = 94ms, Maximum = 119ms, Average = 101ms
Test network throughput from primary to secondary using independent tool
Use a tool such as NTttcp to independently detect network throughput between the primary and secondary replicas by using a single connection. Network latency is a common cause for log send queueing. The following steps show how to use an independent tool such as NTttcp to measure the network throughput.
Important
SQL Server sends changes from the primary replica to the secondary replica by using a single connection. In the following section, we configure and run NTttcp to use a single connection (in the same manner as SQL Server) to compare the throughput accurately.
You can download NTttcp from Github - microsoft/ntttcp.
To run NTttcp, follow these steps:
Download and copy the tool to the primary and secondary SQL Server-based servers.
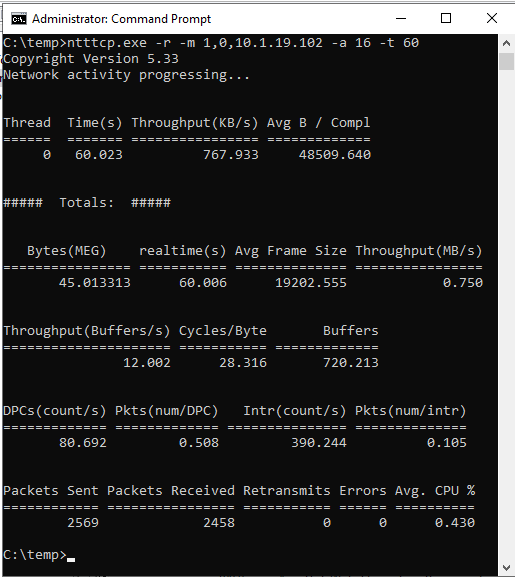
On the secondary replica server, open an elevated command prompt window, change the directory to the NTttcp tool folder, and then run the following command:
ntttcp.exe -r -m 1,0,<secondaryipaddress>-a 16 -t 60Note
In this command,
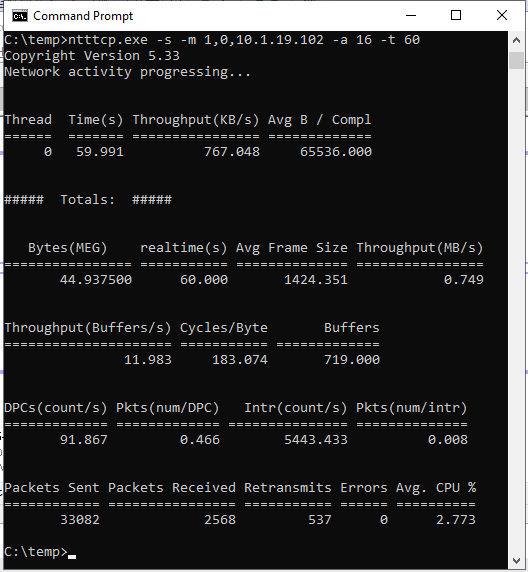
<secondaryipaddress>is a placeholder for the actual IP address of the secondary replica server.On the primary replica server, open an elevated command prompt window, change the directory to the NTttcp tool folder, and then run the following command by again specifying the actual IP address of the secondary replica server:
ntttcp.exe -s -m 1,0,<secondaryipaddress>-a 16 -t 60The following screenshots show NTttcp running on the secondary and primary replicas. Because of network latency, the tool can send only 739 KB/sec of data. That is what you can expect SQL Server to be able to send.
NTttcp on Secondary Replica
NTttcp on Primary Replica
Review Performance Monitor counters
Verify what NTttcp reports. A large transaction is run in SQL Server on the primary replica. After you start Performance Monitor on the primary replica, add the Network Interface::Bytes Sent/sec counter. This counter confirms that the primary replica can send about 777 KB/sec of data. This is similar to the value of 739 KB/sec that's reported by the NTttcp test.

It's also useful to compare the SQL Server::Databases::Log Bytes Flushed/sec value on the primary replica to SQL Server::Database Replica::Log Bytes Received/sec for the same database on the secondary replica. On an average, we observe ~20 MB/sec of changes that's created in the "agdb" database. However, the secondary replica is receiving, on average, only 5.4 MB of changes. This will cause log send queueing on the primary replica of outstanding changes in the database transaction log that haven't yet been sent to the secondary replica.
Primary Replica Log Bytes Flushed/sec for the "agdb" database

Secondary Replica Log Bytes Received/sec for the database agdb
