Note
Access to this page requires authorization. You can try signing in or changing directories.
Access to this page requires authorization. You can try changing directories.
This article provides resolutions to problems related to recovery queueing.
What is recovery queueing?
Changes that are made to the primary replica in an availability group database are sent to all secondary replicas that are defined in the same availability group. After those changes arrive at the secondary replicas, they're first written to the transaction log file of the availability group database. Microsoft SQL Server then uses the recovery or redo operation to update the database files.
If the changes to an availability group arrive and harden on the database transaction log file faster than they can be recovered, a recovery queue is formed. This queue is composed of hardened transaction log transactions that weren't recovered and restored to the database.
Symptoms and effect of recovery (redo) queueing
Querying primary and secondary replicas returns different results
Read-only workloads that query secondary replicas might query stale data. If recovery queueing occurs, changes to data on the primary replica database might not be reflected in the secondary database when you query the same data.
Although changes arrive at the secondary database and are written to the database log file, the changes won't be queried until they're recovered and restored to the database files. The recovery operation is what makes those changes readable.
For more information, see the Data latency on secondary replica section of "Differences between availability modes for an Always On availability group."
Failover time is longer or RTO is exceeded
Recovery Time Objective (RTO) is the maximum database downtime that an organization can handle. RTO also describes how quickly the organization can regain access to the database after an outage. If substantial recovery queueing is present on a secondary replica when a failover occurs, recovery might take longer than the RTO. After recovery, the database will transition to the primary role and represent the state of the database that existed before the failover. A longer recovery time can delay how quickly production resumes after a failover.
Various diagnostic features report availability group recovery queueing
In the case of recovery queueing, the Always On dashboard in SQL Server Management Studio (SSMS) might report an unhealthy availability group.
How to check for recovery (redo) queueing
Recovery queue is a per-database measurement that can be checked by using the Always On dashboard on the primary replica or by using the sys.dm_hadr_database_replica_states Dynamic Management View (DMV) on the primary or secondary replica. Performance Monitor counters check recovery queueing and recovery rate. These counters must be checked against the secondary replica.
The next several sections provide methods to actively monitor your availability group database recovery queue.
Query sys.dm_hadr_database_replica_states
The sys.dm_hadr_database_replica_states DMV reports a row for each availability group database. One column in the report is redo_queue_size. This value is the recovery queue size as measured in kilobytes. You can set up a query that resembles the following query to monitor any trend in the recovery queue size every 30 seconds. The query is run on the primary replica. It uses the is_local=0 predicate to report the data for the secondary replica, where redo_queue_size and redo_rate are relevant.
WHILE 1=1
BEGIN
SELECT drcs.database_name, ars.role_desc, drs.redo_queue_size, drs.redo_rate,
ars.recovery_health_desc, ars.connected_state_desc, ars.operational_state_desc, ars.synchronization_health_desc, *
FROM sys.dm_hadr_availability_replica_states ars JOIN sys.dm_hadr_database_replica_cluster_states drcs ON ars.replica_id=drcs.replica_id
JOIN sys.dm_hadr_database_replica_states drs ON drcs.group_database_id=drs.group_database_id
WHERE ars.role_desc='SECONDARY' AND drs.is_local=0
waitfor delay '00:00:30'
END
Here is what the output looks like.

Review the recovery queue in Always On Dashboard
To review the recovery queue, follow these steps:
Open the Always On Dashboard in SSMS by right-clicking on an availability group in SSMS Object Explorer.
Select Show Dashboard.
The availability group databases are listed last, and there's some data reported on the databases. Although Redo Queue Size (KB) and Redo Rate (KB/sec) aren't listed by default, you can add them to this view, as shown in the screenshot in the next step.
To add these counters, right-click the header above the database reports, and select from the list of available columns.
To add Redo Queue Size (KB) and Redo Rate (KB/sec), right-click the header that's shown as highlighted in red in the following screenshot.
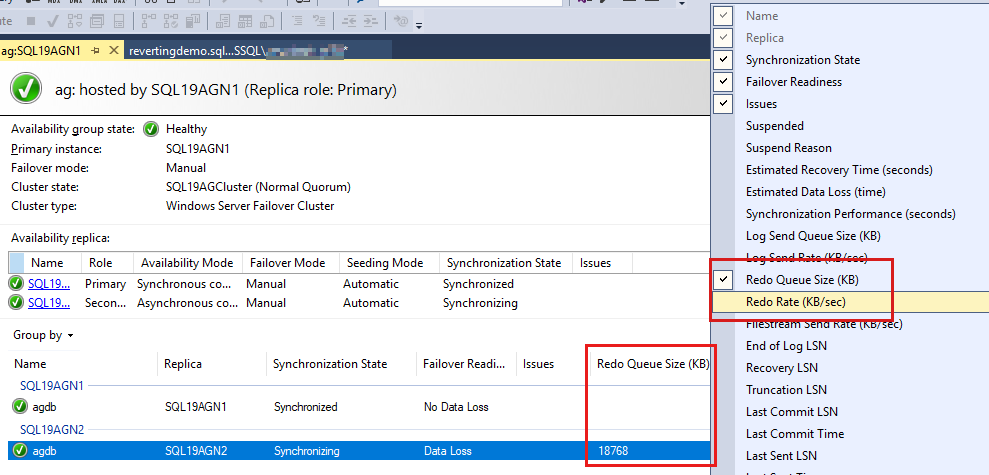
By default, the Always On dashboard auto refreshes Redo Queue Size (KB) and Redo Rate (KB/sec) every 60 seconds.


Review the recovery queue in Performance Monitor
The recovery queue size is unique to each secondary replica and database. Therefore, to review the recovery queue of an availability group database, follow these steps:
Open Performance Monitor on the secondary replica.
Select the Add (counter) button.
Under Available counters, select SQLServer:Database Replica, and then select Recovery Queue and Redone Bytes/sec counters.
In the Instance list box, select the availability group database that you want to monitor for recovery queueing.
Select Add > OK.
Here's what increasing recovery queueing might look like.


Interpreting recovery queueing values
This section explains how you can interpret the values that are related to recovery queueing that you determined in the previous section.
When is recovery queueing a problem? How much recovery queueing should you tolerate?
You might assume that if the recovery queue is reporting a value of 0, this means that no recovery queuing is occurring at the time of that report. However, when your production environment is busy, you should expect to observe the recovery queue frequently report a value other than zero even in a healthy AlwaysOn environment. During typical production, you should expect to observe this value fluctuate between 0 and a non-zero value.
If you observe increasing recovery queueing over time, further investigation is warranted. This extra activity indicates that something has changed. If you observe a sudden growth in the recovery queue, the following measurements are useful for troubleshooting:
- Log Redo Rate (KB/sec) (AlwaysOn dashboard)
- Redo_rate in the DMV sys.dm_hadr_database_replica_states
Get baseline rates for redo rate
During healthy AlwaysOn performance, monitor the redo rate on your busy availability group databases. What do they look like during typically busy business hours? What are these rates during periods of maintenance, when large transactions (index rebuilds, ETL processes) drive higher transaction throughput on the system? You can compare these values when you observe recovery queue growth to help determine what has changed. The workload might be greater than usual. If the redo rate is lower, further investigation might be required to determine why.
Workload volumes matter
When you have large workloads (such as an UPDATE statement against one million rows, an index rebuild on a 1 terabyte table, or even an ETL batch that's inserting millions of rows), you should expect to see some recovery queue growth, either immediately or over time. This is expected when a large number of changes are made suddenly in the availability group database.
How to diagnose recovery (redo) queueing
After you identify recovery queueing for a specific secondary replica availability group database, connect to the secondary replica, and then query sys.dm_exec_requests to determine the wait_type and wait_time for recovery threads. Here's a query that can run in a loop. You're looking for a high frequency of one or more wait types and even wait times for those wait types. Here's a sample query that runs every second and reports the wait types and wait times for the availability group, "agdb":
WHILE (1=1)
BEGIN
SELECT db_name(database_id) AS dbname, command, session_id, database_id, wait_type, wait_time,
os.runnable_tasks_count, os.pending_disk_io_count FROM sys.dm_exec_requests der JOIN sys.dm_os_schedulers os
ON der.scheduler_id=os.scheduler_id
WHERE command IN('PARALLEL REDO HELP TASK', 'PARALLEL REDO TASK', 'DB STARTUP')
AND database_id= db_id('agdb')
waitfor delay '00:00:05.000'
END
Important
For meaningful wait type output, recovery queueing should be observed to be increasing when you use one of the methods that are described earlier to monitor this condition.
In this example, some I/O-related wait types are reported (PAGEIOLATCH_UP, PAGEIOATCH_EX). Monitor to check whether these wait types continue to have the largest wait_times values, as reported in the next column.

SQL Server redo wait types
When a wait type is identified, review the following article SQL Server 2016/2017: Availability group secondary replica redo model and performance - Microsoft Tech Community as a cross-reference for common wait types that cause recovery queueing, and for help to resolve the problem.
Blocked redo threads on secondary reporting servers
If your solution directs reporting (querying) against availability group databases on the secondary replica, these read-only queries acquire schema stability (Sch-S) locks. These Sch-S locks can block redo threads from acquiring schema modification (Sch-M) locks (also known as "schema modify locks" or LCK_M_SCH_M) to make any data definition language (DDL) changes, such as ALTER TABLE or ALTER INDEX. A blocked redo thread can't apply log records until it's unblocked. This can cause recovery queueing.
To check for historical evidence of a blocked redo, open the AlwaysOn_health Xevent trace files on the secondary replica by using SSMS. Look for lock_redo_blocked events.

Use Performance Monitor to actively monitor blocked redo impact to recovery queue. Add the SQL Server::Database Replica::Redo blocked/sec and SQL Server::Database Replica::Recovery Queue counters. The following screenshot shows an ALTER TABLE ALTER COLUMN command that's run against the primary replica while a long-running query is run against the same table on the secondary replica. The Redo blocked/sec counter indicates that the ALTER TABLE ALTER COLUMN command is run. While the long-running query is running on the same table on the secondary replica, any subsequent changes on the primary will cause an increase in the recovery queue.

Monitor for the schema modification lock wait type that the redo thread tries to acquire. To do this, use the query that was described earlier to check the wait types that are reported for redo operations against sys.dm_exec_requests. You can observe the increasing wait time for the LCK_M_SCH_M in the ongoing redo blockage.

Single-threaded redo
SQL Server introduced parallel recovery for secondary replica databases in Microsoft SQL Server 2016. If you're experiencing recovery queueing when you run SQL Microsoft Server 2012 or Microsoft SQL Server 2014, you can upgrade to a later version of the program to improve redo performance in your production environment.
A single-threaded redo can occur in even later, more advanced SQL Server versions in which parallel recovery architecture is used. In these versions, a SQL Server instance can use up to 100 threads for a parallel redo. Depending on the numbers of processors and availability group databases, parallel redo threads are allocated up to a maximum of 100 total threads. If the 100-thread redo limit is reached, some databases in the availability group are assigned a single redo thread.
To determine whether your availability group database is using parallel recovery, connect to the secondary replica, and use the following query to determine the number of rows (threads) that apply recovery for the availability group database. In the following example, if the "agdb" database is a single thread, and its command is DB STARTUP, the recovery workload might benefit from parallel recovery.
SELECT db_name(database_id) AS dbname, command, session_id, database_id, wait_type, wait_time,
os.runnable_tasks_count, os.pending_disk_io_count FROM sys.dm_exec_requests der JOIN sys.dm_os_schedulers os
ON der.scheduler_id=os.scheduler_id
WHERE command IN ('PARALLEL REDO HELP TASK', 'PARALLEL REDO TASK', 'DB STARTUP')
AND database_id= db_id('agdb')

If you verify that your database uses a single-threaded redo, review the algorithm that was described earlier to determine whether SQL Server is exceeding the number of 100 worker threads that are dedicated for parallel recovery. Such a condition might be the reason that the "agdb" database is using only a single thread for recovery.
SQL Server 2022 now uses a new parallel recovery algorithm so that worker threads are assigned for parallel recovery based on the workload. This eliminates the chance that a busy database will remain in a single-threaded recovery. For more information, see the Thread Usage by Availability Groups section of "Prerequisites, Restrictions, and Recommendations for Always On availability groups."