Note
Access to this page requires authorization. You can try signing in or changing directories.
Access to this page requires authorization. You can try changing directories.
This article helps you measure and compare memory consumption between identical server environments. The goal is to reach Data-Based Conclusions (DBC) by establishing a baseline, collecting data over the same period, and ensuring that systems have the same workload.
Prerequisites
- Create Performance Monitor data collector sets on both servers.
- Ensure that you can collect data traces from each server environment.
- Understand different user workloads and their impacts on resource usage.
Quick workaround: Restart the servers
- Restart both servers to clear any memory usage.
- Monitor memory consumption for a predefined period after the reboot.
Measure the memory performance
Establish a baseline with a vanilla installation
Perform a vanilla installation on one server. Collect an eight-hour Performance Monitor trace during a normal working day.
Collect data from systems
During the same period as the vanilla installation, collect an eight-hour Performance Monitor trace from two additional systems, designated as client A and client B.
Ideally, we have the following three data sets from the same period for comparison:
- Vanilla
- Client A
- Client B
Analyze user workload impact
- Identify the workload type (Light, Medium, Heavy, or Power) for each environment.
- Use the examples provided in the session host virtual machine sizing guidelines to categorize user workloads.
- Light: Basic data entry tasks (for example, database entry applications).
- Medium: Tasks such as market research using static web pages and Microsoft Word.
- Heavy: Software development involving dynamic web pages, Microsoft Outlook, and PowerPoint.
- Power: Graphic design or 3D modeling with photo or video editing tools.
- Use the following performance counter objects to compare the activity on the system:
- Memory
- CPU
- Disk Activity
- Number of Processes
- Number of Sessions
Compare key performance counters for memory
- Available MBytes: Remaining free RAM
- % Committed Bytes In Use: Allocated physical resources
- Pool Paged Bytes: Kernel memory that can be paged out
- Pool Nonpaged Bytes: Kernel memory that can't be paged out
- Cache Bytes: Disk usage kernel memory
- Working Set: Active process memory in RAM
Different workloads affecting resource usage
Different user workloads lead to varying requirements for physical resources like CPU, RAM, and storage.
Solution: Standardize user behavior based on data collection
Identify similar usage patterns across all traces collected from the vanilla installation, client A, and client B.
Ensure workloads are comparable by reviewing performance counters under similar conditions:
| Counter | Vanilla installation | Client A | Client B |
|---|---|---|---|
| % Committed Bytes In Use | X% | Y% | Z% |
| Available MBytes | X | Y | Z |
| Process\Working Set (_Total) | X | Y | Z |
Address discrepancies by adjusting resource allocations or optimizing applications accordingly.
Scenario guide: Compare systems using the performance counters
Use tables to compare the three systems (vanilla, client A, and client B) by using the counters mentioned in the previous sections.
| Counter | Vanilla installation | Client A | Client B |
|---|---|---|---|
| % Committed Bytes In Use | 28.5% | 42.7% | 83% |
| Available MBytes (Min) | 10.8 GB | 7.5 GB | 2.6 GB |
| Working Set (_Total) (Max) | 5.2 GB | 8.7 GB | 15.8 GB |
The result seems to confirm a different user load behavior. The result can also be confirmed by checking the number of processes:
| Counter | Vanilla installation | Client A | Client B |
|---|---|---|---|
| System\Processes (Max) | 199 | 268 | 338 |
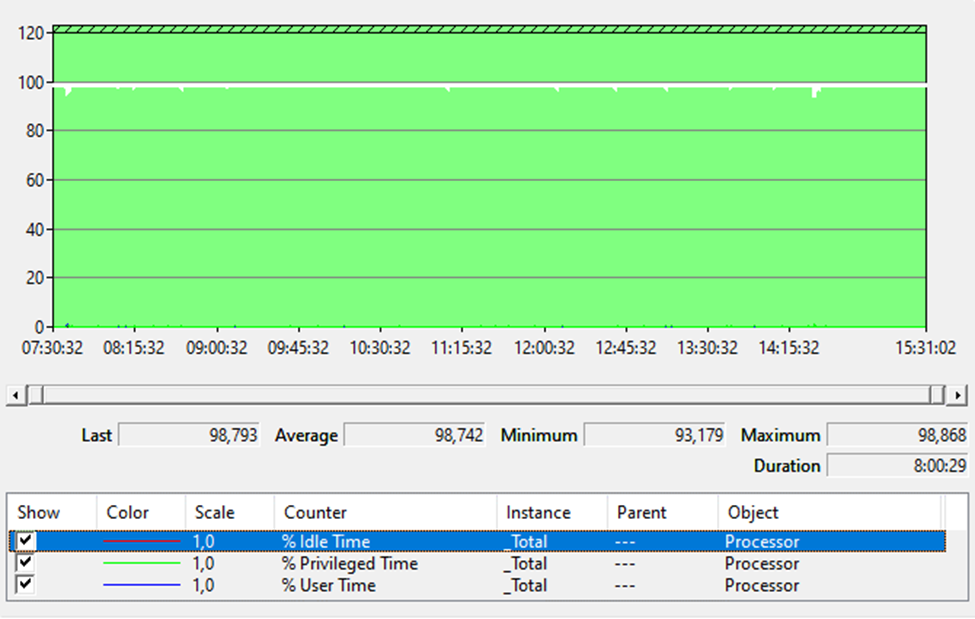
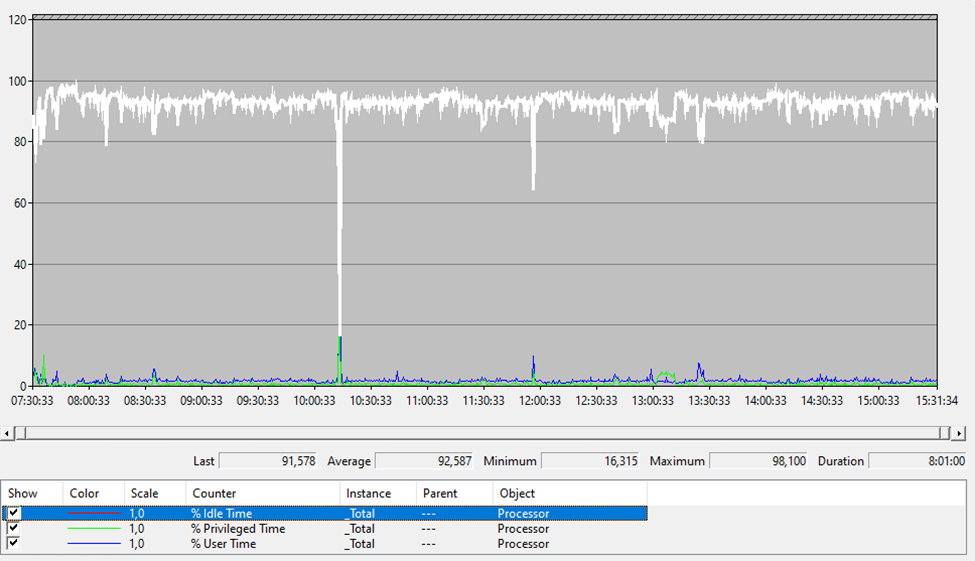
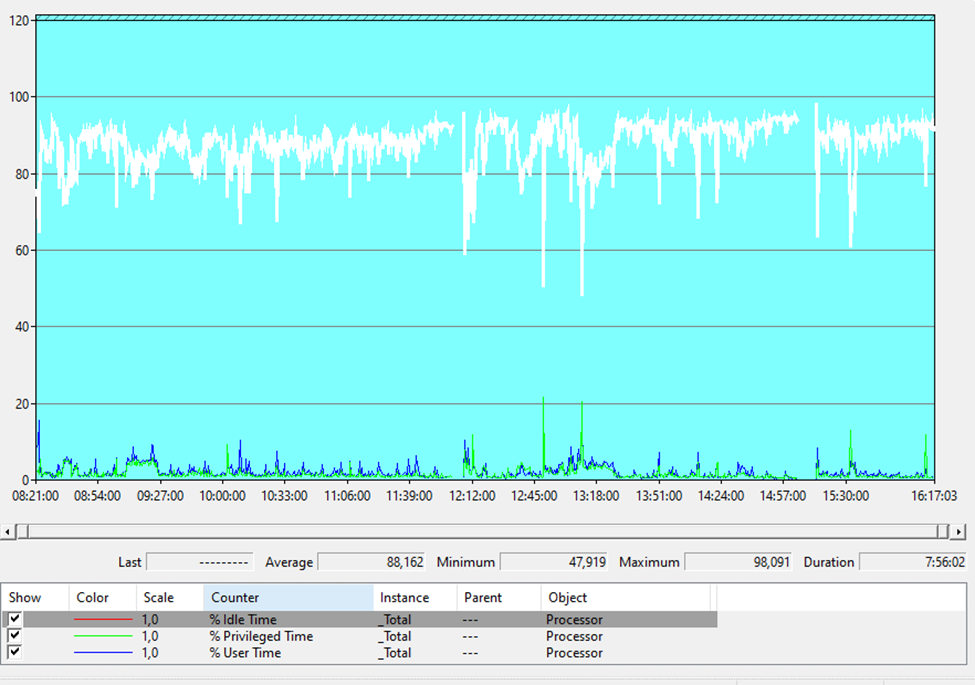
For further confirmation, you can use the CPU usage counter, Processor\% Idle Time (_Total), to identify a different user load pattern. Here are screenshots of some samples (the first is for the vanilla installation, the second is for client A, and the third is for client B).
Vanilla:
Client A:
Client B:
If you want to drill further down on user load behavior, try to check the following processes:
- Outlook
- Office
- Teams (and with the Teams process, there are
msedgewebview2processes) - Microsoft Edge
- Non-Microsoft browsers
Data collection
If you still need help from Microsoft Support for further analysis and guidance, contact us with comprehensive logs.
To prepare detailed logs of all performance counters across extended periods, follow these steps:
Make sure to record the same time and duration if you wish to compare.
Run the following command to create an eight-hour performance data collector set that overwrites itself:
Logman.exe create counter PerfLog-30Sec-%ComputerName% -o "c:\perflogs\%computername%_PerfLog-30sec.blg" -f bincirc -v mmddhhmm -max 800 -c "Hyper-V Dynamic Memory Balancer (*)\*" "Hyper-V Hypervisor Virtual Processor(*)\*" "Hyper-V Hypervisor Logical Processor(*)\*" "\LogicalDisk(*)\*" "\Memory\*" "\Cache\*" "\Network Interface(*)\*" "\Paging File(*)\*" "\PhysicalDisk(*)\*" "\Processor(*)\*" "\Processor Information(*)\*" "\Processor Performance(*)\*" "\Process(*)\*" "\Redirector\*" "\Server\*" "\System\*" "\Server Work Queues(*)\*" "\Terminal Services\*" -si 00:00:30You still need to start the data collector set manually.