Note
Access to this page requires authorization. You can try signing in or changing directories.
Access to this page requires authorization. You can try changing directories.
This scenario guide explains how to use Performance Monitor to collect data, and how to use the data to narrow down the bottleneck that makes the computer slow. It introduces general approaches and tries to explain the troubleshooting concepts.
Use Performance Monitor to record performance data
Every full version of Windows comes with an inbox tool called Performance Monitor. You can utilize this tool to track performance-related information about various aspects of the Windows system by using performance counters built into Windows, which provide us with more information on central processing unit (CPU) usage or memory usage.
Every counter is constructed in the same simple way:
[Performance counter object]\<Instance>\<Counter Name>
For example:
[Processor Information]\<CPU 0\>\% Processor Time
To store the performance data provided by the counters, you can use the Data collector Sets in Performance Monitor. See the following screenshot:
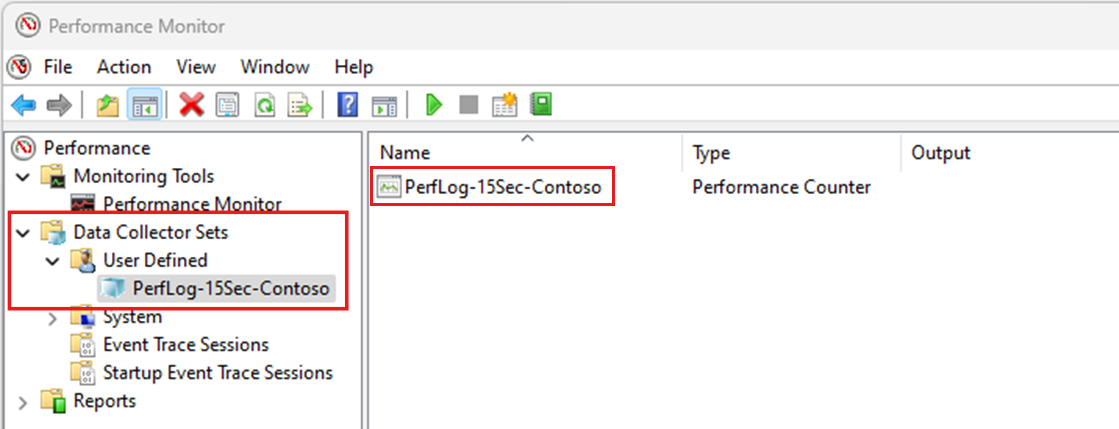
To create those Data Collector Sets, you can use the graphical user interfaces (GUI) or the logman.exe command.
To create a data collector set, run the following command in an elevated command prompt window:
logman.exe create counter PerfLog-15Sec-Contoso -o "c:\perflogs\Contoso_PerfLog-15sec.blg" -f bincirc -v mmddhhmm -max 800 -c "Hyper-V Dynamic Memory Balancer (*)\*" "Hyper-V Hypervisor Virtual Processor(*)\*" "Hyper-V Hypervisor Logical Processor(*)\*" "\LogicalDisk(*)\*" "\Memory\*" "\Cache\*" "\Network Interface(*)\*" "\Paging File(*)\*" "\PhysicalDisk(*)\*" "\Processor(*)\*" "\Processor Information(*)\*" "\Processor Performance(*)\*" "\Process(*)\*" "\Process V2(*)\*" "\Redirector\*" "\Server\*" "\System\*" "\Server Work Queues(*)\*" "\Terminal Services\*" -si 00:00:15
To start the counter, run the following command in an elevated command prompt window:
logman.exe start PerfLog-15Sec-Contoso
This command generates a "flight box recorder"-like monitor on your system. The monitor logs performance data every 15 seconds (see -si 00:00:15 for the interval). Each time the collector set is started, the impact on the system should be less than 1%, and it won't use more than 800 megabytes (MB) of space on your local hard disk. If you restart the computer, you need to run the command to start the monitor again.
To stop the counter, run the following command in an elevated command prompt window:
logman.exe stop PerfLog-15Sec-Contoso
The data collector set also follows the principle of [Performance counter object]\<Instance>\<Counter Name>. The counter object is called "Memory," as this object doesn't have an instance. The reason is that there is one memory in Windows, but there might have more than one hard disk or CPU.
You now have a data collector set that logs data every 15 seconds. 15 seconds is chosen because of a limitation of the tool used to analyze the data: Performance Monitor.
A maximum of 1,000 data points can be displayed within a graph. If the data collector is configured to log data every second, the graph can only display the data in 16 minutes and 40 seconds. If there are more data in the log, it starts to "summarize and combine" those data points. The capture is called as a high-density capture.
This might lead to a situation where the graph doesn't show accurate numbers. You can spot that by looking at the graph and comparing it with the Minimum or Maximum values.
In this example, look at the counter % Idle Time of the instance _Total for the counter object Processor. Based on the minimum value, graph should hit the blue line (at 32%), but it is not true. As the number and the graph don't match, you need to verify how many samples there are within the displayed period (22 minutes and 01 seconds). Upon hovering over, a "fly-out" shows how many samples there are in this data point. As you can see, there are 10 samples, and therefore, the tool is forced to summarize and combine them as this was a capture with a one-second interval.

Simplify Windows
Now that you have the performance counter log, let's try to simplify Windows in a way that helps the analysis. To do this, break down the system into its logical components: memory, storage, CPU, and network.
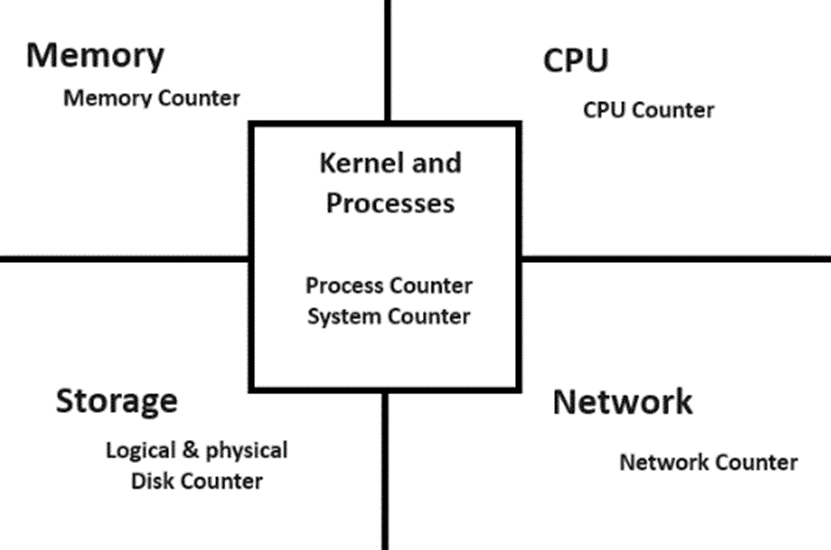
In addition to mapping some performance monitor objects to the physical resource, it's important to remember that Windows is divided into two major areas: Kernel and User mode.
Kernel refers to the operating system (OS) and drivers (this also includes your antivirus filter driver). The kernel is represented in Windows by a logical construct called System Process, which always has the process ID 4. For security reasons, this area is strongly protected. Even with inbox tools like Performance Monitor, only a little information can be gotten from it. For example, you can see how much nonpaged pool is in using, but there's no information about who's using it.
User mode is where all applications (modern Appx, services, and executables) runs. With Performance Monitor, you can get information about each process.
Introduce the 18 most important counters
To simplify, the following sections introduce the 18 most important counters and their thresholds, broken down by the physical resources they're related to.
Storage
| Primary counters | Healthy | Warning | Critical |
|---|---|---|---|
| \LogicalDisk(*)\Avg. Disk sec/Read | < 15 ms | > 25 ms | > 50 ms |
| \LogicalDisk(*)\Avg. Disk sec/Write | < 15 ms | > 25 ms | > 50 ms |
| \PhysicalDisk(*)\Avg. Disk sec/Read | < 15 ms | > 25 ms | > 50 ms |
| \PhysicalDisk(*)\Avg. Disk sec/Write | < 15 ms | > 25 ms | > 50 ms |
Note
Short spikes can be tolerated. You should investigate longer latency periods (over one minute or longer).
These counters represent latency. Latency is defined by how much time it spends to get the information. From a disk performance perspective, you need to look closer at the setup. For a normal hard disk, instead of a solid-state hard drive (SSD), the disk normally has a rotation speed of 5,400 revolutions per minute (RPM). That means the disk turn the spindle (where the information is stored as blocks) 5,400 times per minute. You should be able to calculate the time it takes to read any block from the disk:
One block / (RPM / 60) = latency for one block
One block / 5400 RPM / 60 = 0.011111 sec = 11 ms
Therefore, in theory, the disk should be able to read any block within 11 ms. If there's a latency of ~100 ms, the disk should be able to read the block at least eight times, so why is there a delay? Is the disk overwhelmed, and if so, who is using it?
To identify who's using it, you can now check the Process counter object.
Process counters related to disk operations:
- \Process(*)\IO Read Operations/sec (process-specific disk read times)
- \Process(*)\IO Write Operations/sec (process-specific disk write times)
You can use those counters and try to correlate the latency or disk usage with the process usage.
Let's move on to the next physical component.
Memory
| Virtual memory and physical memory counters | Healthy | Warning | Critical |
|---|---|---|---|
| \Memory\Pool Paged Bytes | Pool Nonpaged Bytes | 0–50% | 60–80% | 80–100% |
| \Memory\Available MBytes | > 10% or at least 4 gigabytes (GB) free | < 10% | < 1% or less than 500 MB |
| \Memory\% Committed Bytes In Use | 0–50% | 60–80% | 80–100% |
This section describes the following counters:
- Pool Paged Bytes
- Pool Nonpaged Bytes
These counters represent kernel resources shared by the entire system. Even though processes can claim paged and nonpaged pools, this is mainly done by drivers; therefore, the data isn't visible for Performance Monitor. While the paged Pool can be paged out to the page file, the nonpaged pool can't. Remember that those kernel resources depend on the memory (random access memory (RAM)) size you have in the system. The limit of the nonpaged pool is 75% of your RAM, and they directly impact your Available MBytes. Available MBytes is the amount of RAM available to all programs, including the kernel.
To understand the impact of your process on RAM utilization, you can use the following counter:
| Process counter | Comment |
|---|---|
| \Process(*)\Working Set | Try to relate to Available MBytes to identify the top consumer of your RAM. Working Set is defined as the amount of RAM (not the page file) a process uses at any point in time. |
Remember that Memory\% Committed Bytes In Use represents the virtual memory you have in Windows. This is the combination of the page file and RAM, which can be viewed in Task Manager on the Performance tab after selecting Memory:

This system has 128 GB of RAM and a page file of 128 GB, so the Committed memory is 256 GB. You can also glance at the Paged pool and Non-paged pool memory.
When investigating memory issues, remember that both areas (Kernel and User) actually share the same physical resource. Therefore, if the computer has low memory, try to find out who's using it.
Let's move on to the next physical resource.
CPU
When troubleshooting CPU performance, you need to split the OS into Kernel and User mode again. However, the split is easier to understand. The User mode is represented by any application or service, including the applications that run in User mode, which consumes CPU cycles and doesn't involve hardware other than the CPU. If you need to access hardware, this results in Kernel mode as the tool needs to talk to drivers to access GPU, storage, or network.
Here are some examples:
- SQL Server doing a calculation = User mode
- SQL Server writing log files to the disk = Kernel mode
- File Server accessing network shares = Kernel mode
Then, let's look at the primary counters:
| Primary counters | Healthy | Warning | Critical |
|---|---|---|---|
| \Processor Information(*)\% User Time (User mode) | < 50% | 50–80% | > 80% |
| \Processor Information(*)\% Privileged Time (Kernel mode) | < 30% | 30–50% | > 50% |
| \Processor Information(*)\% Idle Time | >20% | >10% | <10% |
Again, short spikes are acceptable, but if you see it for over one minute, start investigating.
Each time a CPU is used, the CPU consumes either % User Time (User mode) or % Privileged Time (Kernel mode). If you encounter a high CPU situation (= low % Idle Time), you need to find out who's using it by looking at the following secondary counters:
| Secondary counters | Comment |
|---|---|
| \Process(*)\% User Time | Remember that you might have more than one active process. |
| *\Process()\% Privileged Time** | Remember that there's only limited information on the system process. The system process is normally the top driver for % Privileged Time as the process hosts drives inside this logical construct. However, it isn't limited to this. |
100% Process\% User Time = one CPU. If you have 16 CPUs, the maximum usage a process can reach is 1600 %. See the following screenshot:

In this example, you have used a tool to simulate CPU usage (% User Time). You have limited the tool to run on only four CPUs (CPUs 12, 13, 14, and 15). Once four threads are active, it becomes clear how all the CPUs reach 100% while the application itself (CPU Stress) reaches 400%. This example demonstrates the relationship between the CPU usage of CPU Stress and the CPU load on the CPUs to which the application has been limited. Establishing this kind of relationship helps fully understand the underlying processes.
This brings us to the last physical object.
Network
Because Performance Monitor is a local tool, you can only get basic information from the network. Nevertheless, the following counters are still useful:
| Primary counters | Healthy | Warning | Critical |
|---|---|---|---|
| \Network Interface(*)\Bytes Total/sec | < 50% | 50–80% | > 80% |
| \Network Interface(*)\Bytes Sent/sec | * | * | * |
| \Network Interface(*)\Bytes Received/sec | * | * | * |
Note
More information for cells marked with star symbols (*): the workload of \Network Interface(*)\Bytes Sent/sec and \Network Interface(*)\Bytes Received/sec should depend on the server's role. For example, the number of bytes sent per second is typically higher than the number of bytes received per second on a streaming server. In contrast, the number of bytes received per second is generally higher than the bytes sent per second on an Backup-Server doing a backup.
The values are related to the speed of the network card, and you need to do the calculation. When doing so, remember that the network speed is measured in bits, and 8 bits = 1 byte. Therefore, if you have a 1-GB network card, your throughput can reach 125 MB/sec.
While the Bytes Total/sec counter helps you understand the overall utilization of your network card, the other two counters can help you know if you're receiving or sending more data. If you have this information, you can compare it with the expected behavior. If you want to investigate your network, a different toolset is needed as you require end-to-end traces from both sides to fully understand the network behavior.
Conclusion
This scenario guide concludes with the breakdown and physical components of a Windows system. When you face a bottleneck on any physical components, your system has problems. And your application is also impacted.
We hope this scenario guide can help you get a basic understanding of Performance Monitor and how to prepare your system for a "black box" capture, like a flight recorder. If you need further help analyzing the data, feel free to contact us by opening a support ticket.