Note
Access to this page requires authorization. You can try signing in or changing directories.
Access to this page requires authorization. You can try changing directories.
This article describes the features of Task Manager and provides examples of how to apply those features when you troubleshoot.
Applies to: All supported versions of Windows Server and Windows Client
Summary
Task Manager is the Windows in-box solution for monitoring application and process performance and resource usage.
More information
Task Manager consists of live data tables and charts that are populated from different data sources in Windows and private APIs. The appearance of Task Manager varies slightly depending on the Windows or Windows Server version. However, the data comes from the same sources. Task Manager displays data on the tabs that are listed in the following table.
| Tab | Data types |
|---|---|
| Processes | List of apps and background processes, and the resource usage of each. |
| Performance | Lists and graphs of performance data. Separate views are available for CPU performance, memory performance, and other performance categories (depending on the computer configuration). |
| Users | List of signed-in users and the processes that run under that user's context. Additional data, such as resource usage for each process, is available. |
| Details | List of the processes that are running on the computer, regardless of whether they're apps or background processes. Additional data is available, including user context, resource usage, and description. |
| Services | List of the services that are running on the computer. The list format resembles that of the Services MMC console (services.msc). On this page, you can stop and start services, or go from this page to the Services console. |
Note
The first time that you open Task Manager, you might see its condensed view. This view resembles the following image.
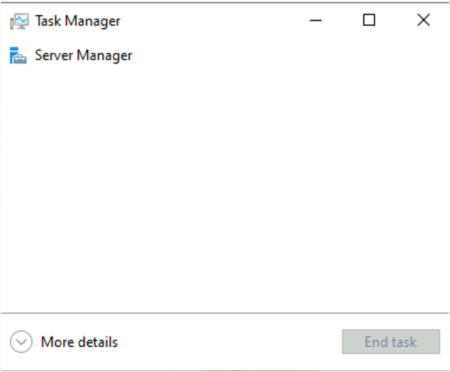
To get the full view, select More details at the bottom of the Task Manager window.
For a general introduction to Task Manager, see Task Manager.
Examples of how to use Task Manager to troubleshoot
Examining CPU load
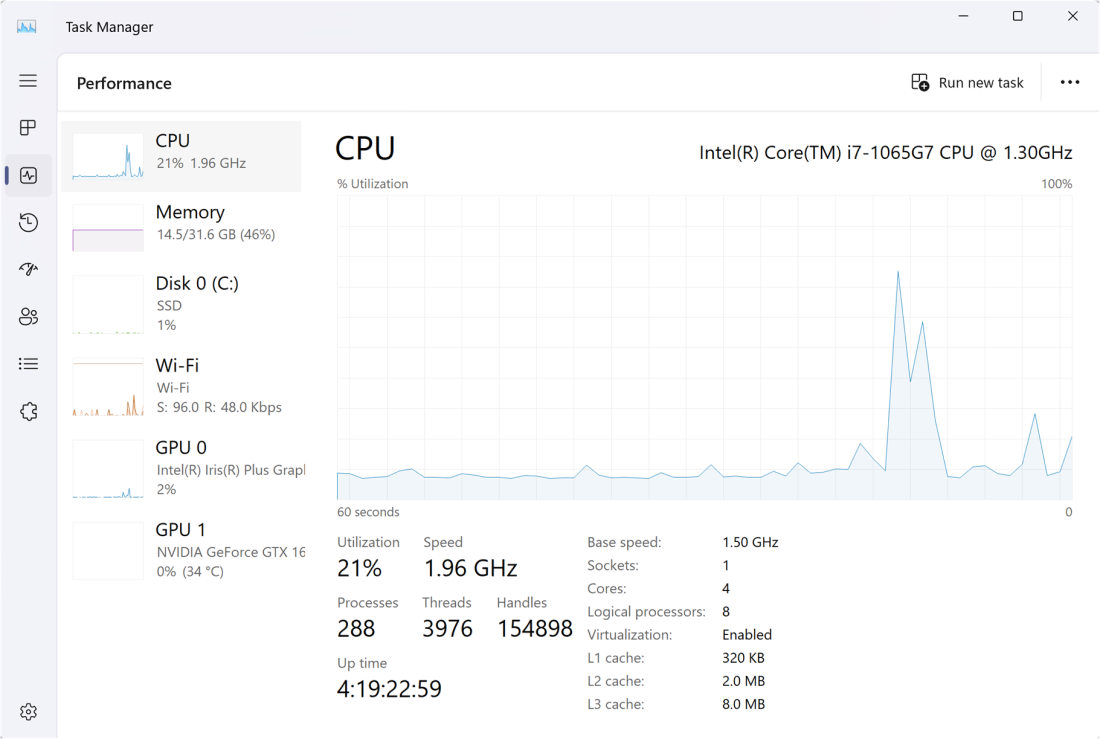
When you use the default view, the Performance tab shows the overall CPU load for the computer, regardless of the number of physical or logical processors.
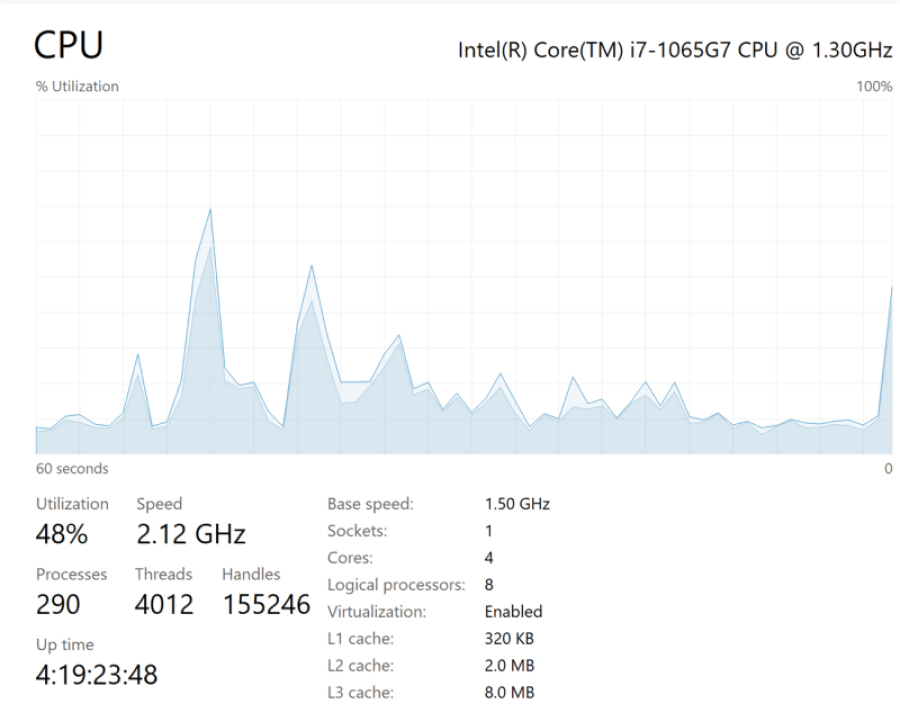
You can break down this data in terms of the load that's produced by kernel processes and the load that's produced by user processes. To do this, right-click the graph, and then select Show kernel times. The trace on the graph splits into two colors, one for kernel processes and one for user processes.
You can also break down the data in terms of the load on each logical processor. For example, on a computer that has eight logical processors, you can calculate the load per processor (at 100 percent capacity) as follows:
100%/8=12.5%
Each processor in this example carries 12.5 percent of the CPU load. Conversely, if a process uses 12.5 percent of the CPU capacity, the process is using the equivalent of one full CPU.
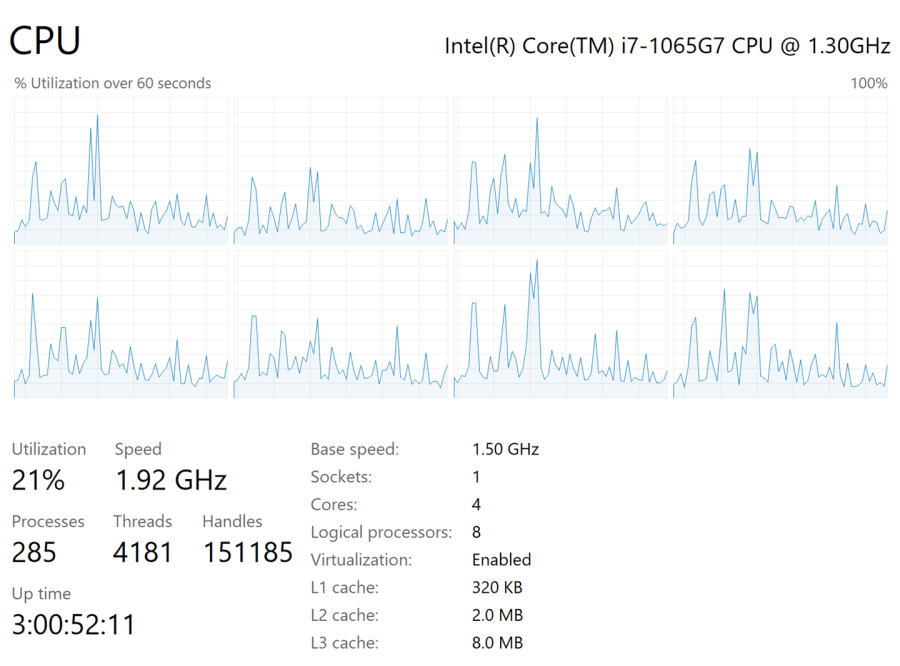
To view more precise load information, right-click the graph, and then select Change graph to > Logical processors. The graph splits into multiple graphs, one for each processor. It shows that different logical processors carry different loads.
Examining process details
You can use the Processes, Users, and Details tabs to view the active processes on the computer. The lists differ in how they sort and group the process information. This example uses the Details tab.
You can change the displayed columns by right-clicking one of the column heads and then selecting Select columns. In the following image, the Threads column is added.

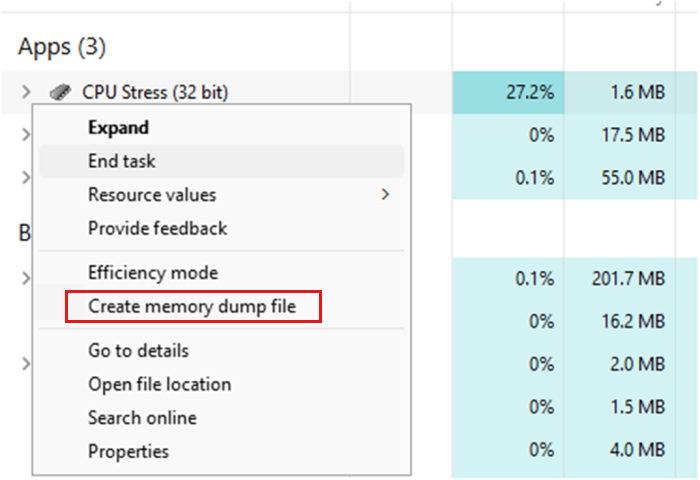
Task Manager doesn't provide details about the individual threads. However, you can dump detailed information about a process to analyze or to provide to your support vendor.
To do this, in any of the process list tabs, right-click the process and then select Create memory dump file.
Examining a wait chain
Many applications and processes depend on other processes and services for standard operation. An unresponsive process might be waiting for other processes to finish or for system resources to become available. In such a case, Task Manager can display this information as a wait chain—a tree that shows process dependencies.
To see the wait chain of a running process, follow these steps:
Select the Details tab, and then select the process. Make sure that the value in the Status column is Running. You can't view the wait chain of a suspended process.
Right-click the process, and then select Analyze wait chain.
If the process is running as usual and isn't waiting for any other processes, Task Manager displays a message that resembles the following message:<Process> is running normally.
Note
In this message, <Process> is the name of the process that you selected.
If the process is waiting on another process, Task Manager displays the wait chain tree.
If an unresponsive process has a wait chain, you might be able to unblock the process by ending one or more dependent processes. To do this, follow these steps:
- In the wait chain tree, select the checkbox next to any process that you want to end.
- Select End process.