Note
Access to this page requires authorization. You can try signing in or changing directories.
Access to this page requires authorization. You can try changing directories.
This article introduces how to identify the source of a Windows Management Instrumentation (WMI) request that causes a computer to shut down.
Symptoms
A computer is shut down unexpectedly. You find event ID 1074 in the System log. The event indicates that the request comes from the WMIPrvSE process:
Log Name:      System
Source:        User32
Date:          <date and time>
Event ID:      1074
Level:         Information
User:          <User>
Computer:      <FQDN>
Description:
The process C:\Windows\system32\wbem\wmiprvse.exe (<computer name>) has initiated the shutdown of computer <computer name> on behalf of user <user> for the following reason: No title for this reason could be found
 Reason Code: 0x80070015
 Shutdown Type: shutdown
 Comment:
Analysis
WMI can shut down a computer by calling the Win32Shutdown method of the Win32_OperatingSystem class. However, the difficulty lies in identifying the source of this request. A script or an application can be deployed to call this method without including the information about where and when it runs.
To troubleshoot unexpected shutdowns caused by WMI, a WMI trace needs to be collected continuously until the behavior occurs. The trace can be collected by enabling the log from Applications and Services Logs > Microsoft > Windows > WMI-Activity > Trace. By default, the log isn't visible in Event Viewer. To view this log, enable the Show Analytic and Debug Logs option from the View menu.
The trace reveals the process ID (PID) and the user from whom the request comes. You'll also need to capture a Process Monitor trace to identify that process.
You can download Process Monitor.
Troubleshooting steps
Preparation
To start the investigation, follow these steps:
Create a folder on the C: drive, such as C:\WMI.
Extract the Process Monitor archive file to the folder.
Create these two batch files in the folder:
StartTrace.bat:
wevtutil sl Microsoft-Windows-WMI-Activity/Trace /e:true /q procmon /Quiet /Minimized /Backingfile %0\..\procmon.pml /LoadConfig %0\..\filter.pmcStopTrace.bat:
procmon /Terminate
wevtutil sl Microsoft-Windows-WMI-Activity/Trace /e:false
wevtutil epl Microsoft-Windows-WMI-Activity/Trace %0\..\WMI-ActivityLog.evtx /ow:true
Create Process Monitor filters
Create a Process Monitor configuration with an event filter to capture only what's needed for this investigation. Follow these steps:
Start Process Monitor.
Select the Reset button in the Process Monitor Filter dialog if it shows up.
Deselect the third button in the toolbar to stop the automatic capture.
Select the Filter menu, and then select the Filter option.
In the Process Monitor Filter dialog, select Operation is, type Process Create, and then select Add.
Also, define another filter by selecting Operation is, typing Process Exit, and then selecting Add.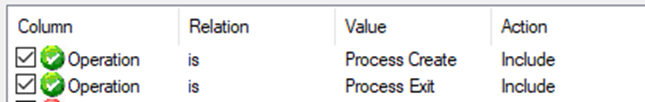
Select OK to confirm the filter configuration.
Select the File menu, select Export Configuration, and then save the C:\WMI\filter.pmc file.
Create a scheduled task
Then, create a scheduled task to stop the capture when the reboot occurs. Follow these steps:
Open Task Scheduler.
Right-click the Task Scheduler Library node, and then select Create Task.
Type a name for the task.
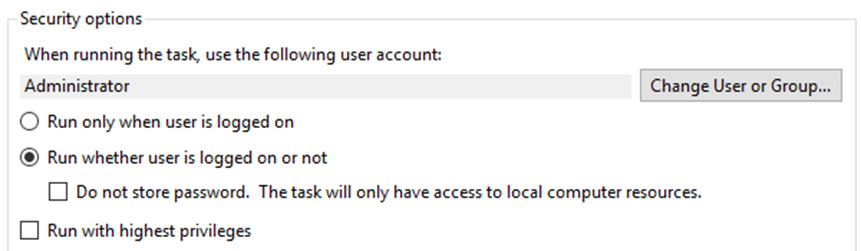
Select the Run whether user is logged on or not option.
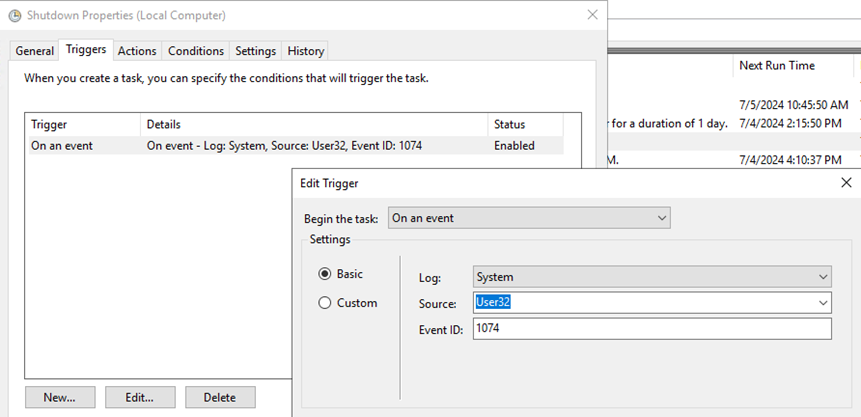
Select the Triggers tab.
- Select New, and then select On an event for the Begin the task option.
- In Log, select System.
- In Source, type User32.
- In Event ID, type 1074.
- Select OK.
Select the Actions tab.
- Select New.
- Keep the default for the Action option: Start a program.
- Select Browse, and then select the StopTrace.bat batch file in the C:\WMI folder.
- Select OK.
Select OK to confirm the task. When you're asked for credentials, provide a user account that's a member of the Administrators group.
Start the capture
Now you're ready for the capture. From an elevated Command Prompt window, go to the C:\WMI folder, and then run StartTrace.bat.
Note
A Process Monitor capture has been started at this point. You'll be able to see the PML file in that folder. Even with a filter defined, the capture is left running for a long time. Multiple PML files will be created, which can consume a lot of this space.
Make sure to monitor the size and number of these PML files. If no unexpected shutdown happens, you may need to stop and restart the trace to clear up old PML files that are no longer needed for the investigation.
When the reboot occurs, the StopTrace.bat batch file is called. The Process Monitor trace capture is stopped, and the WMI trace is saved.
Investigate the trace
After the reboot, follow these steps to conclude the investigation:
Go to the C:\WMI folder and double-click the WMI-ActivityLog.evtx file.
Right-click the log name in the left pane and select Filter Current Log.
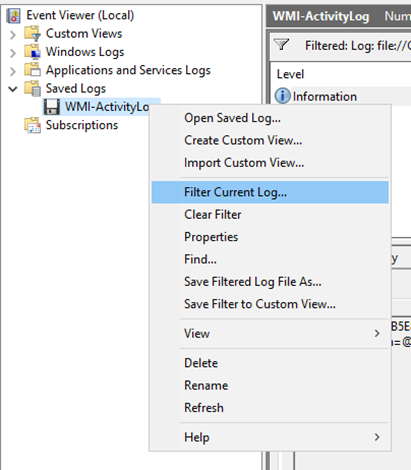
Type 11 in the Includes/Excludes Event IDs text box.
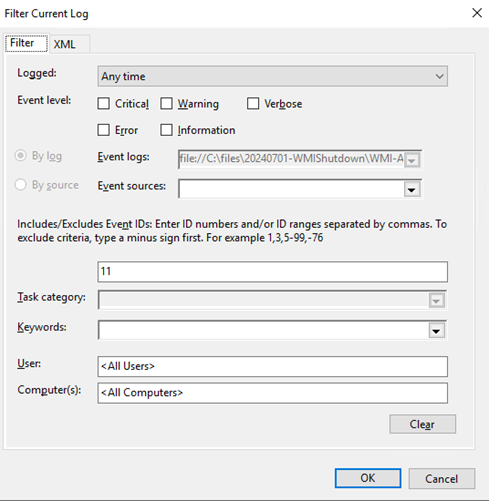
After the filter is applied, the first event at the top should be the one with the shutdown request. If not, select Ctrl+F, and then type shutdown.
Here's a sample of the event log:
Log Name:      Microsoft-Windows-WMI-Activity/Trace
Source:        Microsoft-Windows-WMI-Activity
Date:          <date and time>
Event ID:      11
Level:         Information
User:          SYSTEM
Computer:      <FQDN>
Description:
CorrelationId = {6BE1F66D-CD17-0003-6718-E26B17CDDA01}; GroupOperationId = 11687; OperationId = 11698; Operation = Start IWbemServices::ExecMethod - root\cimv2 : Win32_OperatingSystem=@::Win32Shutdown; ClientMachine = <computer name>; User = <user>; ClientProcessId = 2712; NamespaceName = 133644697772514501
Note the ClientProcessId.
Double-click the procmon.pml file and find the corresponding line with the same PID.
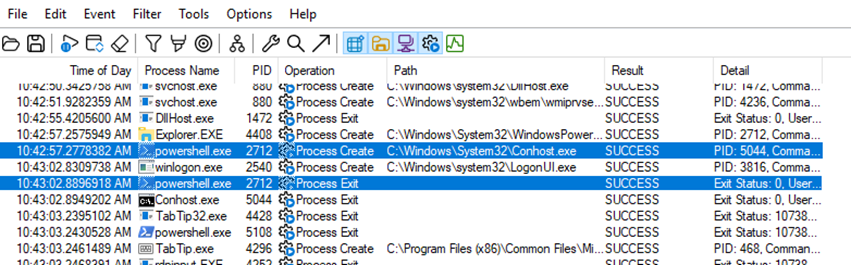
In this example, the shutdown method was called by a PowerShell script.
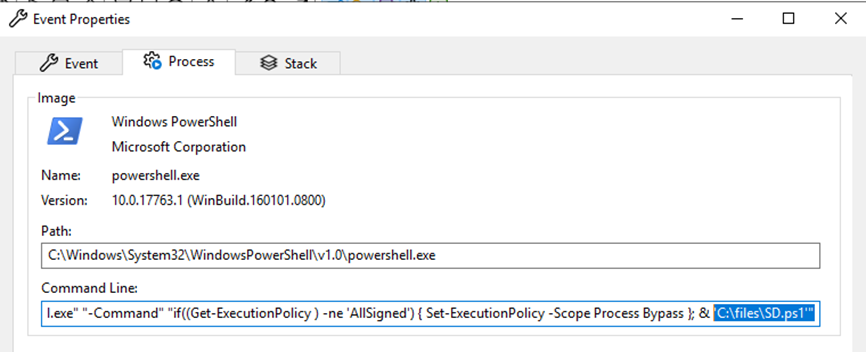
Go to the Process tab, and you can find the path of the script in the Command Line field.
Cleanup
After the investigation is finished, don't forget to reset the Process Monitor configuration:
- Select the File menu, and then select Backing files.
- Select the Use virtual memory option.
- Select OK.