Scenario guide: Troubleshoot WMI performance issues
This article describes different ways to examine memory leaks or handle leaks to solve the Windows Management Instrumentation (WMI) performance issues, and how to gather additional information.
You may experience the following scenarios or issues:
- The machine runs slowly.
- Running commands like
tasklistor opening msinfo32.exe or compmgmt.msc takes a long time to respond or doesn't show appropriate results. - Applications or clients depending on WMI have issues fetching or displaying information, or eventually fail.
- WMI queries fail with errors like WBEM_E_INVALID_CLASS or WBEM_E_NOT_FOUND.
- The WMI service (Winmgmt) isn't responding.
- The total memory of the machine reaches 100%.
You also notice that either svchost.exe (hosting the Winmgmt service) or one of the WmiPrvse.exe processes is consuming high memory or having a high handle count in Task Manager at any given time. If the machine or Winmgmt service is restarted or the problematic WmiPrvse.exe process is ended manually, the high memory situation is mitigated temporarily. However, the issue reoccurs after some time.
Possible causes of a memory leak or handle leak
If the WMI service or WmiPrvse.exe process consumes memory or handles and doesn't decrease or free the handles over time, it's considered a memory leak or handle leak respectively.
The reason for a leak varies depending on the scenarios, but it's generally caused by:
- Problematic, inefficient, or huge WMI queries made by an application or service.
- High frequency of queries.
- Interference of non-Microsoft products.
- The object that's associated with the WMI class being queried.
Although investigating memory or handle leaks requires in-depth analysis of queries and debug dumps of the WMI service or WmiPrvse.exe process, initial troubleshooting steps can help narrow down or solve the issue.
Here's the lifecycle of performing a WMI query:
- The client submits the query.
- The WMI service stores the query as a task in its memory called the "arbitrator buffer memory."
- The WMI service invokes the appropriate WMI provider to execute the query.
- The WMI provider returns the query results to the WMI service and stores the results in the arbitrator buffer.
- The client retrieves the query results.
- The query and the results are deallocated from the arbitrator buffer.
If a WMI service memory or handle leak occurs, the arbitrator buffer may be filled with too many tasks or query results, leaving no more space for other queries.
- If you're using an operating system (OS) version earlier than Windows Server 2016, the WMI service runs under the shared svchost.exe container along with other services.
- If the svchost.exe container is leaking memory or handles, you need to first determine if this leak is caused by the WMI service or any other services in the svchost.exe container.
To determine this, follow these steps:
- Isolate the WMI service to its own svchost.exe container with the
SC Config WINMGMT Type= Owncommand. - Restart the Winmgmt service.
- The
tasklist /svccommand will show a list of all running processes and services hosted under each svchost.exe container. If the command works correctly, you should see the Winmgmt service run under a separate isolated svchost.exe container. - Continue to monitor its memory or handle usage. If it continues to increase over time and doesn't decrease at all, it means the Winmgmt service is the one leaking memory or handles. If not, you may see another svchost.exe container hosting other service leak memory or handles.
- To revert the changes, run the
SC Config WINMGMT Type= Sharecommand.
Query-related task objects aren't released properly
The leak is usually due to problematic client behavior or a connectivity issue, which prevents the task objects related to the queries from being released properly.
To determine if a problematic client is involved, you need to understand the pattern of the leak and review Task Manager to see if the memory increases at a specific time or during a specific action of any application. For example, the WMI service memory consumption increases whenever Windows updates are being installed.
To monitor the memory usage or handle count of any process (the WMI service or the WmiPrvse.exe process) using Performance Monitor (Perfmon), follow these steps:
Note the process ID (PID) of svchost.exe containing the Winmgmt service or WmiPrvse.exe process that's leaking memory or handles.
Enter Perfmon in the Run window to open Performance Monitor.
Select Performance Monitor in the left pane, and then select the plus sign (+) in the right pane to open the Add Counters window.
Expand Process and select ID Process. Select all the WmiPrvse# and svchost# instances, and then select Add > OK.
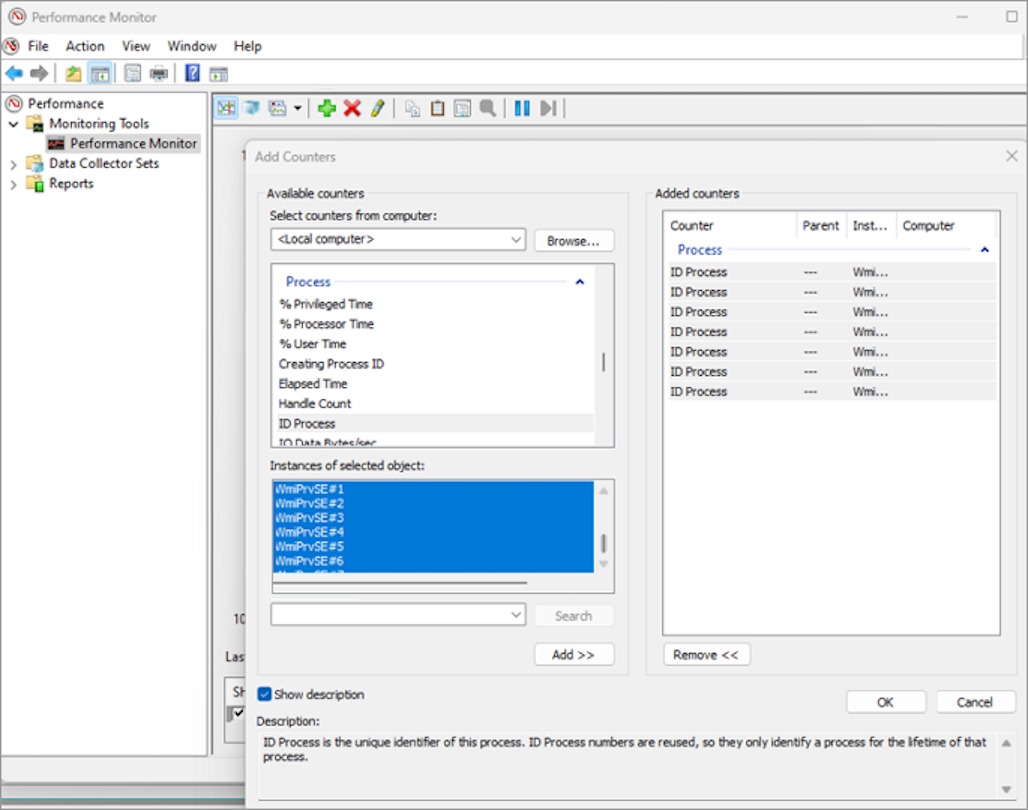
For each item in the list, you'll see that Last, Average, and Minimum have the same value, which is the PID of that process.
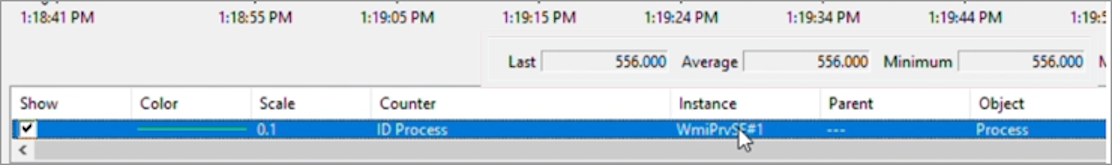
Go through all items in the list, and locate the PID of the Winmgmt service or WmiPrvse.exe process that's leaking memory or handles. Then, note the exact svchost# or WmiPrvse# instance.
Remove all the items from the list.
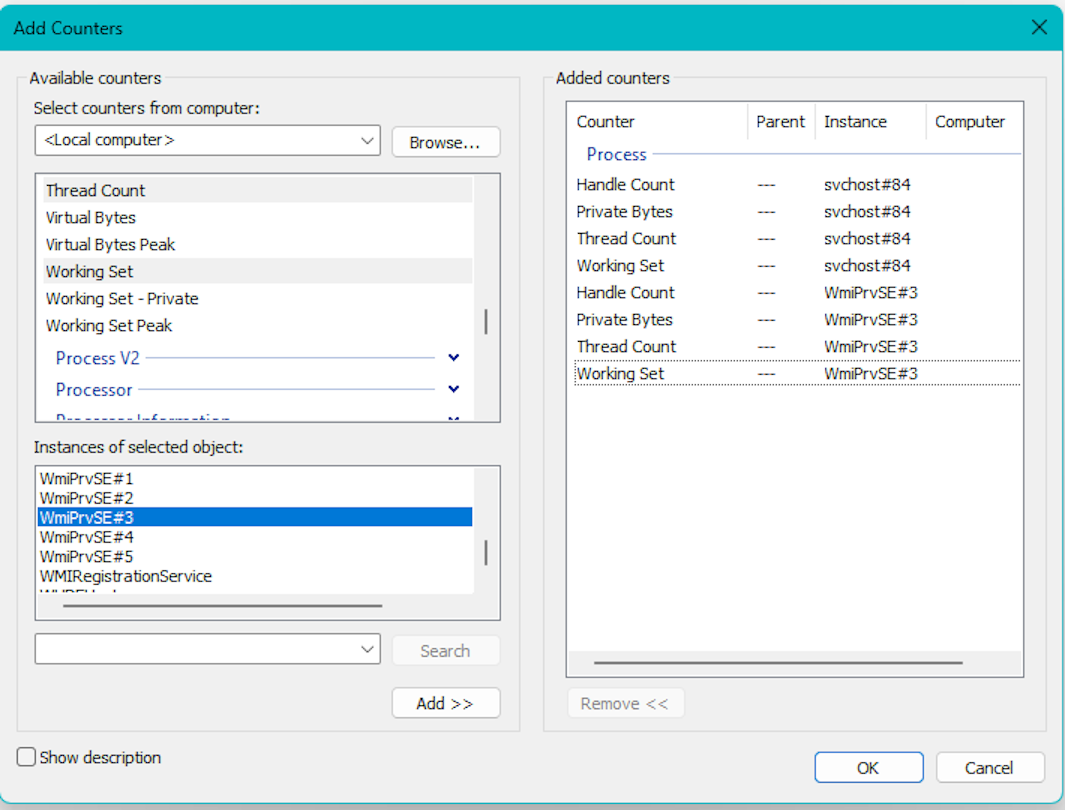
Select Add Counters again, and then under Process, select Handle Count, Private Bytes, Thread Count, and Working Set.
Select the correct svchost# or WmiPrvse# instance and select Add. This will show a graphical representation of the resources consumed by the selected processes.
Conclude if the memory or handle count increases at specific time intervals or specific times of the day or with any action. Once you understand the leak pattern, analyze the incoming queries around the time of the increase in memory or handles.
Look for queries that are huge, frequent, or stay too long on the task.
Note
Reviewing the incoming queries is to determine one or more client processes that might potentially be performing problematic queries or behaving abnormally.
Once you have a suspicious client, you can test it by temporarily uninstalling or disabling it and then restarting the WMI service.
If no memory leak occurs, the client process identified is the cause of the issue.
Repository bloated
Review the size of the WMI repository, which is stored under C:\Windows\System32\wbem\Repository. Understand or determin the size of the repository:
- The size of the repository depends on multiple factors, such as the resources and load on the machine, the active services and applications installed on the machine, and the environment (for example, whether it belongs to a cluster or SQL server).
- For a server OS, a healthy repository size may be a few hundred MB to 1.5 GB. For a client OS, the size can be a few hundred MB. The repository doesn't necessarily stay at a specific size, and there's no written limit.
- A huge size (more than 1 GB) is usually considered suspicious only if the machine is experiencing the issues or symptoms described at the beginning of this article.
- The repository size is abnormally large or grows over time. In this case, the repository is likely bloated.
A bloated repository has to be examined using specialized tools to determine its exact cause. You may open a Microsoft support case with the data captured.
However, in most cases, a bloated WMI repository is caused by Resultant Set of Policy (RSoP) logging or monitoring applications such as Microsoft System Center Configuration Manager (SCCM).
For RSoP logging issues, see Unexpectedly slow logon caused by large WMI repository in Windows or Windows Server.
Even after applying the solution, the WMI repository has to be reset to reduce its size. We don't recommend resetting the WMI repository without prior guidance from Microsoft support professionals.
If the above steps can't solve the issue, you need to collect the traces and dumps and send them to Microsoft support professionals for deeper investigation, as mentioned in the Data collection section.
The WmiPrvse.exe process is leaking handles or memory
If the WmiPrvse.exe process is leaking handles or memory, it's likely one of the following cases:
- A client application performs abnormal, inefficient, or large queries.
- The WmiPrvse.exe process doesn't release resources as expected while processing a WMI query, which leads to a memory leak and stops the WmiPrvse.exe process.
- The scale of the machine or environmental setup is large.
For these cases, see "Scenario guide: Troubleshoot WmiPrvse.exe quota exceeding issues or scenarios."
Data collection
To open a support case for further investigation, you can collect the information by following the steps mentioned in Gather information by using TSS for User Experience issues or by using the WMI-Collect tool on the machine that has recently experienced the issue. Here are the steps:
Download WMI-Collect.zip and extract it to a folder, such as C:\temp.
From an elevated PowerShell command prompt, run the WMI-Collect.ps1 script from the folder where the script is saved. For example:
C:\temp\WMI-Collect.ps1 -LogsKeep the PowerShell command prompt open with the "Press ENTER to stop the capture:" message.
The script creates a subfolder containing the results of all traces and the diagnostic information. Compress the folder. After a support case is created, this file can be uploaded to the secure workspace for analysis.
Feedback
Coming soon: Throughout 2024 we will be phasing out GitHub Issues as the feedback mechanism for content and replacing it with a new feedback system. For more information see: https://aka.ms/ContentUserFeedback.
Submit and view feedback for