Note
Access to this page requires authorization. You can try signing in or changing directories.
Access to this page requires authorization. You can try changing directories.
Note
Bridge to Kubernetes was retired on April 30, 2025. For details about the retirement and open-source alternatives, please see the GitHub issue.
In this tutorial, you'll learn how to redirect traffic between your Kubernetes cluster and your development computer. This tutorial uses Bridge to Kubernetes and Visual Studio for debugging a service. To use Visual Studio Code, see Run and debug locally with Bridge to Kubernetes with VS Code.
To learn more about Bridge to Kubernetes, see How Bridge to Kubernetes works.
In this tutorial, you learn how to:
- Connect to your cluster with Bridge to Kubernetes.
- Route requests to a locally running service for development purposes.
- Debug a running service on your local machine.
Prerequisites
- A Kubernetes cluster. You can create one in the Azure portal. If you don't have an Azure subscription, you can create an account for free.
- The kubectl executable installed on your system.
- Visual Studio 2019 version 16.7 or later running on Windows 10 or later or Visual Studio 2022.
- The Bridge to Kubernetes extension for Visual Studio 2019 or Bridge to Kubernetes extension for Visual Studio 2022.
Set up a service
This tutorial uses Bridge to Kubernetes to work with a simple todo sample application on any Kubernetes cluster.
The sample application has a frontend to interact and a backend that provides persistent storage.
Open a Bash window and check that your cluster is available and ready. Then set the context to that cluster.
kubectl cluster-info
kubectl config use-context <kubernetes-cluster>
Clone the sample repo.
git clone https://github.com/hsubramanianaks/b2k-samplesChange directory to todo-app and then create a namespace for the sample.
kubectl create namespace todo-appApply the deployment manifest:
kubectl apply -n todo-app -f deployment.yamlThis simple deployment exposes the frontend using a service of type
LoadBalancer. Wait for all the pods to be running and for the external IP of thefrontendservice to become available.If you're testing with MiniKube, use
minikube tunnelto resolve an external IP. If you're using AKS or another cloud-based Kubernetes provider, an external IP is assigned automatically.Use the following command to monitor the
frontendservice to wait until it's up and running:kubectl get service -n todo-app frontend --watch NAME TYPE CLUSTER-IP EXTERNAL-IP PORT(S) AGE frontend LoadBalancer 10.0.245.78 10.73.226.228 80:31910/TCP 6m26s
Connect to your cluster
Open Visual Studio. In the Get started window, select Continue without code.
Select Open > Project/Solution, then find the todo-app\database-api\databaseApi.csproj project and select Open.
In the project, select Bridge to Kubernetes from the launch settings as shown here:
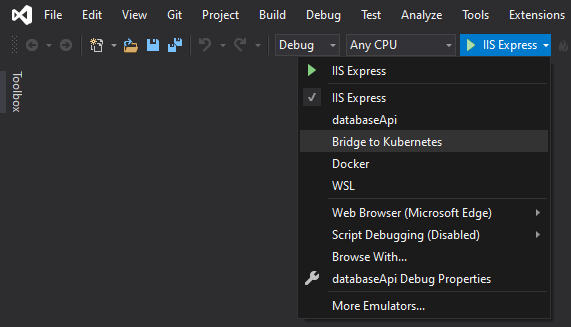
Select the start button next to Bridge to Kubernetes. In the Create profile for Bridge to Kubernetes dialog box, enter the following values:
- Select your cluster name.
- Select todo-app for your namespace.
- Select database-api for the Service to redirect.
- Select the same URL you used previously to launch your browser.
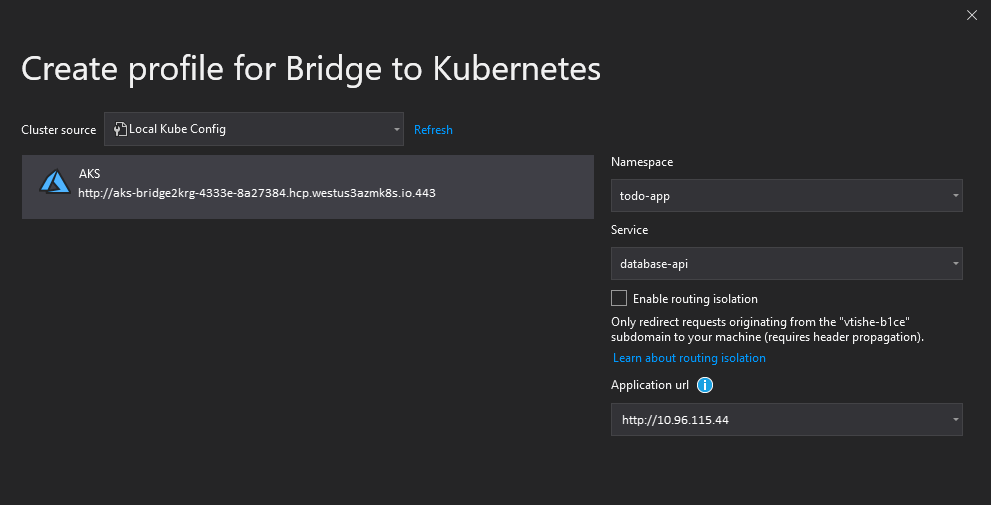
If you want to run isolated, select Enable routing isolation. If you enable routing isolation, others who are using the cluster aren't affected by your changes. Isolation mode routes your requests to your copy of each affected service. It routes other traffic normally. For more information, see How Bridge to Kubernetes Works.
Select Save and debug to save your changes.
Note
EndpointManager prompts you to allow elevated privileges to your hosts file.
Your development computer connects to the cluster. The status bar shows that you're connected to the
database-apiservice.
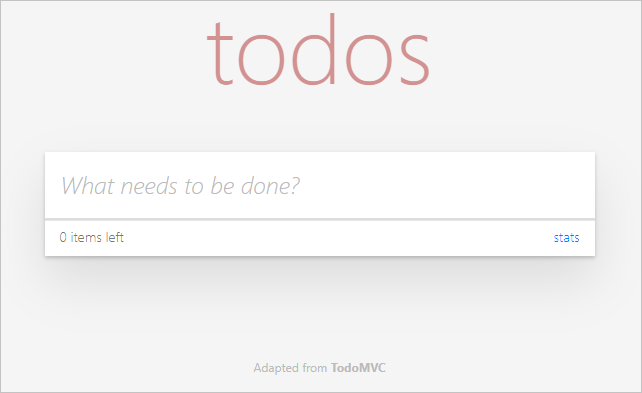
Try entering tasks and marking them as complete.
Select Debug > Stop Debugging to stop debugging. A shortcut for this action is Shift+F5 or use the Stop Debugging button in the toolbar.
Bridge to Kubernetes redirects all traffic for the database-api service. It redirects to the version of your application on your development computer. Bridge to Kubernetes also routes all outbound traffic from the application back to your Kubernetes cluster.
Note
By default, stopping the debugging task also disconnects your development computer from your Kubernetes cluster. To change this behavior, select Tools > Options, then select Kubernetes Debugging Tools. Set Disconnect After Debugging to False.
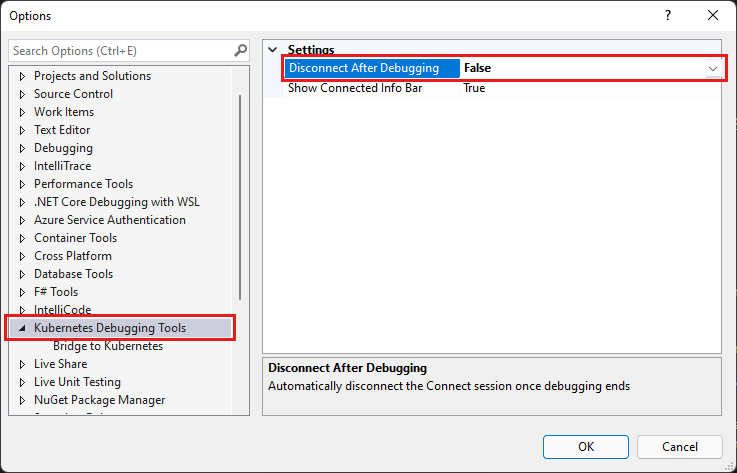
After updating this setting, your development computer remain connected when you stop and start debugging. To disconnect your development computer from your cluster click on the Disconnect button on the toolbar.
Set a breakpoint
In this section, you set a breakpoint in your service.
In Solution Explorer, select MongoHelper.cs to open the file in the editor. If you don't see Solution Explorer, select View > Solution Explorer.
Set your cursor on the first line of the CreateTask method body. Then select Debug > Toggle Breakpoint to set a breakpoint.

A shortcut for this action is F9.
Select the start button next to Bridge to Kubernetes, as you did in the previous section. Debugging starts with the values you entered previously.
In the browser that opens, enter a value into the todos and select Enter. The code reaches the breakpoint you entered. While doing real debugging tasks, you can use the debugging options to step through the code.
Select Debug > Stop Debugging to stop debugging.
To remove the breakpoint, select that line and then select Debug > Toggle Breakpoint or select F9.
Edit launch profile
If you need to change how Bridge to Kubernetes connects to your cluster, in this section, you'll edit the launch profile settings.
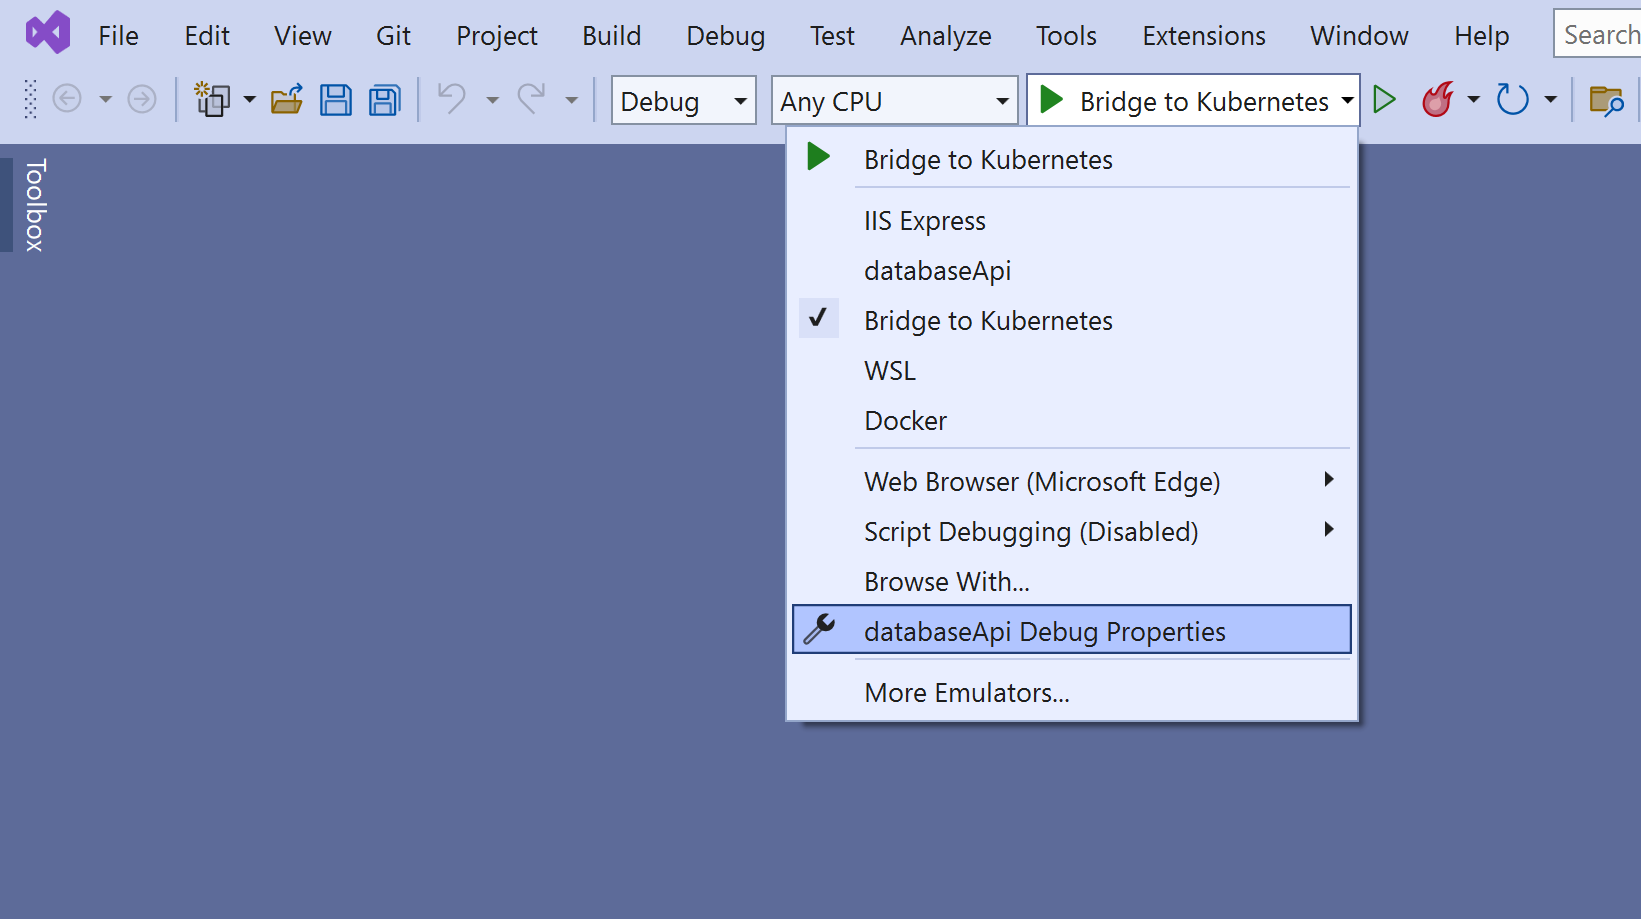
In the Visual Studio command bar, click on the arrow next to the start button (green triangle or "play" icon) to open the dropdown, then click on databaseApi Debug Properties.
Click on the Edit profile for Bridge to Kubernetes link in the Launch Profiles dialog.
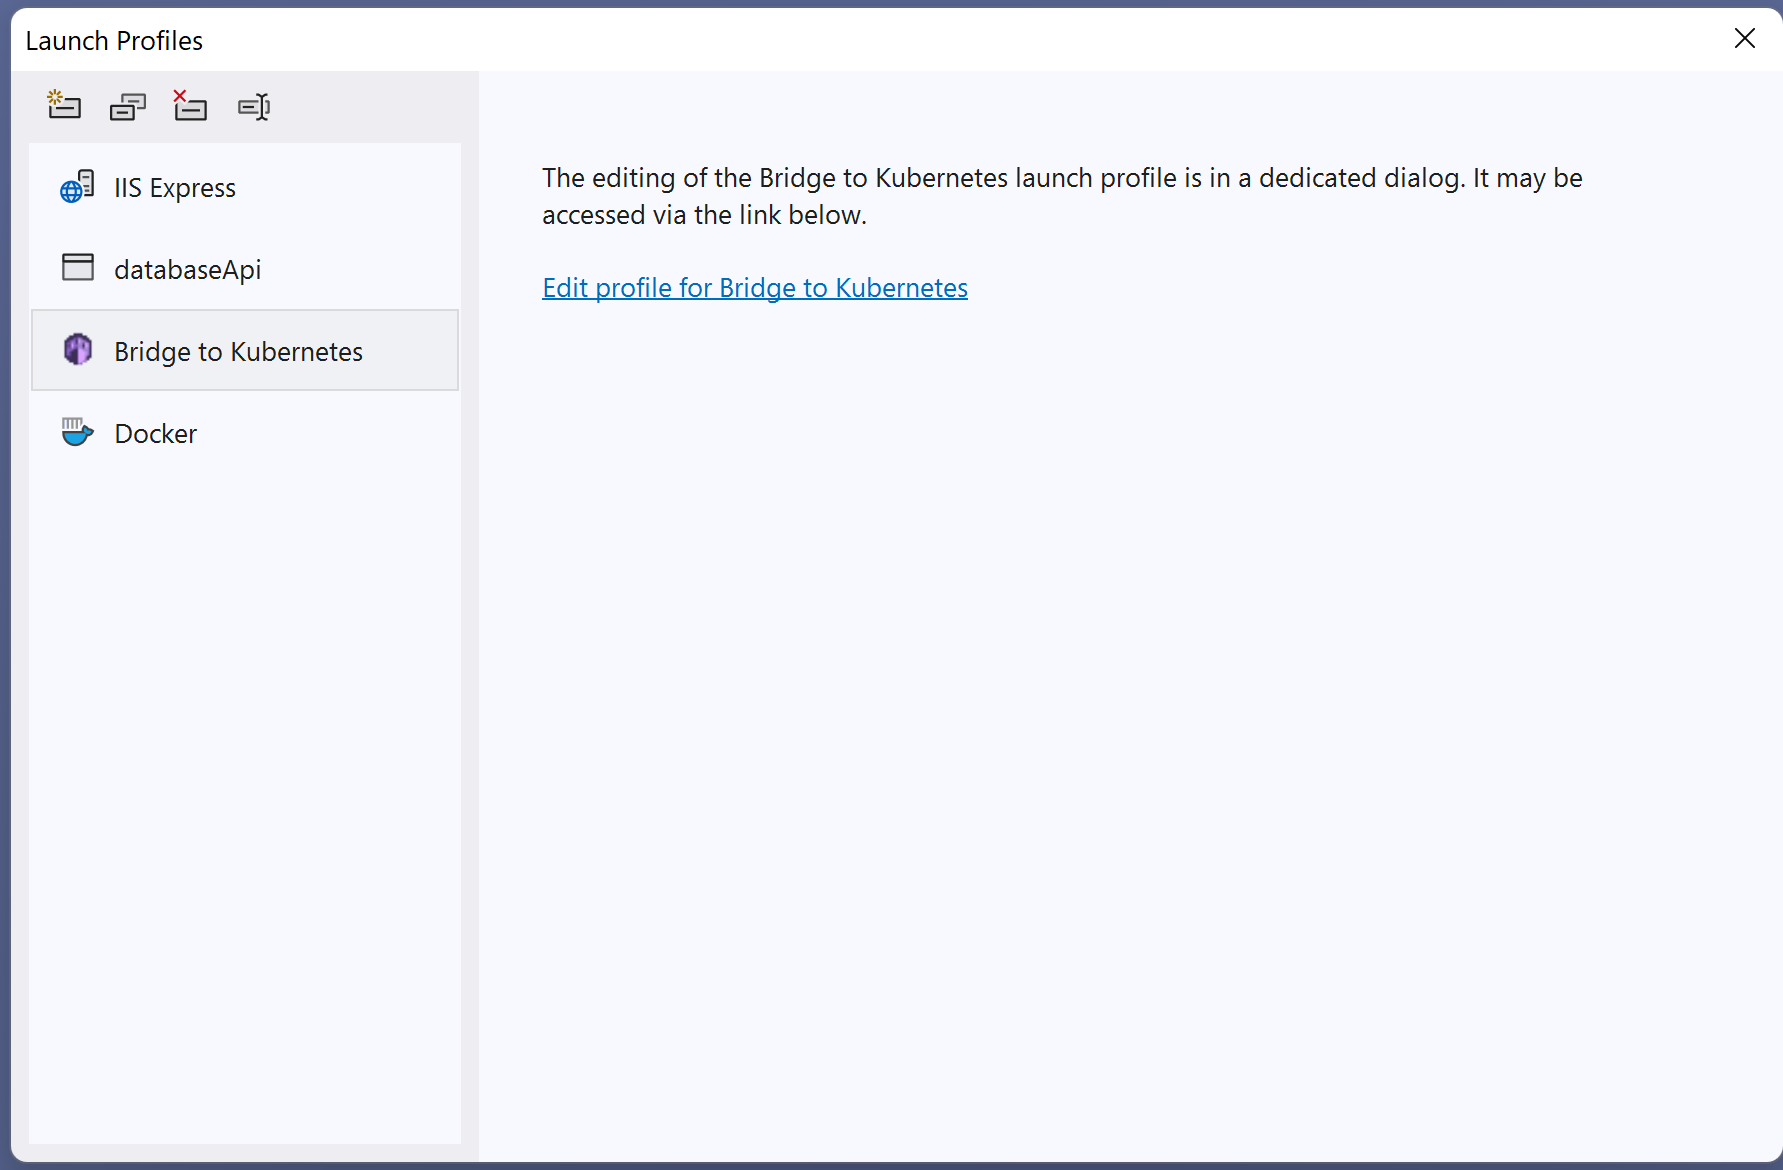
Another way to get to this screen:
Right-click on the project node in Solution Explorer, and choose Properties (or press Alt+Enter).
Scroll down to Debug, and choose Open debug launch profiles UI.
Clean up resources
If you used the sample todo app for this tutorial, you can remove it from your cluster by using the Azure portal. If you cloned that repo locally, you can delete it manually.
Next steps
Learn more about Bridge to Kubernetes at How Bridge to Kubernetes works.
To learn how to connect your development computer to a cluster by using Visual Studio Code, check out this article: