Use the Containers window
You can view what's going on inside the containers that host your app by using the Containers window. If you're used to using the command prompt to run Docker commands to view and diagnose what's going on with your containers, this window provides a more convenient way to monitor your containers without leaving the Visual Studio IDE.
You can also view information about container images using the Containers window.
Prerequisites
- Docker Desktop
- Visual Studio 2022 or Visual Studio 2019 version 16.4 or later.
- For the Docker Compose node, Visual Studio 2022 version 17.7 or later and Docker v2, which is installed with Docker Desktop and is on by default.
View information about your containers
The Containers window opens automatically when you start a containerized .NET project. To view your containers in Visual Studio at any time, use Ctrl+Q to activate the Visual Studio Search box, and type Containers and choose the first item. You can also open the Containers window from the main menu. Use the menu path View > Other Windows > Containers.

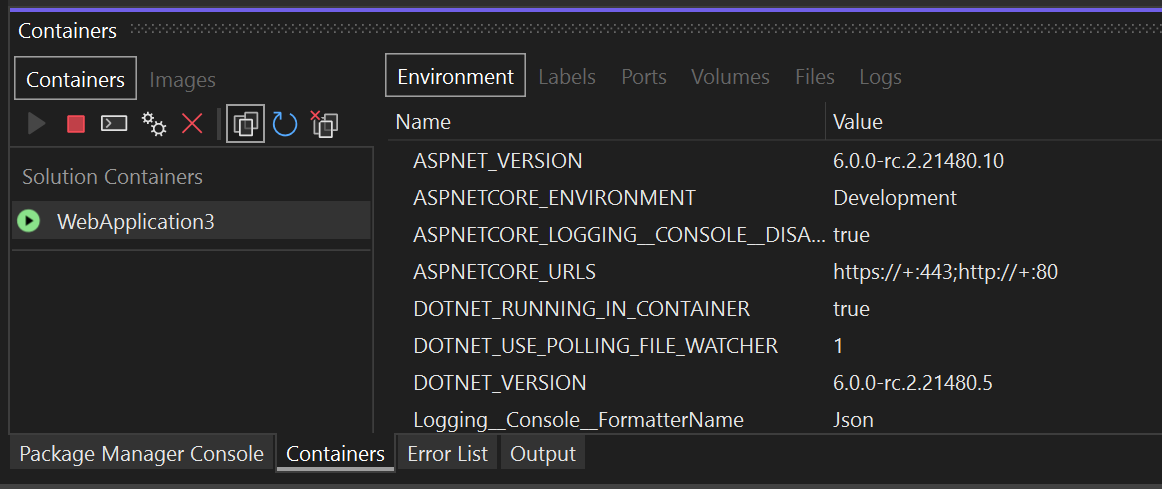
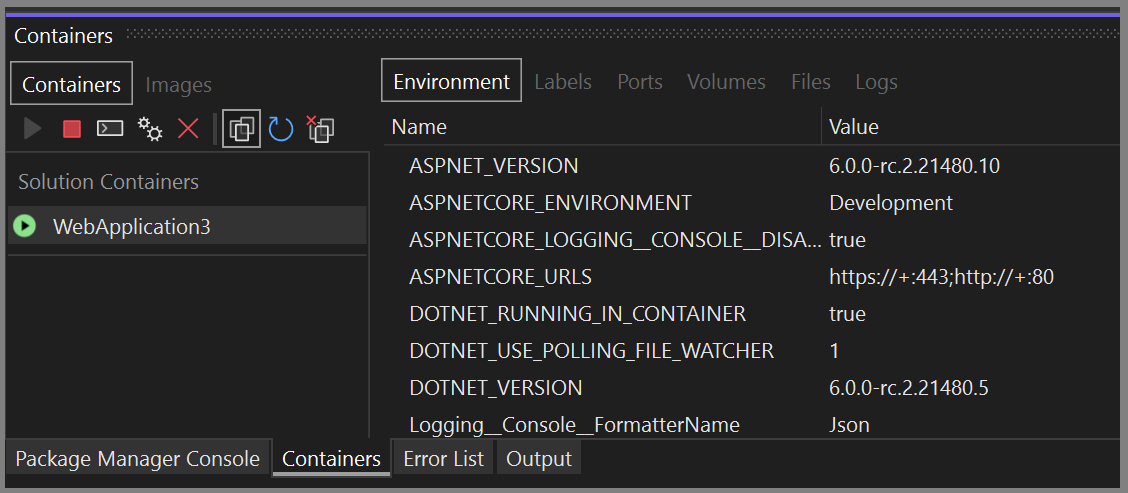
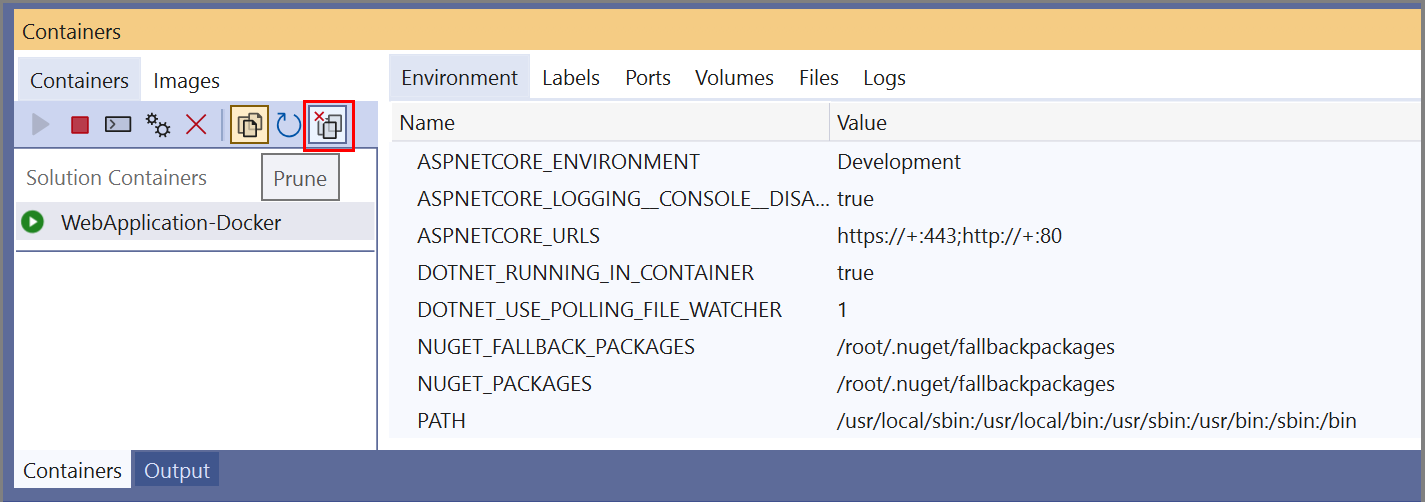
On the left side, you see the list of containers on your local machine. The containers associated with your solution are shown under Solution Containers. To the right, you see a pane with tabs for Environment, Labels, Ports, Volumes, Logs, and Files.
Tip
You can easily customize where the Containers tool window is docked in Visual Studio. See Customizing window layouts in Visual Studio. By default, the Containers window is docked with the Watch window when the debugger is running.
If you're using Docker Compose and Visual Studio 2022 version 17.7 or later, you see a tree of nodes for your solution and its Docker Compose project, with a parent node for the solution and child nodes for each project.

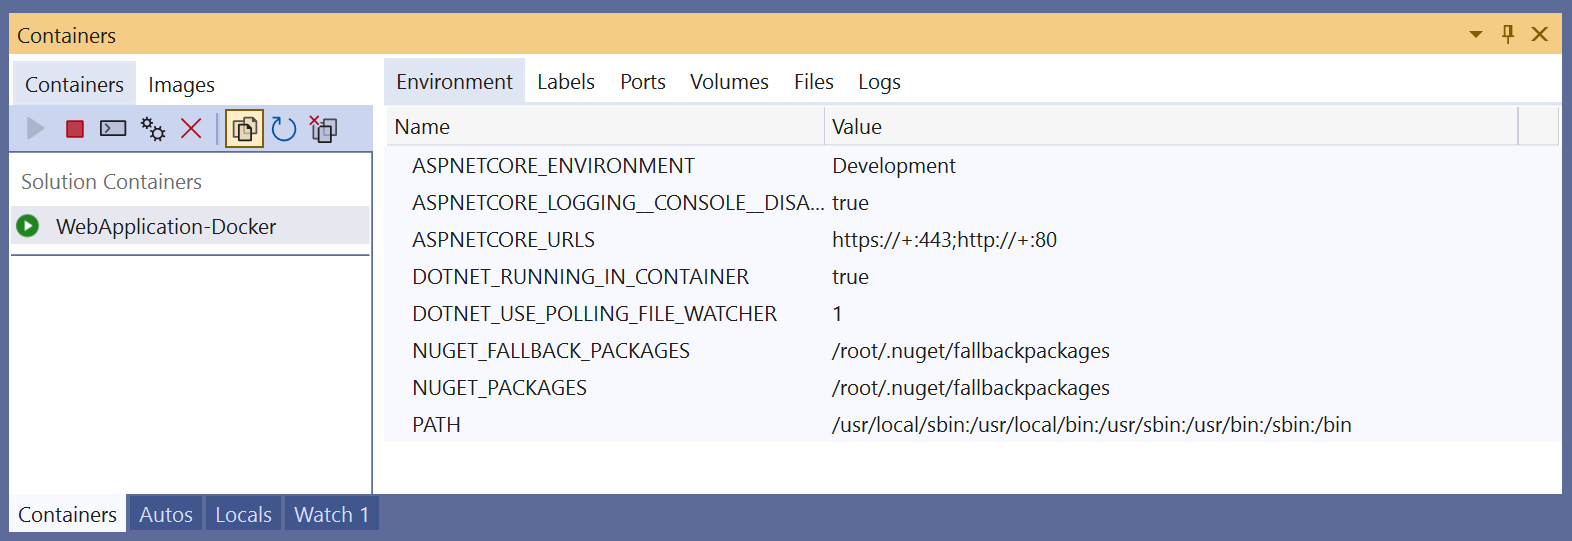
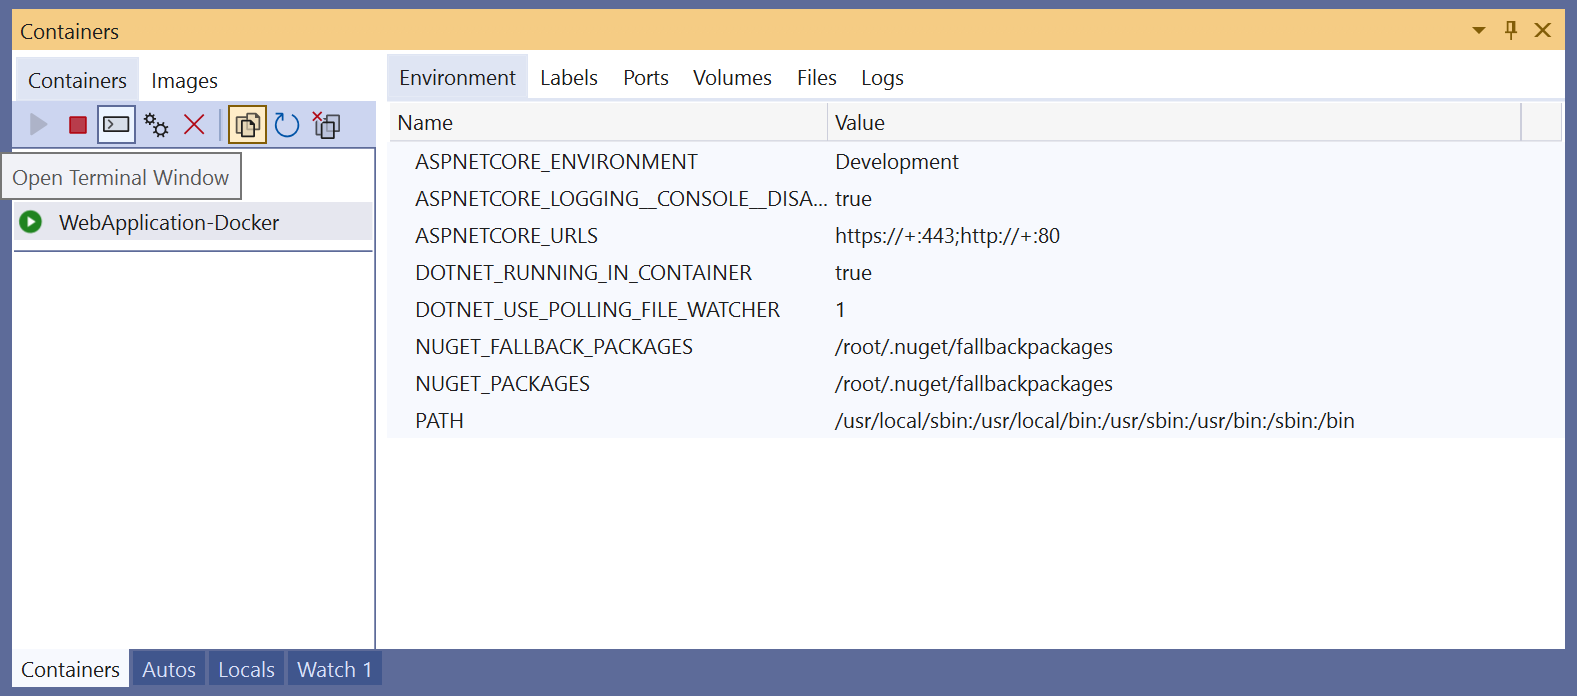
View environment variables
The Environment tab shows the environment variables in the container. For your app's container, you can set these variables in many ways, for example, in the Dockerfile, in an .env file, or by using the -e option when you start a container using a Docker command.
Note
Any changes to the environment variables aren't reflected in real time. Also, the environment variables in this tab are the system environment variables on the container, and do not reflect user environment variables local to the app.
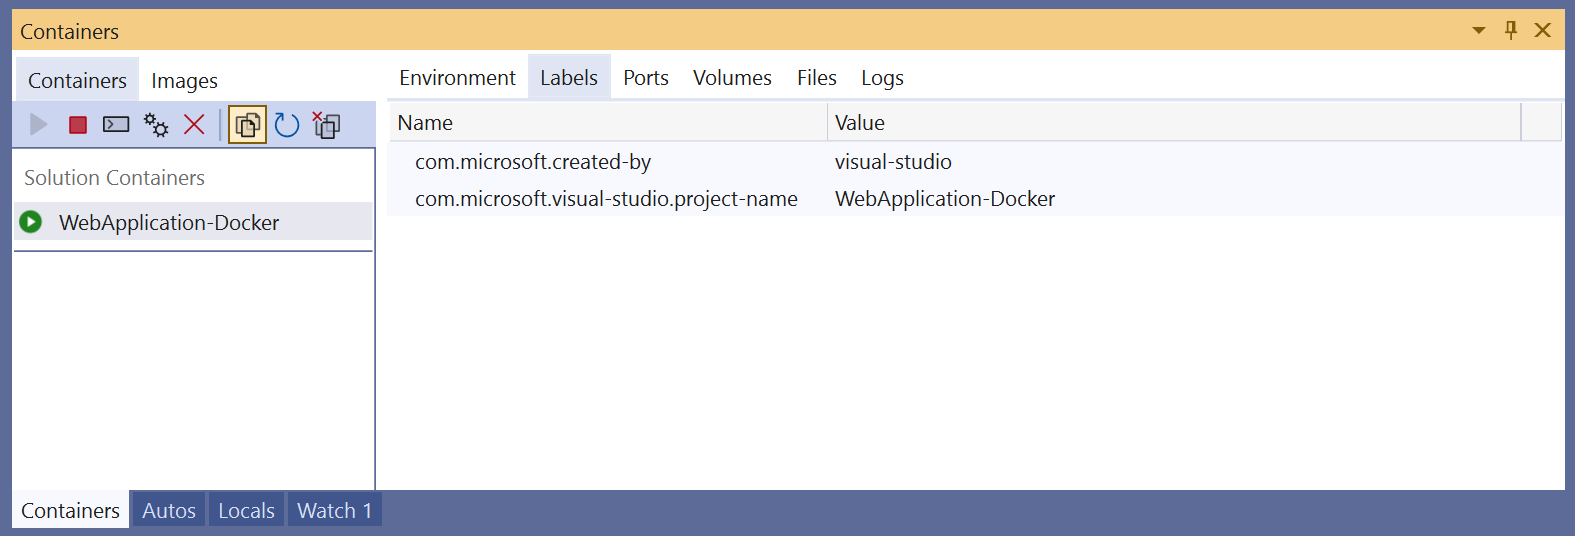
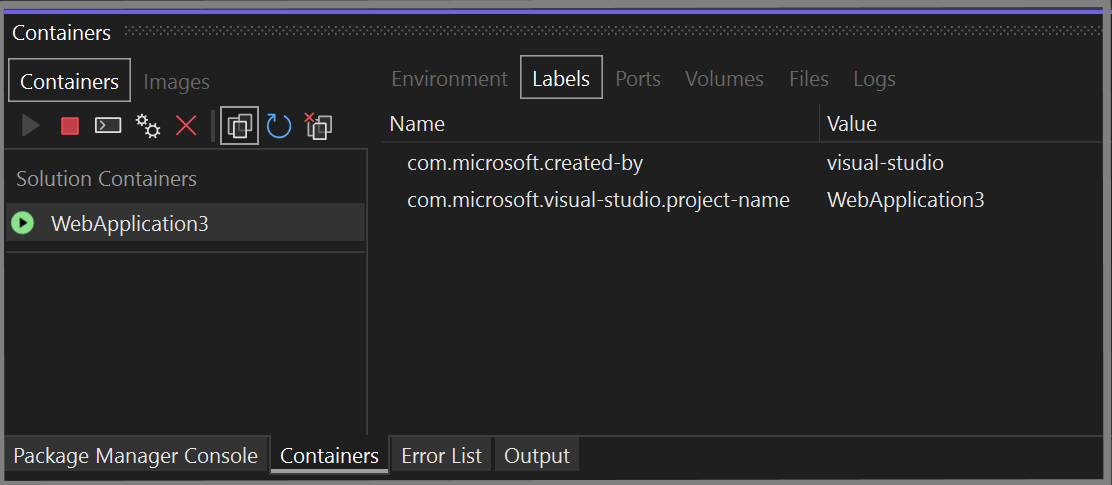
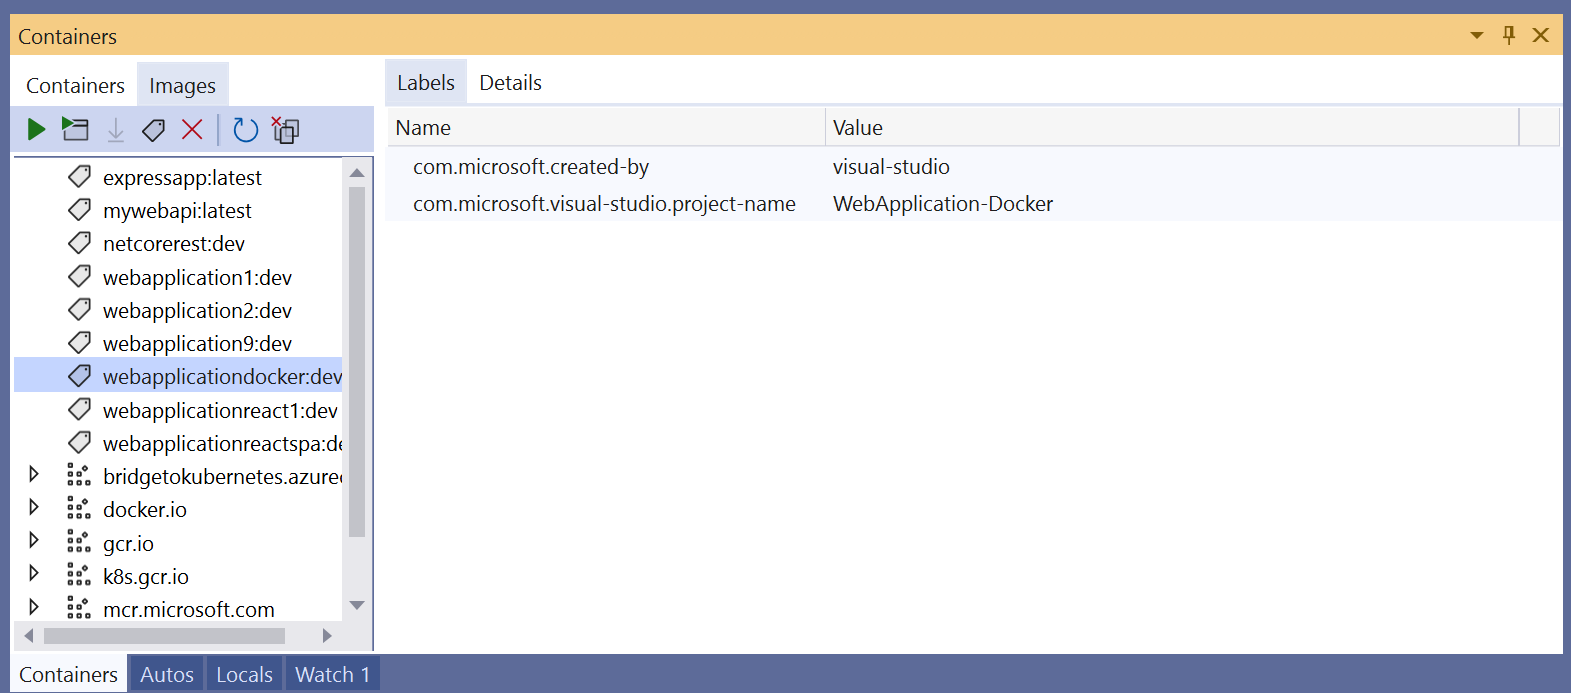
View labels
The Labels tab shows the labels for the container. Labels are a way of setting custom metadata on Docker objects. Some labels are set automatically by Visual Studio.
View port mappings
On the Ports tab, you can check the port mappings that are in effect for your container.
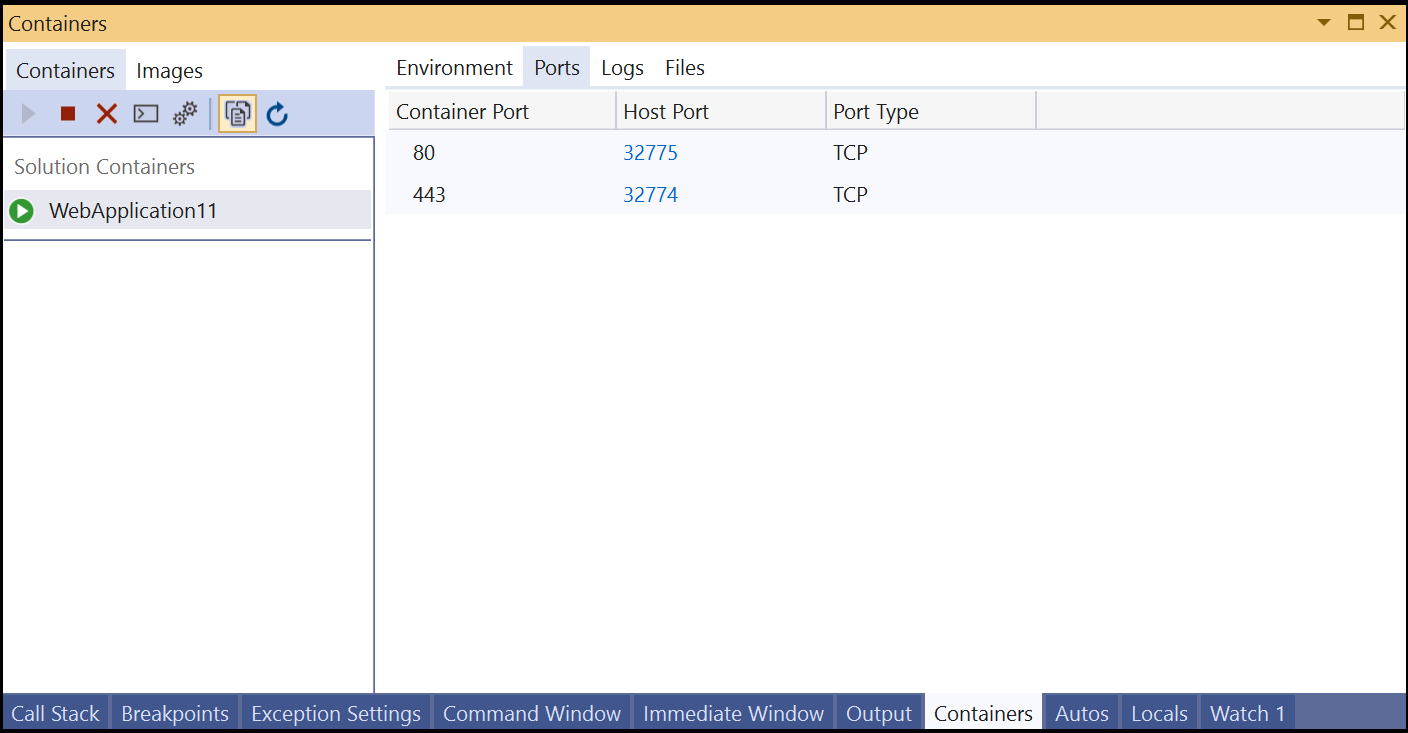
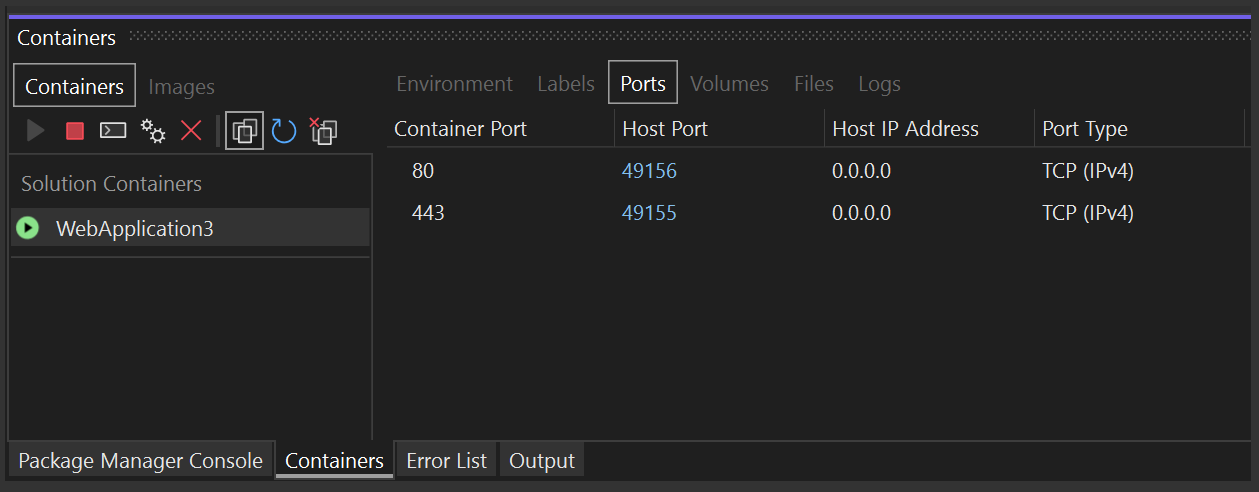
Well-known ports are linked, so if there's content available on a port, you can click on the link to open the browser.
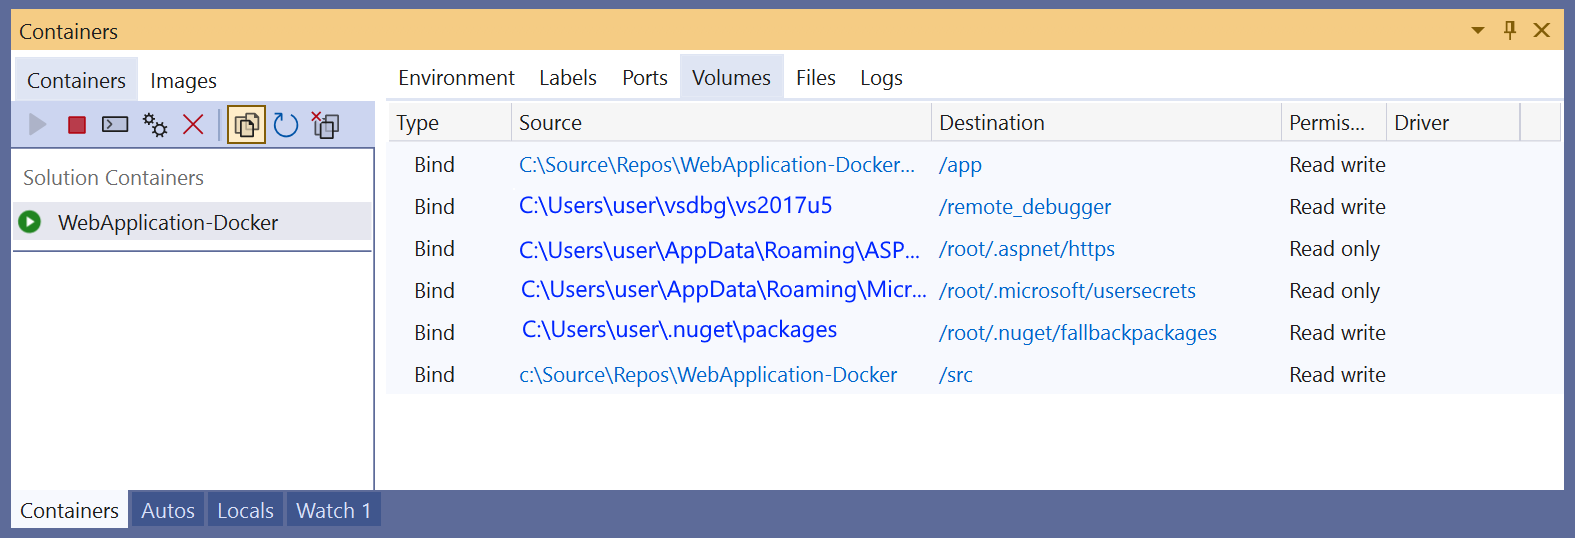
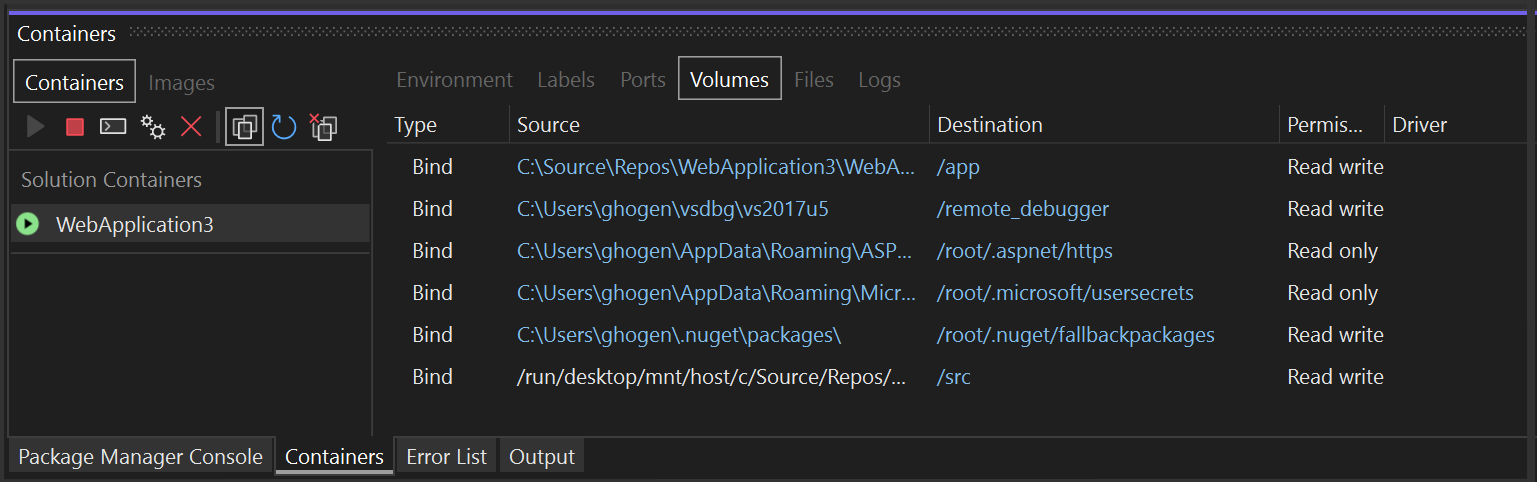
View volumes
The Volumes tab shows the volumes (mounted filesystem nodes) on the container.
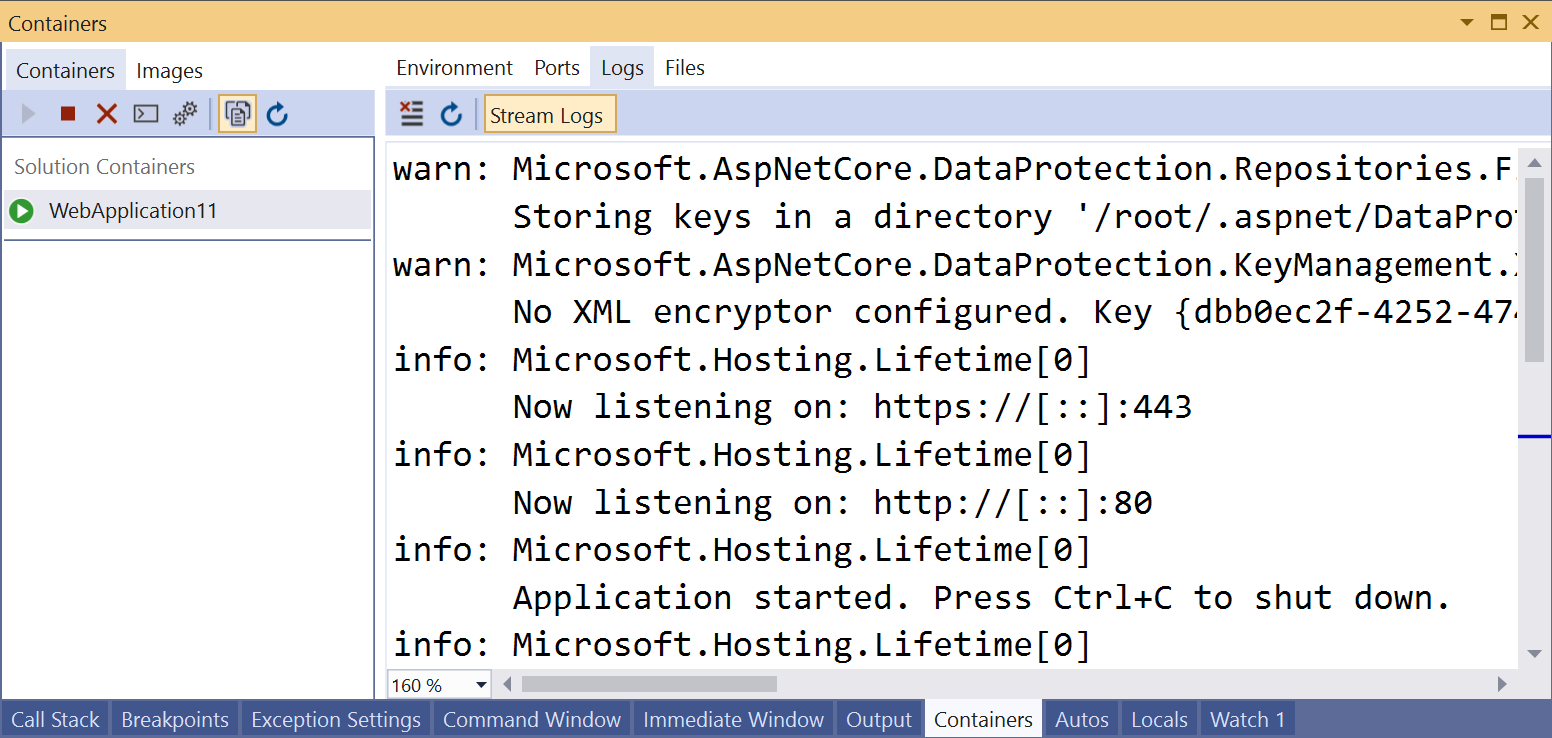
View logs
The Logs tab shows the results of the docker logs command. By default, the tab shows stdout and stderr streams on a container, but you can configure the output. For details, see Docker logging. By default, the Logs tab streams the logs, but you can pause that by choosing the Stream button on the tab. If you select Stream again, the streaming resumes from where it left off.
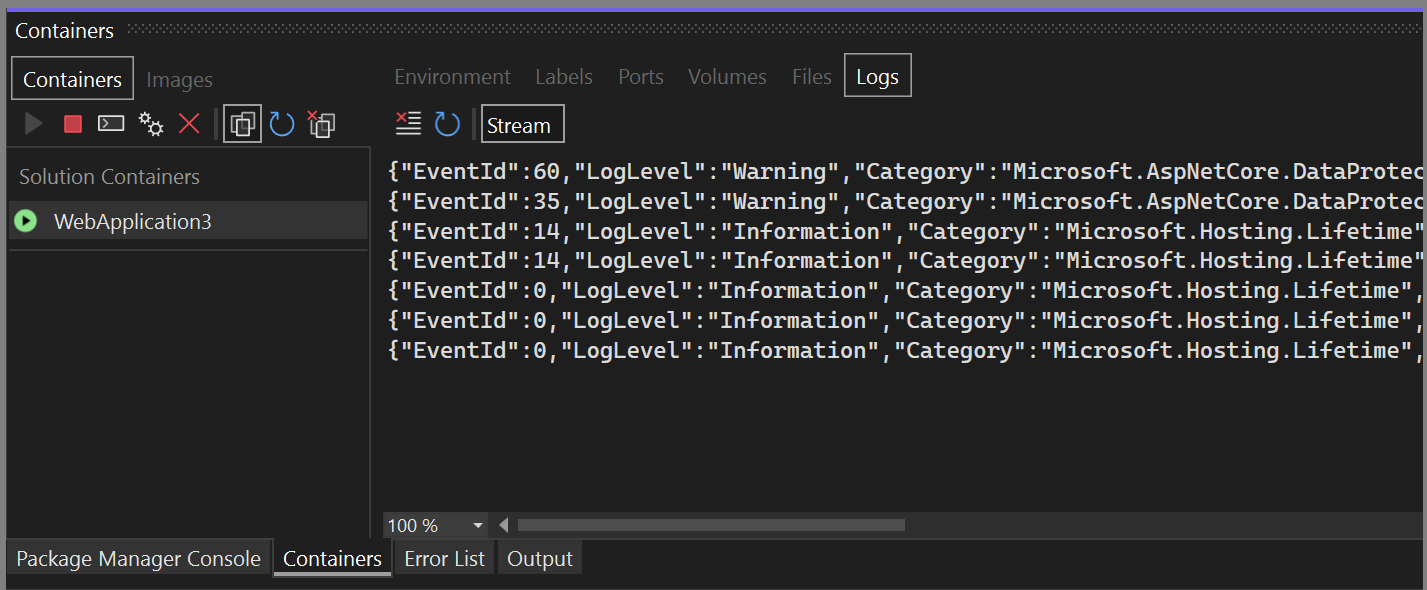
To clear the logs, use the Clear button on the Logs tab. To get all the logs, use the Refresh button.
Note
Visual Studio automatically redirects stdout and stderr to the Output window when you run without debugging with Windows containers, so Windows containers started from Visual Studio using Ctrl+F5 will not display logs in this tab; use the Output window instead.
If you're using Docker Compose with Visual Studio 2022 version 17.7 or later, you have the option of viewing logs of each container separately, or interleaved into a single output stream. If you select the parent node for the solution, you see interleaved logs from all the Compose projects. The first column on each line shows the container that produced that line of output. If you only want to see the logs for one container by itself, select that specific project's node.
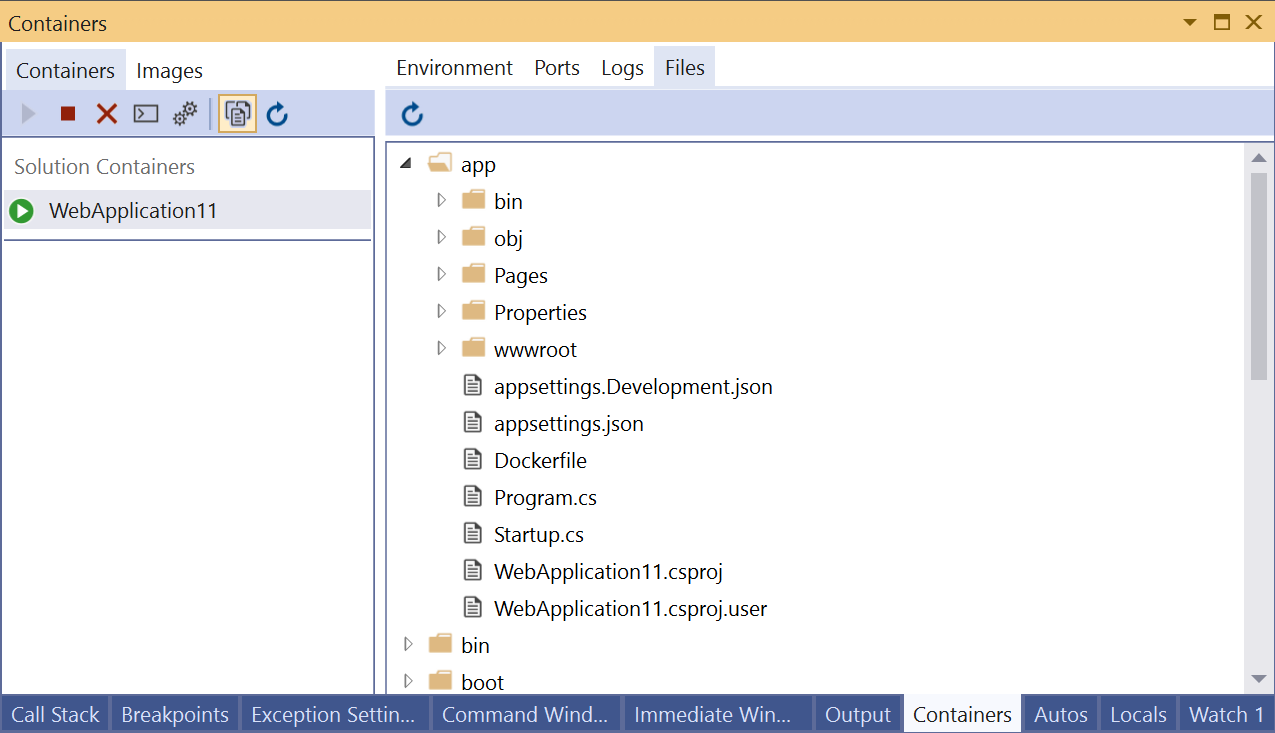
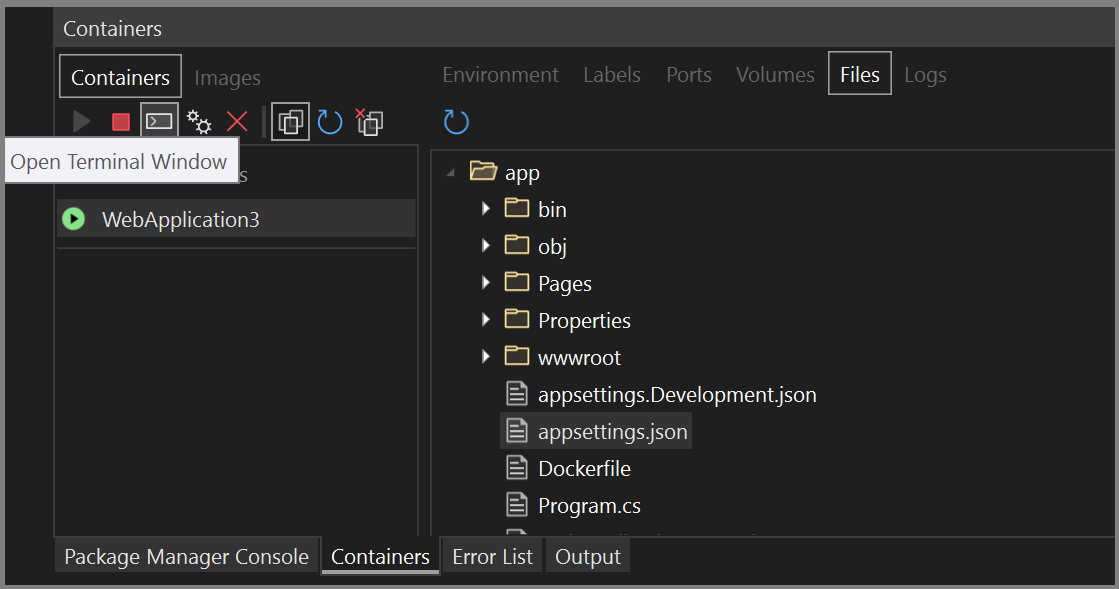
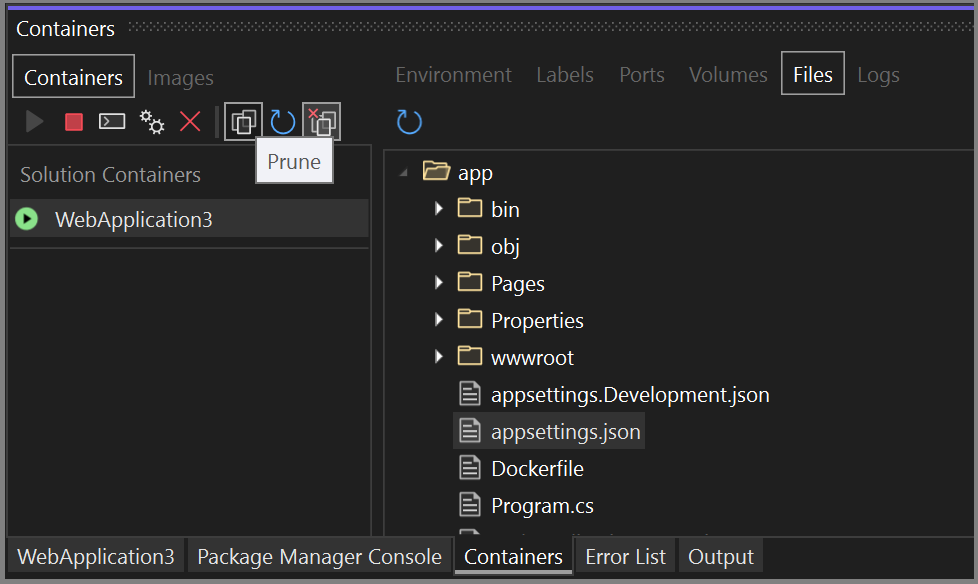
View the filesystem
On the Files tab, you can view the container's filesystem, including the app folder that contains your project.
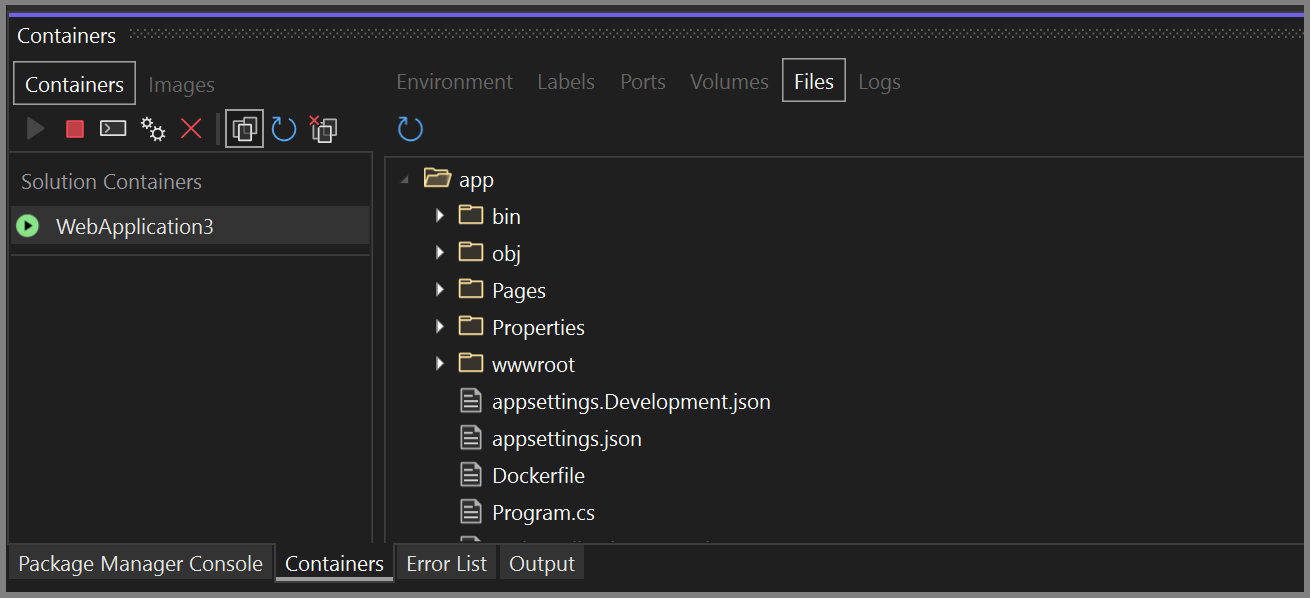
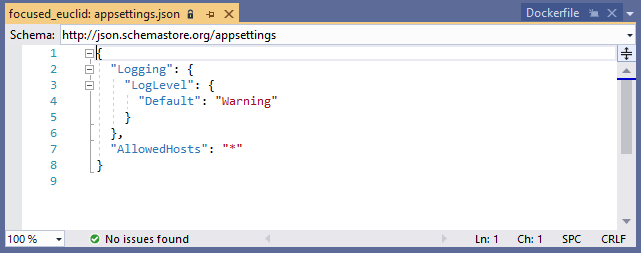
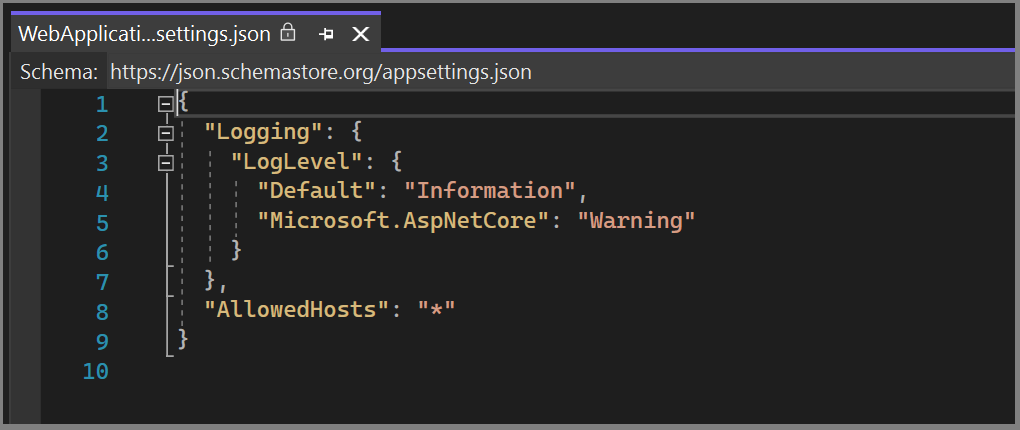
To open files in Visual Studio, browse to the file and double-click it, or right-click and choose Open. Visual Studio opens files in read-only mode.
Using the Files tab, you can view application logs such as Internet Information Services (IIS) logs, configuration files, and other content files in your container's filesystem.
In Visual Studio 2022 version 17.7 or later, when targeting .NET 8 or later, the Dockerfile might contain the USER app command, which specifies to run the app with normal user permissions. The Files tab uses those permissions as well, and so you might not be able to view some folders, if those folders are set to require elevated permissions to view.
Start, stop, and remove containers
By default, the Containers window shows all containers on the machine that Docker manages. You can use the toolbar buttons to start, stop, or remove (delete) a container you no longer want. This list is dynamically updated as containers are created or removed.
To select multiple containers, for example, to remove more than one at a time, use Ctrl+Click. If you try to start more than 10 containers, you are prompted to confirm this. You can disable the confirmation prompt if desired.
Open a terminal window in a running container
You can open a terminal window (command prompt or interactive shell) in the container by using the Open Terminal Window button in the Container window.
For Windows containers, the Windows command prompt opens. For Linux containers, it opens a window using the Bash shell.
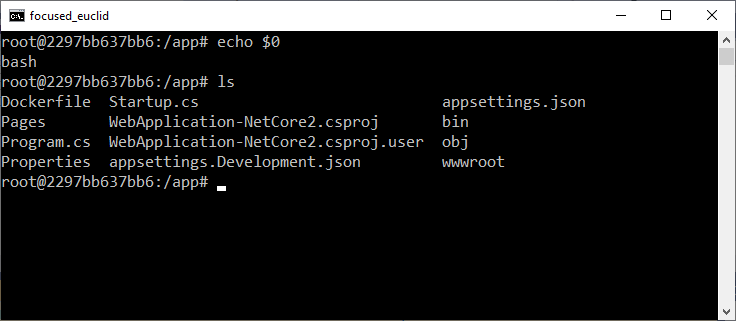
If you're targeting .NET 8, your Dockerfile can specify the USER app command, which means your app runs with normal user permissions, rather than elevated permissions. The Dockerfile generated by Visual Studio includes this in Visual Studio 2022 version 17.7 and later, if you're targeting .NET 8 or later. The terminal opens as the user specified in the Dockerfile (by default for .NET 8 projects, that's app), or if no user is specified, it runs as the root user.
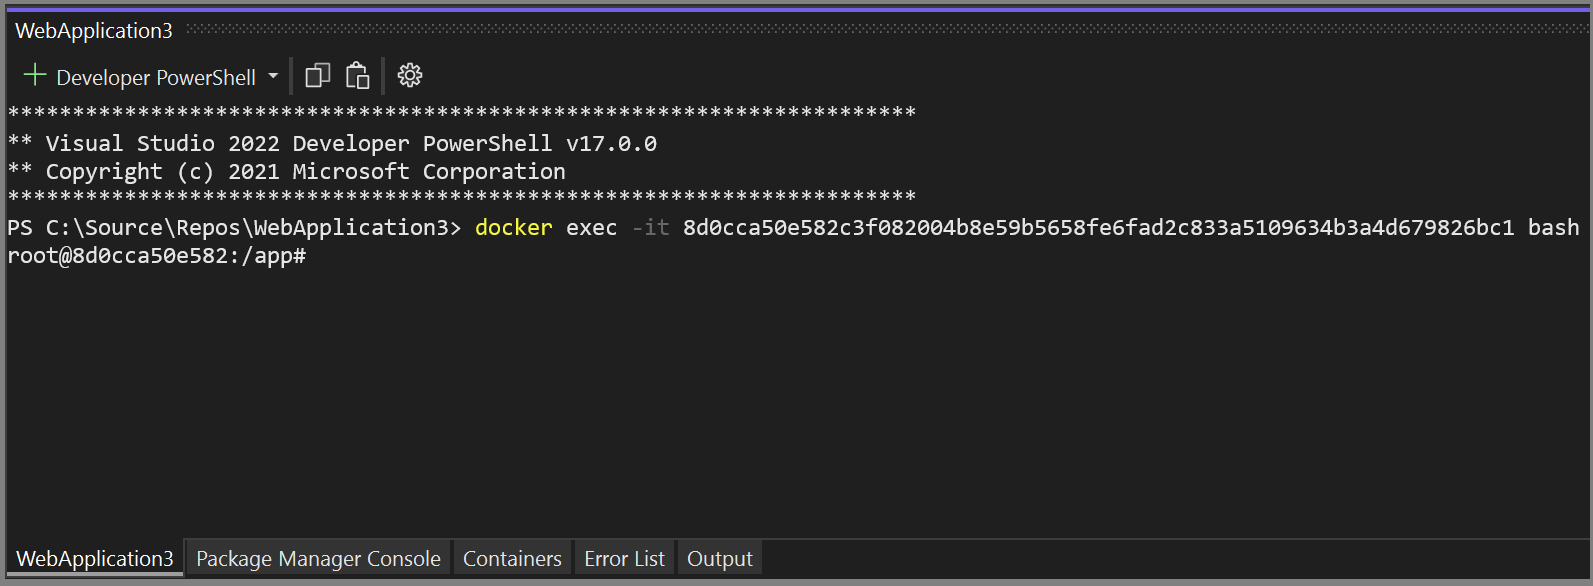
Normally, the terminal window opens outside Visual Studio as a separate window. If you want a command-line environment integrated into the Visual Studio IDE as a dockable tool window, you can install Whack Whack Terminal.
Attach the debugger to a process
You can attach the debugger to a process that is running in the container by using the Attach to Process button on the Containers window toolbar. When you use this button, the Attach to Process dialog appears and shows the available processes that are running in the container.
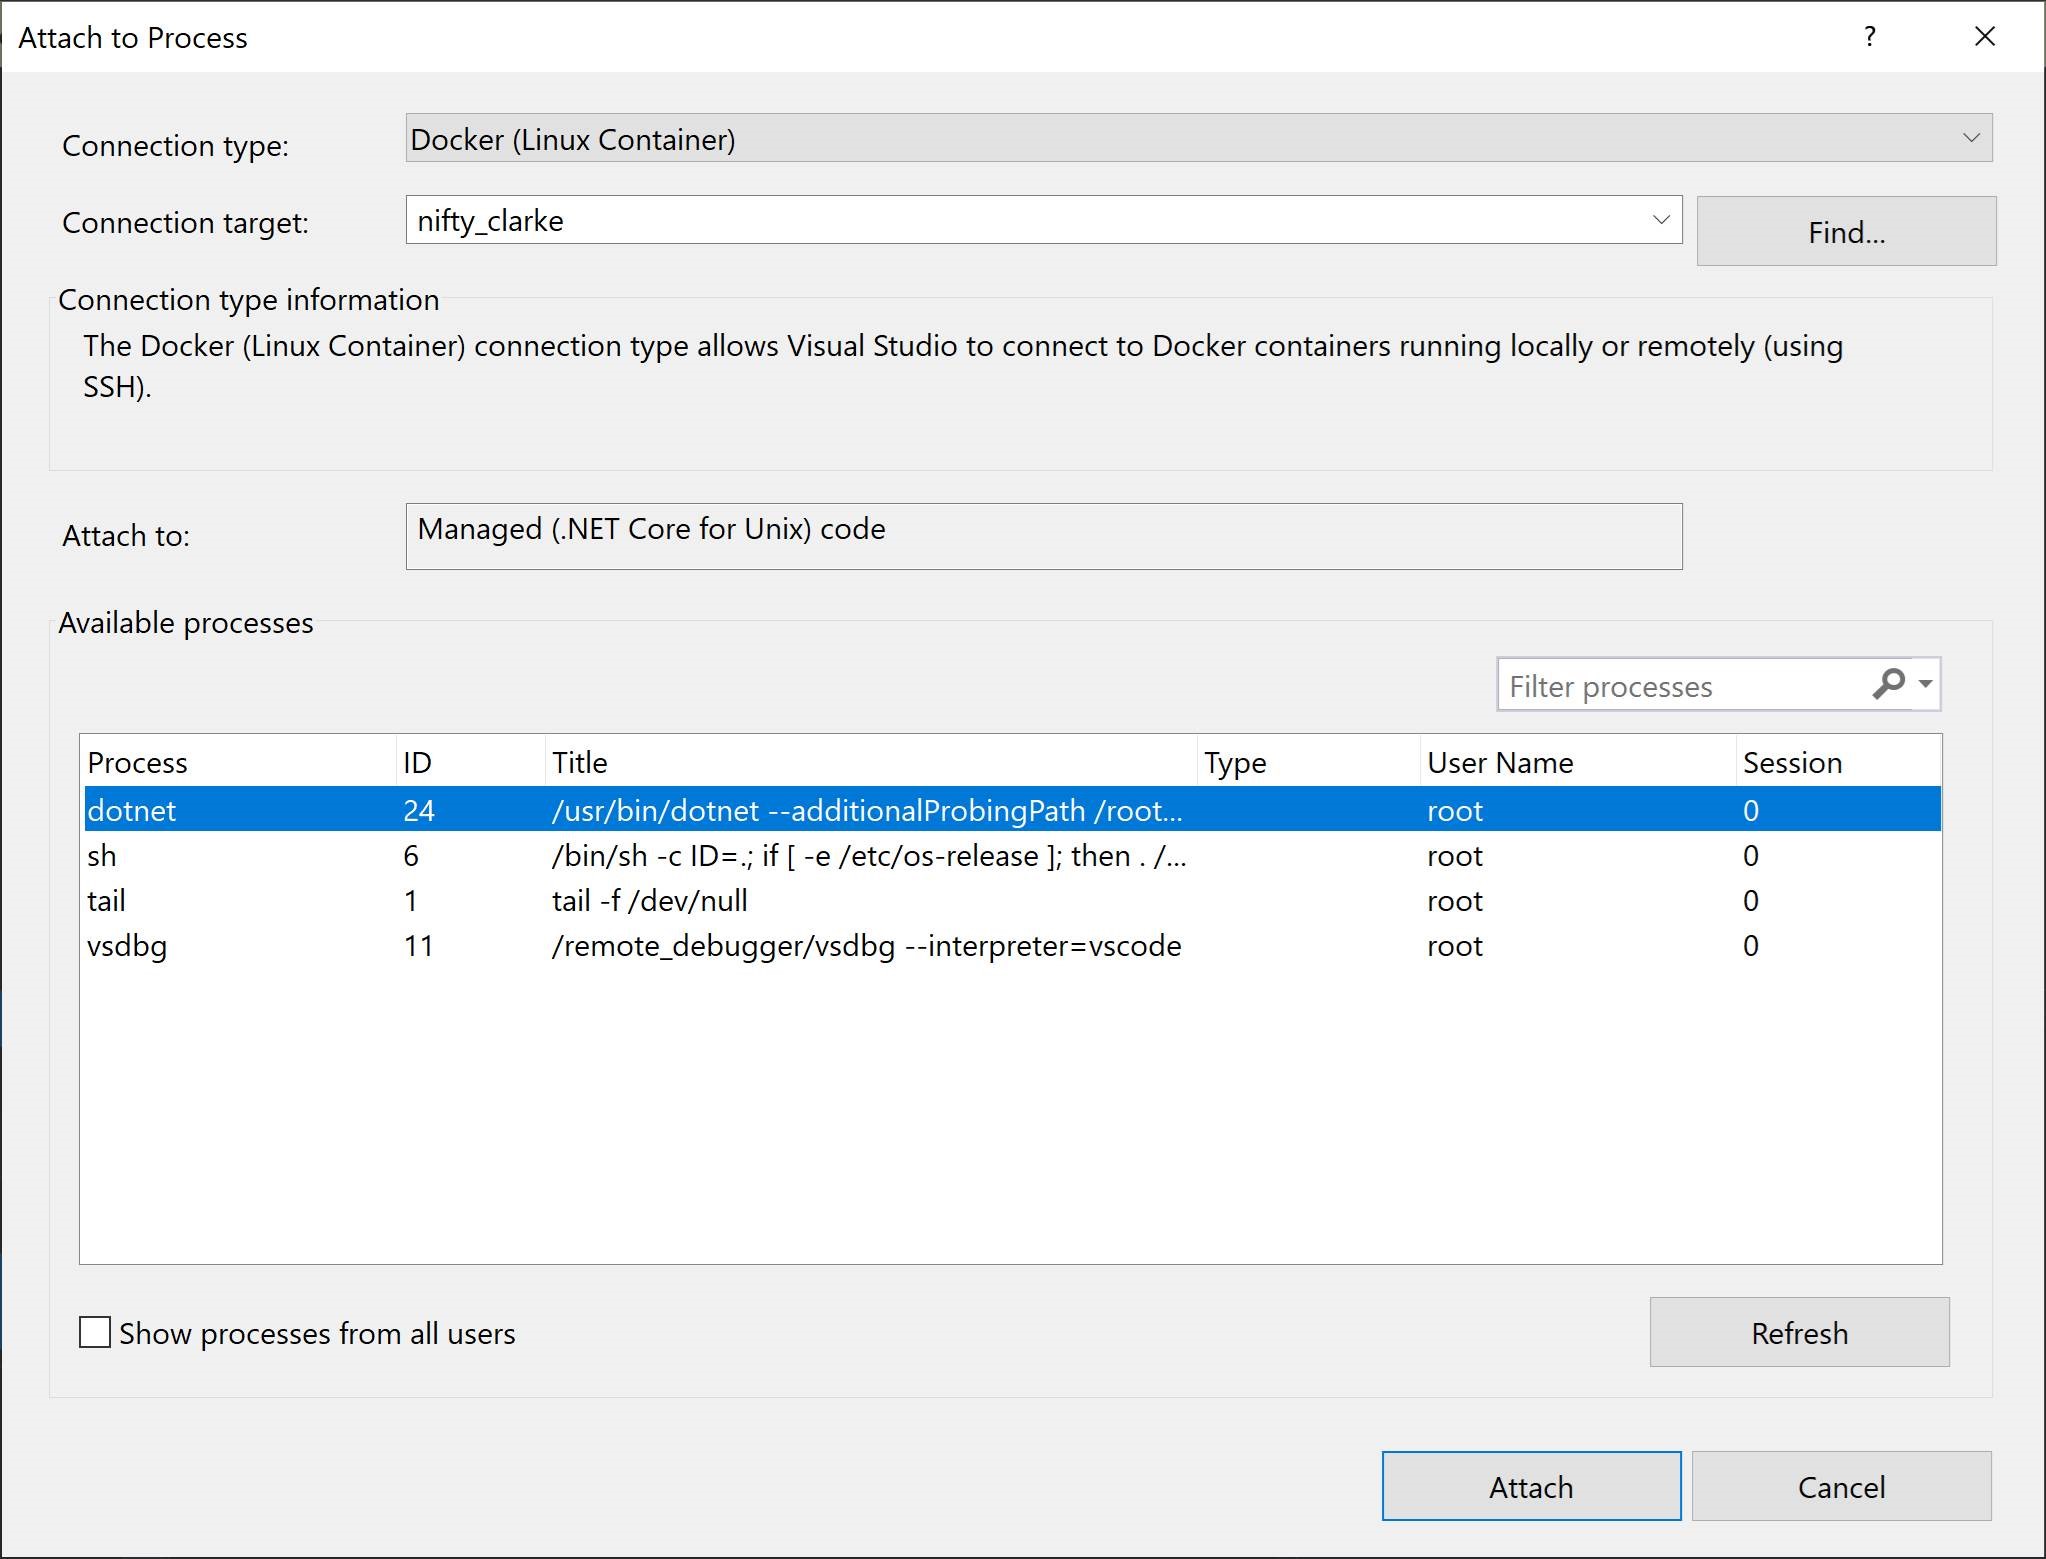
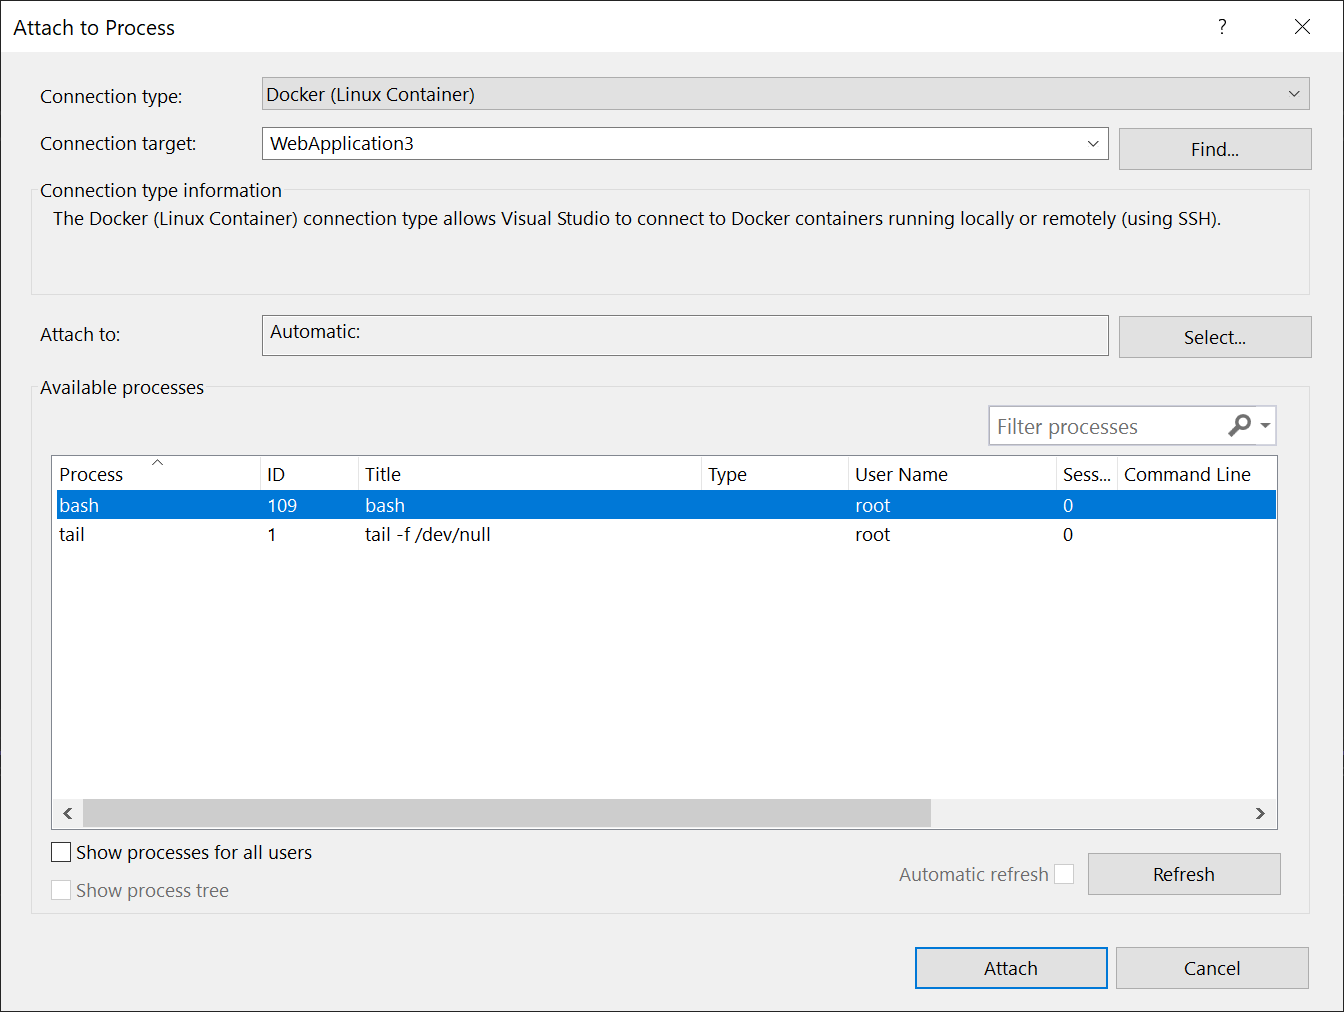
You can attach to managed processes in the container. To look for a process in another container, use the Find button and select another container on the Select Docker Container dialog.
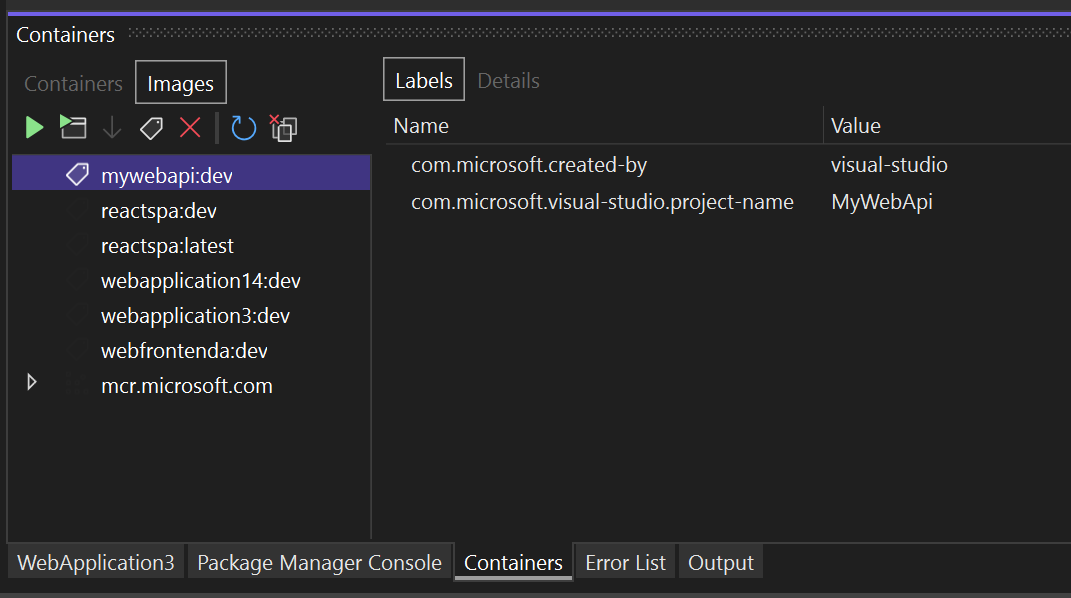
Viewing images
You can also view images on the local machine by using the Images tab in the Containers window. Images pulled from external repositories are grouped together in a treeview.
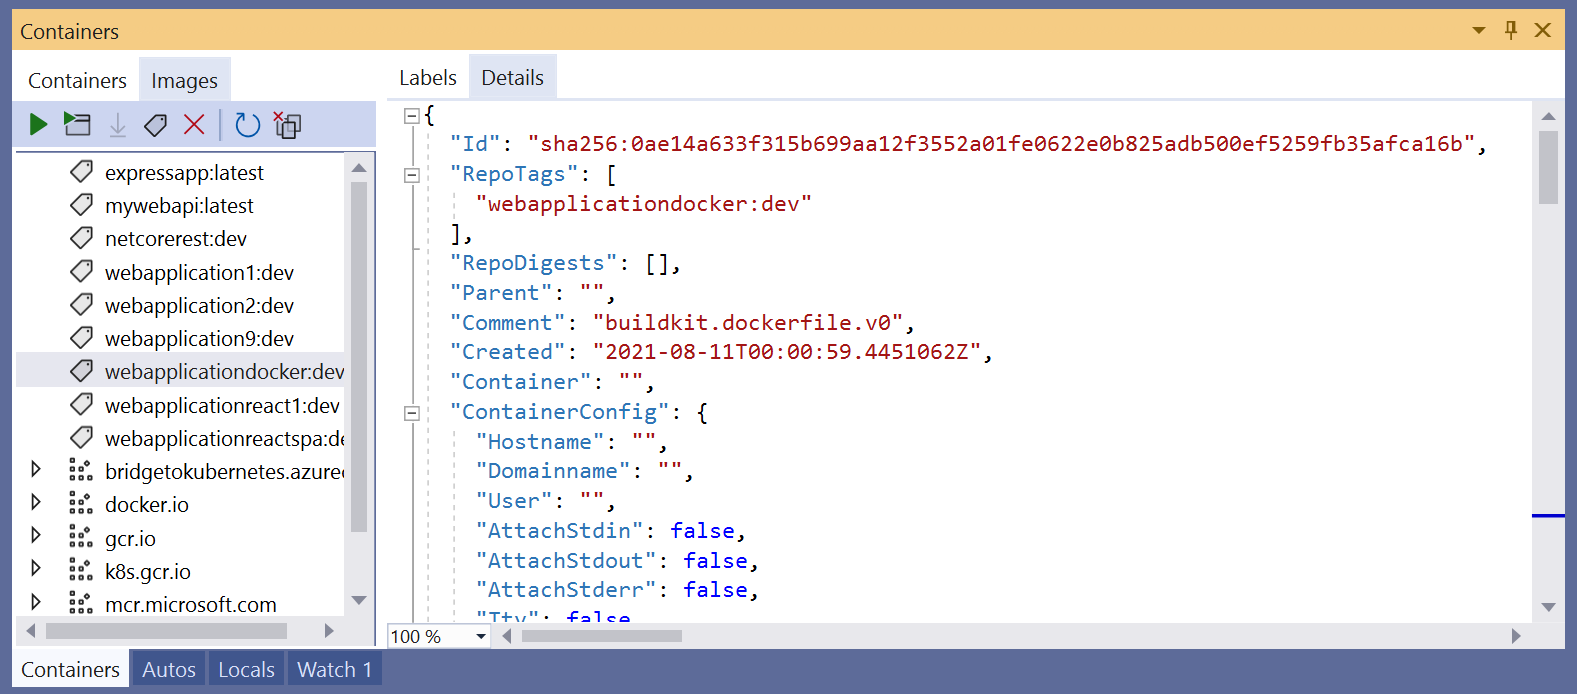
The window has only the tabs applicable to images: Labels and Details. The Details tab shows the configuration details for the image in JSON format.

To remove an image, right-click on the image in the treeview and choose Remove, or select the image, and use the Remove button on the toolbar.
Prune containers and images
You can easily remove containers and images you're not using anymore by using the Prune button on the Containers window toolbar.
You'll be asked to confirm that you want to remove all your unused containers.
When the Images tab is selected, the Prune button will ask if you want to remove all dangling images. Dangling images are images of layers that are no longer associated with a tagged image. Removing them occasionally helps conserve disk space.
Configuration options
The confirmation dialogs for various tasks, such as removing containers and images, or launching more than 10 containers at a time, might be configured. You can disable each prompt by using the checkbox on the dialog. You can also enable or disable these options by using the settings at Tools > Options > Container Tools > Containers Tool Window. See Configure Container Tools.