Note
Access to this page requires authorization. You can try signing in or changing directories.
Access to this page requires authorization. You can try changing directories.
This article describes how to attach the Visual Studio debugger to an ASP.NET Core app running on Azure App Service. The following steps enable you to debug the app as though it's running locally.
Prerequisites
Visual Studio 2022 with the ASP.NET and web development and the Azure development workload installed.
You must first deploy an ASP.NET Core app to Azure App Service (Windows) from Visual Studio, and the app must be running.
Your publish profile in Visual Studio must be set to Debug instead of Release before publishing.
Enable remote debugging
Before you can debug this issue with Visual Studio, you must enable the remote debugging feature on the App Service. This setting allows the Visual Studio debugger to connect to the main App Service web hosting process.
Sign into your own Azure portal.
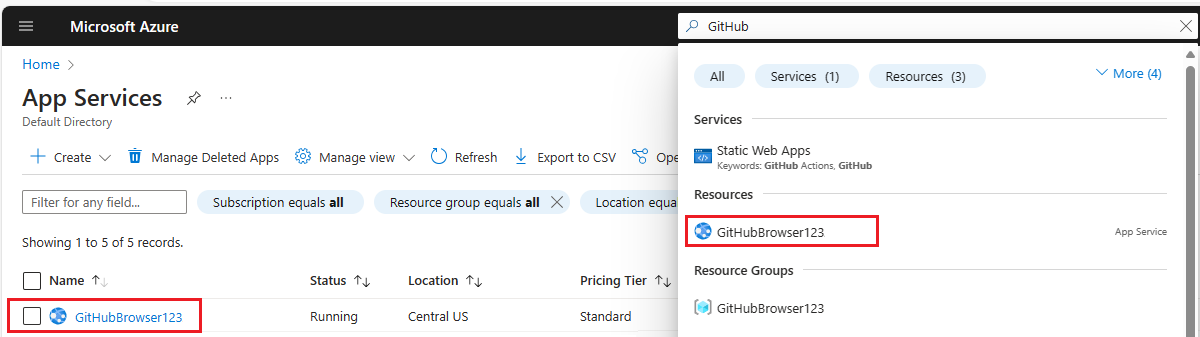
Locate your deployed application in the Azure portal. You can find your app by browsing to the App Services page and then selecting the App Service instance. You can also search for the App Service instance directly by name in the search bar at the top. (In this example, the App Service instance is named GitHubBrowser123.)
On the settings page for the App Service instance, select Configuration on the left navigation, and then choose the General Settings tab.
Towards the bottom of the page, make sure to set the Remote Debugging feature to On and select Visual Studio 2022 as the Remote Visual Studio version.
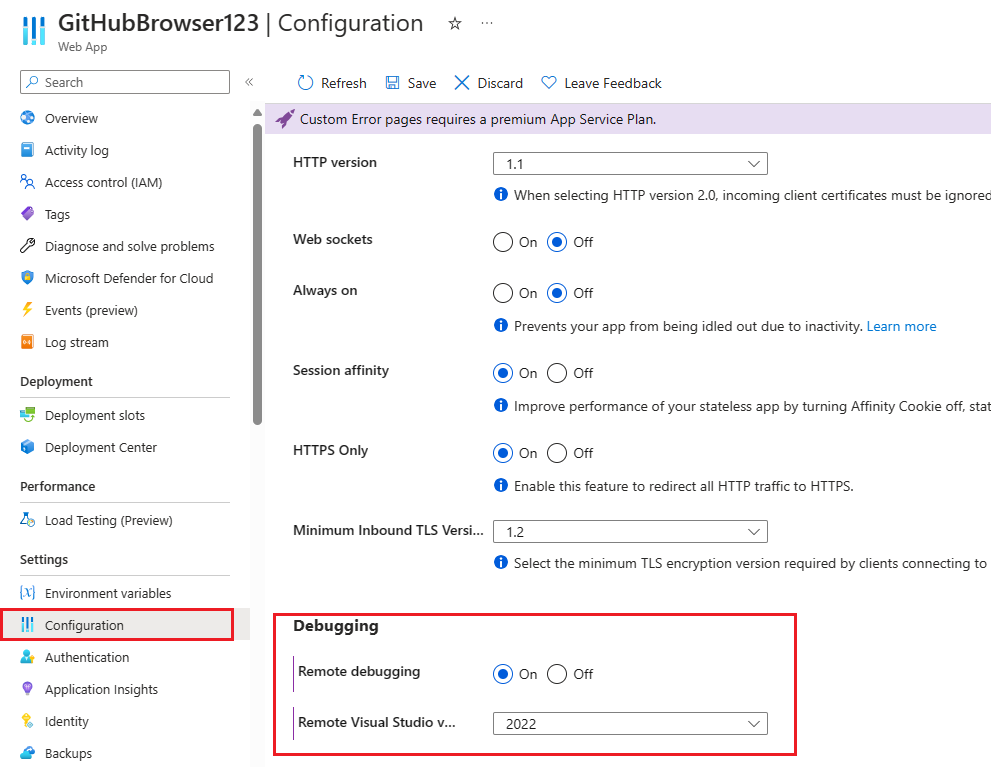
Select Save at the top of the page to persist your changes.


Your app service instance now supports remote debugging through Visual Studio.
Configure debugging settings
Build your app without errors. Stop your app if it's running locally.
Note
Make sure the state of your local code matches what was deployed to Azure. This ensures that the local symbol files and source code line up with the deployed app.
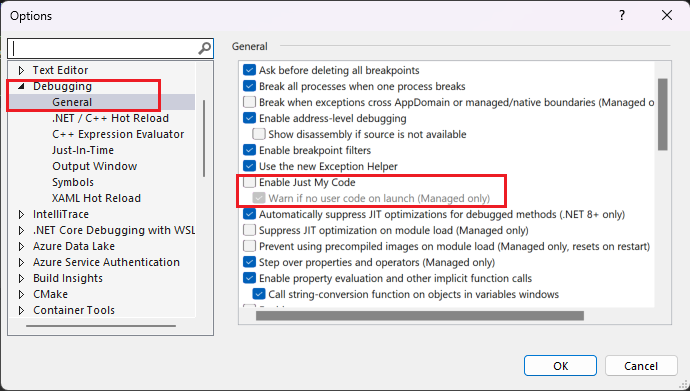
Select Debug > Options from the top Visual Studio menu. Ensure that Enable Just My code is unchecked (as shown in the following illustration), and then select OK.
Changing this setting allows Visual Studio to debug the optimized code that was deployed to Azure using the necessary symbol files from your local bin folder. Symbol files are used by the debugger as a bridge between compiled, executing code and the source code in Visual Studio. Matching symbol files are required for remote debugging.

Attach the debugger to the App Service
From the main menu at the top of Visual Studio, select Debug > Attach to process to open the corresponding dialog. Using this window you can connect and attach to different targets. In this case, you'll connect to the App Service instance you created in the previous step.
Select the Connection Type drop down and choose the Microsoft Azure App Services option.
Select Find.. next to the Connection Target field to open a dialog that allows you to browse your Azure subscriptions and app services.
If you are not already signed in with your Azure subscription, select Find... and then you can sign in.
Locate and select the App Service instance you created in the previous step, and then choose OK.
The
w3wp.exeprocess should appear in the list of available processes to connect to.w3wp.exeis the main process of the Azure App Service that hosts the deployed application. Select thew3wp.exeprocess and then choose Attach in the bottom right.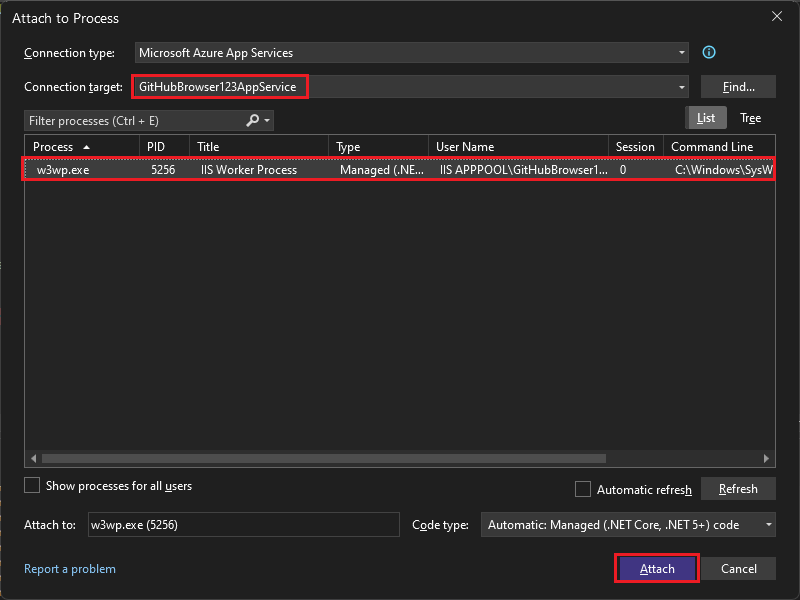
In a C# application file such as
Index.cshtml.cs, set a breakpoint by clicking in the left margin. Alternatively, right-click and choose Breakpoint > Insert breakpoint.In the web app, navigate to the endpoint with the breakpoint. If you're attached to the process but can't hit the breakpoint, make sure your publish profile in Visual Studio is set to a Debug configuration instead of a Release configuration.
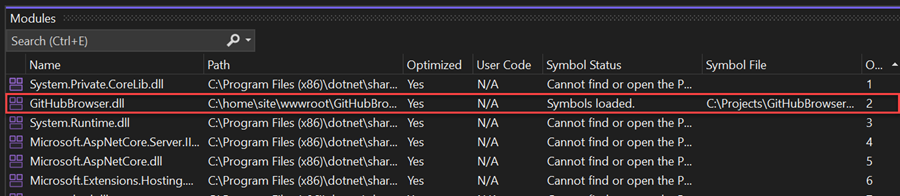
Optional: To verify that Visual Studio has loaded the symbol files for your debugging session. Navigate to Debug > Windows > Modules to open the modules window. This window indicates that the symbol files were successfully loaded after the Just my code configuration changes you made earlier.

Note
For subsequent debugging of the app service, select the select Debug > Reattach to w3wp.exe or use the Shift+Alt+P hot keys.