Note
Access to this page requires authorization. You can try signing in or changing directories.
Access to this page requires authorization. You can try changing directories.
To debug a Visual Studio application on a different computer, install and run the remote tools on the computer where you deploy your app, configure your project to connect to the remote computer from Visual Studio, and then deploy and run your app.

For information about remote debugging Universal Windows Apps (UWP), see Debug an Installed App Package.
Requirements
The remote debugger is supported on Windows 7 and newer and versions of Windows Server starting with Windows Server 2008 Service Pack 2. For a complete list of requirements, see Requirements.
Note
Debugging between two computers connected through a proxy isn't supported. Debugging over a high latency or low bandwidth connection, such as dialup Internet, or over the internet across countries/regions isn't recommended and might fail or be unacceptably slow.
Download and Install the remote tools
On the remote device or server that you want to debug on, rather than the Visual Studio machine, download and install the correct version of the remote tools from the links in the following table.
- Download the most recent update of the remote tools for your version of Visual Studio. Remote tools for Visual Studio 2022 and 2026 can be used with either version of Visual Studio. However, remote tools versions that are earlier than Visual Studio 2022 aren't compatible with later Visual Studio versions. (For example, if you're using Visual Studio 2019, download the latest update of the remote tools for Visual Studio 2019. In this scenario, don't download the remote tools for Visual Studio 2022.)
- Download the most recent update of the remote tools for your version of Visual Studio. Earlier remote tools versions aren't compatible with later Visual Studio versions. (For example, if you're using Visual Studio 2019, download the latest update of the remote tools for Visual Studio 2019. In this scenario, don't download the remote tools for Visual Studio 2022.)
- Download the remote tools with the same architecture as the machine you're installing them on. For example, if you want to debug a 32-bit app on a remote computer running a 64-bit operating system, install the 64-bit remote tools.
- If you're remote debugging an ARM64EC application on an ARM64 device, install the ARM64 remote tools, and then launch the x64 remote debugger that gets installed with those tools. This can be found under: Program Files (x86)\Microsoft Visual Studio<version>\Common7\IDE\Remote Debugger\x64.
| Version | Link | Notes |
|---|---|---|
| Visual Studio 2026 | Remote tools | Compatible with Visual Studio 2022 and later versions. Download the version matching your device operating system (x86, x64 (AMD64), or ARM64). On older versions of Windows Server, see Unblock the file download for help with downloading the remote tools. |
| Visual Studio 2022 | Remote tools | Remote tools for Visual Studio 2022 are available from My.VisualStudio.com. If prompted, join the free Visual Studio Dev Essentials program, or sign in with your Visual Studio subscription ID. Download the version matching your device operating system (x86, x64 (AMD64), or ARM64). On older versions of Windows Server, see Unblock the file download for help with downloading the remote tools. |
| Visual Studio 2019 | Remote tools | Remote tools for Visual Studio 2019 are available from My.VisualStudio.com. If prompted, join the free Visual Studio Dev Essentials program, or sign in with your Visual Studio subscription ID. Download the version matching your device operating system (x86, x64 (AMD64), or ARM64). On older versions of Windows Server, see Unblock the file download for help with downloading the remote tools. |
| Visual Studio 2017 | Remote tools | Remote tools for Visual Studio 2017 are available from My.VisualStudio.com. If prompted, join the free Visual Studio Dev Essentials program, or sign in with your Visual Studio subscription ID. Download the version matching your device operating system (x86, x64 (AMD64), or ARM64). On Windows Server, see Unblock the file download for help with downloading the remote tools. |
| Visual Studio 2015 | Remote tools | Remote tools for Visual Studio 2015 are available from My.VisualStudio.com. If prompted, join the free Visual Studio Dev Essentials program, or sign in with your Visual Studio subscription ID. On Windows Server, see Unblock the file download for help with downloading the remote tools. |
| Visual Studio 2013 | Remote tools | Download page in Visual Studio 2013 documentation |
| Visual Studio 2012 | Remote tools | Download page in Visual Studio 2012 documentation |
| Version | Link | Notes |
|---|---|---|
| Visual Studio 2022 | Remote tools | Compatible with all Visual Studio 2022 versions. Download the version matching your device operating system (x86, x64 (AMD64), or ARM64). On older versions of Windows Server, see Unblock the file download for help with downloading the remote tools. |
| Visual Studio 2019 | Remote tools | Remote tools for Visual Studio 2019 are available from My.VisualStudio.com. If prompted, join the free Visual Studio Dev Essentials program, or sign in with your Visual Studio subscription ID. Download the version matching your device operating system (x86, x64 (AMD64), or ARM64). On older versions of Windows Server, see Unblock the file download for help with downloading the remote tools. |
| Visual Studio 2017 | Remote tools | Remote tools for Visual Studio 2017 are available from My.VisualStudio.com. If prompted, join the free Visual Studio Dev Essentials program, or sign in with your Visual Studio subscription ID. Download the version matching your device operating system (x86, x64 (AMD64), or ARM64). On Windows Server, see Unblock the file download for help with downloading the remote tools. |
| Visual Studio 2015 | Remote tools | Remote tools for Visual Studio 2015 are available from My.VisualStudio.com. If prompted, join the free Visual Studio Dev Essentials program, or sign in with your Visual Studio subscription ID. On Windows Server, see Unblock the file download for help with downloading the remote tools. |
| Visual Studio 2013 | Remote tools | Download page in Visual Studio 2013 documentation |
| Visual Studio 2012 | Remote tools | Download page in Visual Studio 2012 documentation |
You can run the remote debugger by copying msvsmon.exe to the remote computer, rather than installing the remote tools. However, the Remote Debugger Configuration Wizard (rdbgwiz.exe) is available only when you install the remote tools. You may need to use the wizard for configuration if you want to run the remote debugger as a service. For more information, see (Optional) Configure the remote debugger as a service.
Note
- To debug Windows 10 or later apps on ARM devices, use ARM64, which is available with the latest version of the remote tools.
- To debug Windows 10 apps on Windows RT devices, use ARM, which is available only in the Visual Studio 2015 remote tools download.
Tip
In some scenarios, it can be most efficient to run the remote debugger from a file share. For more information, see Run the remote debugger from a file share.
Set up the remote debugger
After you install the remote debugger, follow these steps.
On the remote computer, find and start the Remote Debugger from the Start menu.
If you don't have administrative permissions on the remote computer, right-click the Remote Debugger app and select Run as administrator. Otherwise, just start it normally.
If you are planning to attach to a process which is running as an administrator, or is running under a different user account (such as IIS), right-click the Remote Debugger app and select Run as administrator. For more information, see Run the remote debugger as an administrator.
The first time you start the remote debugger (or before you have configured it), the Remote Debugging Configuration wizard appears.
In most scenarios, select Configure remote debugging.

In most scenarios, choose Next until you get to the Configure the Windows Firewall page of the wizard.

Select at least one network type you want to use the remote tools on. If the computers are connected through a domain, you must choose the first item. If the computers are connected through a workgroup or homegroup, choose the second or third item as appropriate.
Next, select Finish to start the remote debugger.
When configuration is complete, the Remote Debugger window appears.


The remote debugger is now waiting for a connection. Use the server name and port number shown to set the remote connection configuration in Visual Studio.
To stop the remote debugger, select File > Exit. You can restart it from the Start menu, or from the command line:
<Remote debugger installation directory>\msvsmon.exe
Note
If you need to add permissions for more users, change the authentication mode, or port number for the remote debugger, see Configure the remote debugger.
Remote debug a C++ project
In the following procedure, the path of the project is C:\remotetemp, and the name of the remote computer is MySurface.
Create a C++ Console application named CppConsoleApp
Set a breakpoint somewhere in the application that is easily reached, for example in CppConsoleApp.cpp, in the
mainfunction.In Solution Explorer, right-click on the project and select Properties. Open the Debugging tab.
Set the Debugger to launch to Remote Windows Debugger.
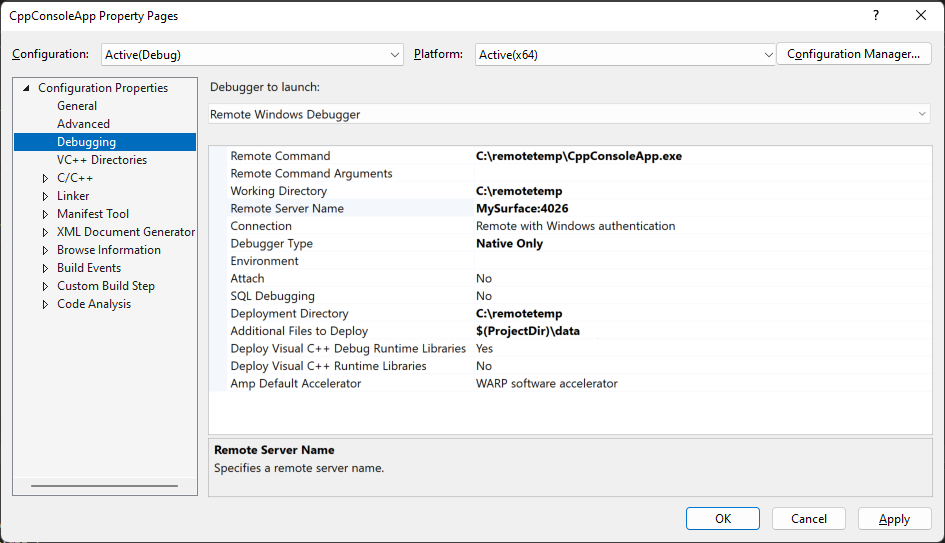
Make the following changes to the properties:
Setting Value Remote Command C:\remotetemp\CppConsoleApp.exe Working Directory C:\remotetemp Remote Server Name MySurface:portnumber Connection Remote with Windows Authentication Debugger Type Native Only Deployment Directory C:\remotetemp Additional Files to Deploy $(ProjectDir)\data If you deploy other folders, and want all the files in a folder deployed to the same folder, specify a folder name.
For more information on the properties, see Project settings for a C++ Debug configuration.
In Solution Explorer, right-click the solution and choose Configuration Manager.
For the Debug configuration, select the Deploy check box.

Start debugging (Debug > Start Debugging, or F5).
The executable is automatically deployed to the remote computer.
If prompted, enter network credentials to connect to the remote machine.
The required credentials are specific to your network's security configuration. For example, on a domain computer, you might choose a security certificate or enter your domain name and password. On a nondomain machine, you might enter the machine name and a valid user account name, like MySurface\name@something.com, along with the correct password.
On the Visual Studio computer, you should see that execution is stopped at the breakpoint.
Tip
Alternatively, you can deploy the files as a separate step. In the Solution Explorer, right-click the project node and then choose Deploy.
If you have noncode files that are required by the application, you can specify them in a semicolon delimited list in Additional Files to Deploy on the Debugger properties page with Remote Windows Debugger selected.
Alternatively, you can include the files in your project, and set the Content property to Yes in the Properties page for each file. These files are copied to the Deployment Directory specified on the Debugger properties page with Remote Windows Debugger selected. You can also change the Item Type to Copy File and specify other properties there if you need the files to be copied to a subfolder of the Deployment Directory.
Set Up Debugging with Remote Symbols
You should be able to debug your code with the symbols you generate on the Visual Studio computer. The performance of the remote debugger is better when you use local symbols.
If you must use remote symbols, you need to specify the remote symbols in Visual Studio by adding a Windows file share to the symbol search path.
Open the Tools > Options pane, expand the All Settings > Debugging > General > Symbols > Search Locations section, and update the Symbol file (.pdb) locations list. Adjust other settings as needed.
Open the Tools > Options dialog, expand the Debugging > General > Symbols section, and update the Symbol file (.pdb) search locations list. Adjust other settings as needed.