Note
Access to this page requires authorization. You can try signing in or changing directories.
Access to this page requires authorization. You can try changing directories.
This article shows how to use different types of breakpoints in Visual Studio to improve debugging efficiency. It covers various scenarios where breakpoints can be applied, such as pausing code execution, logging information, and tracking changes in variable states. The article explains how to set conditional breakpoints, tracepoints, data breakpoints, dependent breakpoints, and temporary breakpoints. It also includes detailed instructions on setting function breakpoints. This guide is essential for developers looking to leverage breakpoints for effective debugging in Visual Studio.
If you're unfamiliar with using breakpoints in Visual Studio, see Get started with breakpoints before going through this article.
For the best experience with this documentation, choose your preferred development language or runtime from the list at the top of the article.
Scenarios
The following table shows common debugging scenarios for breakpoints and the recommended breakpoint type for the scenario.
| Scenario | Description |
|---|---|
| How do I pause running code to inspect a line of code that may contain a bug? | Set a breakpoint. For more information, see Get started with breakpoints. |
| Does my variable have an unexpected value? Or, do I want to inspect my app when it reaches a specific state? | Try a conditional breakpoint to control where and when a breakpoint gets activated by using conditional logic. Right-click on a breakpoint to add conditions. Set the condition to be true when the variable equals the unexpected value. For more information, see Breakpoint conditions. |
| How do I log information to the Output window under configurable conditions without modifying or stopping my code? | Tracepoints allow you to log information to the Output window under configurable conditions without modifying or stopping your code. For more information, see Use tracepoints in the Visual Studio debugger. |
| How do I know when the value of my variable changes? | For C++, set a data breakpoint. For apps using .NET Core 3 and later, you can also set a data breakpoint. Otherwise, for C# and F# only, you can track an object ID with a conditional breakpoint. |
| How do I break execution only if another breakpoint is hit? | Set a Dependent Breakpoint that breaks execution only if another breakpoint is first hit. For more information, see Dependent Breakpoint. |
| Can I hit a breakpoint only once? | Set a temporary breakpoint which lets you break the code only once. For more information, see Temporary Breakpoint. |
| Can I pause code inside a loop at a certain iteration? | Set a Dependent breakpoint that breaks execution only if another breakpoint is first hit. For more information, see Hit count. |
| Can I pause code at the start of a function when I know the function name but not its location? | You can do this with a function breakpoint. For more information, see Set function breakpoints. |
| Can I pause code at the start of multiple functions with the same name? | When you have multiple functions with the same name (overloaded functions or functions in different projects), you can use a function breakpoint. |
Breakpoint actions and tracepoints
A tracepoint is a breakpoint that prints a message to the Output window. A tracepoint can act like a temporary trace statement in the programming language and does not pause the execution of code. You create a tracepoint by setting a special action in the Breakpoint Settings window. For detailed instructions, see Use tracepoints in the Visual Studio debugger.
Breakpoint conditions
You can control when and where a breakpoint executes by setting conditions. The condition can be any valid expression that the debugger recognizes. (For more information about valid expressions, see Expressions in the debugger.)
To set a breakpoint condition:
Right-click the breakpoint symbol and select Conditions (or press Alt + F9, C). Or hover over the breakpoint symbol, select the Settings icon, and then select Conditions in the Breakpoint Settings window.
You can also right-click in the far left margin next to a line of code and select Insert Conditional Breakpoint from the context menu to set a new conditional breakpoint.
You can also set conditions in the Breakpoints window by right-clicking a breakpoint and selecting Settings, and then selecting Conditions


In the dropdown, select Conditional Expression, Hit Count, or Filter, and set the value accordingly.
Select Close or press Ctrl+Enter to close the Breakpoint Settings window. Or, from the Breakpoints window, select OK to close the dialog.
Breakpoints with conditions set appear with a + symbol in the source code and Breakpoints windows.
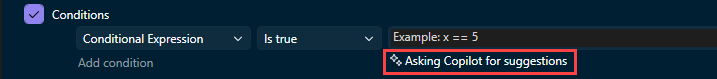
Get AI assistance
If you have Copilot, you can get AI assistance while you're creating a conditional breakpoint. Copilot gives you suggestions for conditional breakpoints and tracepoints that are specific to your code.
For a step-by-step example, see Debug with Copilot.
Get AI assistance
If you have Copilot, you can get AI assistance while you're creating a conditional breakpoint. Copilot gives you suggestions for conditional breakpoints and tracepoints that are specific to your code.

For a step-by-step example, see Debug with Copilot.
Create a conditional expression
When you select Conditional Expression, you can choose between two conditions: Is true or When changed. Choose Is true to break when the expression is satisfied, or When changed to break when the value of the expression has changed.
In the following example, the breakpoint is hit only when the value of testInt is 4:


In the following example, the breakpoint is hit only when the value of testInt changes:


If you set a breakpoint condition with invalid syntax, a warning message appears. If you specify a breakpoint condition with valid syntax but invalid semantics, a warning message appears the first time the breakpoint is hit. In either case, the debugger breaks when it hits the invalid breakpoint. The breakpoint is skipped only if the condition is valid and evaluates to false.
Note
For the When changed field, the debugger doesn't consider the first evaluation of the condition to be a change, so doesn't hit the breakpoint on the first evaluation.
Use Object IDs in conditional expressions (C# and F# only)
There are times when you want to observe the behavior of a specific object. For example, you might want to find out why an object was inserted into a collection more than once. In C# and F#, you can create object IDs for specific instances of reference types, and use them in breakpoint conditions. The object ID is generated by the common language runtime (CLR) debugging services and associated with the object.
To create an Object ID:
Set a breakpoint in the code some place after the object has been created.
Start debugging, and when execution pauses at the breakpoint, select Debug > Windows > Locals (or press Ctrl + Alt + V, L) to open the Locals window.
Find the specific object instance in the Locals window, right-click it, and select Make Object ID.
You should see a $ plus a number in the Locals window. This is the object ID.
Add a new breakpoint at the point you want to investigate; for example, when the object is to be added to the collection. Right-click the breakpoint and select Conditions.
Use the Object ID in the Conditional Expression field. For example, if the variable
itemis the object to be added to the collection, select Is true and type item == $<n>, where <n> is the object ID number.Execution will break at the point when that object is to be added to the collection.
To delete the Object ID, right-click the variable in the Locals window and select Delete Object ID.
Note
Object IDs create weak references, and do not prevent the object from being garbage collected. They are valid only for the current debugging session.
Set a hit count condition
If you suspect that a loop in your code starts misbehaving after a certain number of iterations, you can set a breakpoint to stop execution after that number of hits, rather than having to repeatedly press F5 to reach that iteration.
Under Conditions in the Breakpoint Settings window, select Hit Count, and then specify the number of iterations. In the following example, the breakpoint is set to hit on every other iteration:


Set a filter condition
You can restrict a breakpoint to fire only on specified devices, or in specified processes and threads.
Under Conditions in the Breakpoint Settings window, select Filter, and then enter one or more of the following expressions:
- MachineName = "name"
- ProcessId = value
- ProcessName = "name"
- ThreadId = value
- ThreadName = "name"
Enclose string values in double quotes. You can combine clauses using & (AND), || (OR), ! (NOT), and parentheses.
Set function breakpoints
You can break execution when a function is called. This is useful, for example, when you know the function name but not its location. It is also useful if you have functions with the same name and you want to break on them all (such as overloaded functions or functions in different projects).
To set a function breakpoint:
Select Debug > New Breakpoint > Function Breakpoint, or press Ctrl + K, B.
You can also select New > Function Breakpoint in the Breakpoints window.
In the New Function Breakpoint dialog, enter the function name in the Function Name box.
To narrow the function specification:
Use the fully qualified function name.
Example:
Namespace1.ClassX.MethodA()Add the parameter types of an overloaded function.
Example:
MethodA(int, string)Use the '!' symbol to specify the module.
Example:
App1.dll!MethodAUse the context operator in native C++.
{function, , [module]} [+<line offset from start of method>]Example:
{MethodA, , App1.dll}+2
In the Language dropdown, choose the language of the function.
Select OK.
Set a function breakpoint using a memory address (native C++ only)
You can use the address of an object to set a function breakpoint on a method called by a specific instance of a class. For example, given an addressable object of type my_class, you can set a function breakpoint on the my_method method that instance calls.
Set a breakpoint somewhere after the instance of the class is instantiated.
Find the address of the instance (for example,
0xcccccccc).Select Debug > New Breakpoint > Function Breakpoint, or press Ctrl + K, B.
Add the following to the Function Name box, and select C++ language.
((my_class *) 0xcccccccc)->my_method
Set data breakpoints (.NET Core 3.x or .NET 5+)
Data breakpoints break execution when a specific object's property changes.
To set a data breakpoint:
In a .NET Core or .NET 5+ project, start debugging, and wait until a breakpoint is reached.
In the Autos, Watch, or Locals window, right-click a property and select Break when value changes in the context menu.

Data breakpoints for .NET Core and .NET 5+ won't work for:
- Properties that are not expandable in the tooltip, Locals, Autos, or Watch window
- Static variables
- Classes with the DebuggerTypeProxy Attribute
- Fields inside of structs
For the maximum number that you can set, see Data breakpoint hardware limits.
Set data breakpoints (native C++ only)
Data breakpoints break execution when a value stored at a specified memory address changes. If the value is read but not changed, execution doesn't break.
To set a data breakpoint:
In a C++ project, start debugging, and wait until a breakpoint is reached. On the Debug menu, choose New Breakpoint > Data Breakpoint.
You can also select New > Data Breakpoint in the Breakpoints window or right-click an item in the Autos, Watch, or Locals window and select Break when value changes in the context menu.
In the Address box, type a memory address, or an expression that evaluates to a memory address. For example, type
&avarto break when the contents of the variableavarchanges.In the Byte Count dropdown, select the number of bytes you want the debugger to watch. For example, if you select 4, the debugger will watch the four bytes starting at
&avarand break if any of those bytes change value.
Data breakpoints don't work under the following conditions:
- A process that is not being debugged writes to the memory location.
- The memory location is shared between two or more processes.
- The memory location is updated within the kernel. For example, if memory is passed to the 32-bit Windows
ReadFilefunction, the memory will be updated from kernel mode, so the debugger won't break on the update. - Where the watch expression is larger than 4 bytes on 32-bit hardware and 8 bytes on 64-bit hardware. This is a limitation of the x86 architecture.
Note
Data breakpoints depend on specific memory addresses. The address of a variable changes from one debugging session to the next, so data breakpoints are automatically disabled at the end of each debugging session.
If you set a data breakpoint on a local variable, the breakpoint remains enabled when the function ends, but the memory address is no longer applicable, so the behavior of the breakpoint is unpredictable. If you set a data breakpoint on a local variable, you should delete or disable the breakpoint before the function ends.
Data breakpoint hardware limits
The Windows kernel and the underlying hardware have the following limits when setting data breakpoints. The limit refers to the maximum number of data breakpoints that you can set.
| Processor architecture | Data breakpoint limit |
|---|---|
| x64 and x86 | 4 |
| ARM64 | 2 |
| ARM | 1 |
Set a dependent breakpoint
Dependent breakpoints break execution only if another breakpoint is first hit. So, in a complex scenario such as debugging a multi-threaded application, you can configure the additional breakpoints after another breakpoint is first hit. This can make debugging code in common paths such as game loop or a utility API much easier because a breakpoint in those functions can be configured to enable only if the function is invoked from a specific part of your application.
To set a dependent breakpoint:
Hover over the breakpoint symbol, choose the Settings icon, and then select Only enable when the following breakpoint is hit in the Breakpoint Settings window.
In the dropdown, select the prerequisite breakpoint you want your current breakpoint to be dependent on.
Choose Close or press Ctrl+Enter to close the Breakpoint Settings window. Or, from the Breakpoints window, choose OK to close the dialog.

You can also use the right-click context menu to set the dependent breakpoint.
Right-click in the far left margin next to a line of code and select Insert Dependent Breakpoint from the context menu.

- Dependent breakpoints don't work if there is only a single breakpoint in your application.
- Dependent breakpoints are converted to normal line breakpoint if the prerequisite breakpoint is deleted.
Set a Temporary breakpoint
This breakpoint lets you break the code only once. When debugging, the Visual Studio debugger only pauses the running application once for this breakpoint and then disables it immediately after it has been hit.
To set a temporary breakpoint:
Hover over the breakpoint symbol, choose the Settings icon, and then select Disable breakpoint once hit in the Breakpoint Settings window.
Choose Close or press Ctrl+Enter to close the Breakpoint Settings window. Or, from the Breakpoints window, choose OK to close the dialog.

You can also use the right-click context menu to set the temporary breakpoint.
Right-click in the far left margin next to a line of code and select Insert Temporary Breakpoint from the context menu.

Or, simply use the shortcut F9 + Shift + Alt, T and set the temporary breakpoint on line desired.
Set a dependent breakpoint
Dependent breakpoints break execution only if another breakpoint is first hit. So, in a complex scenario such as debugging a multi-threaded application, you can configure the additional breakpoints after another breakpoint is first hit. This can make debugging code in common paths such as game loop or a utility API much easier because a breakpoint in those functions can be configured to enable only if the function is invoked from a specific part of your application.
To set a dependent breakpoint:
Hover over the breakpoint symbol, choose the Settings icon, and then select Only enable when the following breakpoint is hit in the Breakpoint Settings window.
In the dropdown, select the prerequisite breakpoint you want your current breakpoint to be dependent on.
Choose Close or press Ctrl+Enter to close the Breakpoint Settings window. Or, from the Breakpoints window, choose OK to close the dialog.

You can also use the right-click context menu to set the dependent breakpoint.
Right-click in the far left margin next to a line of code and select Insert Dependent Breakpoint from the context menu.

- Dependent breakpoints don't work if there is only a single breakpoint in your application.
- Dependent breakpoints are converted to normal line breakpoint if the prerequisite breakpoint is deleted.
Set a Temporary breakpoint
This breakpoint lets you break the code only once. When debugging, the Visual Studio debugger only pauses the running application once for this breakpoint and then removes it immediately after it has been hit.
To set a temporary breakpoint:
Hover over the breakpoint symbol, choose the Settings icon, and then select Remove breakpoint once hit in the Breakpoint Settings window.
Choose Close or press Ctrl+Enter to close the Breakpoint Settings window. Or, from the Breakpoints window, choose OK to close the dialog.

You can also use the right-click context menu to set the temporary breakpoint.
Right-click in the far left margin next to a line of code and select Insert Temporary Breakpoint from the context menu.

Or, simply use the shortcut F9 + Shift + Alt, T and set the temporary breakpoint on line desired.