Note
Access to this page requires authorization. You can try signing in or changing directories.
Access to this page requires authorization. You can try changing directories.
Important
Starting with Visual Studio 2022 version 17.9, visualizers can now be written in .NET 6.0+ that run out-of-process using the new VisualStudio.Extensibility model. For extensions created using the new model, see the documentation at Create Visual Studio debugger visualizers instead. If you need to support older versions of Visual Studio or want to ship your custom visualizers as part of a library DLL, then use the information in this article, which applies only to the older model of extension development (VSSDK).
This walkthrough shows how to write a simple visualizer by using C#. The visualizer you create in this walkthrough displays the contents of a string using a Windows Form. This simple string visualizer isn't especially useful in itself, but it shows the basic steps that you must follow to create more useful visualizers for other data types.
Note
The dialog boxes and menu commands you see might differ from those described in Help, depending on your active settings or edition. To change your settings, go to the Tools menu and choose Import and Export Settings. For more information, see Reset settings.
Visualizer code must be placed in a DLL file that the debugger reads. Therefore, the first step is to create a Class Library project for the DLL.
Create a visualizer manually
Complete the following tasks to create a visualizer.
Create a class library project
To create a new class library project, select File > New > Project.
In the language drop-down, select C#.
In the search box, enter class library. Select Class Library (.NET Framework) and then select Next.
In the dialog box, enter the name
MyFirstVisualizer, and then select Create.
For the visualizer project, make sure you select a .NET Framework class library and not .NET. Although the visualizer needs to be .NET Framework, the calling app can be .NET.
After you create the class library, you must add a reference to the Microsoft.VisualStudio.DebuggerVisualizers.DLL file so you can use the classes defined there. Before you add the reference, you must rename some classes to use meaningful names.
Rename Class1.cs and add Microsoft.VisualStudio.DebuggerVisualizers
In Solution Explorer, right-click Class1.cs and select Rename on the context menu.
Change the name from Class1.cs to something meaningful, such as DebuggerSide.cs.
Note
Visual Studio automatically changes the class declaration in DebuggerSide.cs to match the new file name. If you see a prompt to complete the action, select Yes.
In Solution Explorer, right-click References and choose Add Reference on the shortcut menu.
In the Add Reference dialog box, on the Browse tab, select Browse and find the Microsoft.VisualStudio.DebuggerVisualizers.DLL.
You can find the DLL in <Visual Studio Install Directory>\Common7\IDE\PublicAssemblies subdirectory of Visual Studio's installation directory.
Select OK.
In DebuggerSide.cs, add the following to the
usingdirectives:using Microsoft.VisualStudio.DebuggerVisualizers;
Now you're ready to create the debugger-side code. This code runs within the debugger to display the information that you want to visualize. First, you have to change the declaration of the DebuggerSide object to configure inheritance from the base class DialogDebuggerVisualizer.
Inherit from DialogDebuggerVisualizer
In DebuggerSide.cs, go to the following line of code:
public class DebuggerSideChange the code to:
public class DebuggerSide : DialogDebuggerVisualizerAdd an empty constructor so that you can pass to the base class' constructor the serialization policy that will be used to communicate between the visualizer components.
public DebuggerSide() : base(FormatterPolicy.NewtonsoftJson) // or FormatterPolicy.Json
{
}
Note
Due to the security issues described in Special debugger side considerations for .NET 5.0+, starting with Visual Studio 2022 version 17.11, visualizers won't be able to specify the
Legacyformatter policy.DialogDebuggerVisualizerhas one abstract method (Show) that you must override.
Override the DialogDebuggerVisualizer.Show method
In public class DebuggerSide, add the following method:
protected override void Show(IDialogVisualizerService windowService, IVisualizerObjectProvider objectProvider)
{
}
The Show method contains the code that actually creates the visualizer dialog box or other user interface and displays the information that has been passed to the visualizer from the debugger. You must add the code that creates the dialog box and displays the information. In this walkthrough, you use a Windows Forms message box. First, you must add a reference and using directive for System.Windows.Forms.
Add System.Windows.Forms
In Solution Explorer, right-click References and choose Add Reference on the shortcut menu.
In the Add Reference dialog box, on the Browse tab, select Browse, and find the System.Windows.Forms.DLL.
You can find the DLL in C:\Windows\Microsoft.NET\Framework\v4.0.30319.
Select OK.
In DebuggerSide.cs, add the following to the
usingdirectives:using System.Windows.Forms;
Now, you add some code to create and show the user interface for your visualizer. Because this sample is your first visualizer, you can keep the user interface simple and use a Message Box.
Show the Visualizer Output in a dialog box
In the
Showmethod, add the following line of code:MessageBox.Show(objectProvider.GetObject().ToString());This example code doesn't include error handling. You should include error handling in a real visualizer or any other type of application.
On the Build menu, choose Build MyFirstVisualizer. The project should build successfully. Correct any build errors before continuing.
The debugger side code is now complete. There's one more step, however; the attribute that tells the debuggee side which collection of classes comprises the visualizer.
Add the type to visualize for the debuggee-side code
In the debugger-side code, you specify the type to visualize (the object source) for the debuggee using the DebuggerVisualizerAttribute attribute. The Target property sets the type to visualize.
Add the following attribute code to DebuggerSide.cs, after the
usingdirectives but beforenamespace MyFirstVisualizer:[assembly:System.Diagnostics.DebuggerVisualizer( typeof(MyFirstVisualizer.DebuggerSide), typeof(VisualizerObjectSource), Target = typeof(System.String), Description = "My First Visualizer")]On the Build menu, choose Build MyFirstVisualizer. The project should build successfully. Correct any build errors before continuing.
At this point, your first visualizer is finished. If you have followed the steps correctly, you can build the visualizer and install it into Visual Studio. Before you install a visualizer into Visual Studio, however, you should test it to make sure that it runs correctly. You now create a test harness to run the visualizer without installing it into Visual Studio.
Add a Test Method to show the visualizer
Add the following method to class
public DebuggerSide:public static void TestShowVisualizer(object objectToVisualize) { VisualizerDevelopmentHost visualizerHost = new VisualizerDevelopmentHost(objectToVisualize, typeof(DebuggerSide)); visualizerHost.ShowVisualizer(); }On the Build menu, choose Build MyFirstVisualizer. The project should build successfully. Correct any build errors before continuing.
Next, you must create an executable project to call your visualizer DLL. For simplicity, use a Console Application project.
Add a console application project to the solution
In Solution Explorer, right-click the solution, choose Add, and then select New Project.
Choose File > New > Project. In the language drop-down, choose C#. In the search box, type console app, and then choose either Console App (.NET Framework) or Console Application for .NET. Select Next. In the dialog box that appears, type the name
MyTestConsole, and then select Create.
Note
If you want to easily test the visualizer using a test harness, create a .NET Framework console app. You can create a .NET console app instead, but the test harness described later is not yet supported for .NET, so you will need to install the visualizer to test it. For a .NET console app, first create the console app here, add the required DLL and project references, and then follow steps described in Add a debuggee-side data object. For ASP.NET Core scenarios, see Special debugger side considerations for .NET 5.0+.
Now, you must add the necessary references so MyTestConsole can call MyFirstVisualizer.
Add necessary references to MyTestConsole
In Solution Explorer, right-click MyTestConsole and choose Add Reference on the shortcut menu.
In the Add Reference dialog box, open the Browse tab and select Microsoft.VisualStudio.DebuggerVisualizers.DLL.
Select OK.
Right-click MyTestConsole and choose Add Reference again.
In the Add Reference dialog box, open the Projects tab and select MyFirstVisualizer.
Select OK.
Now, you add the code to finish the test harness.
Add code to MyTestConsole
In Solution Explorer, right-click Program.cs and choose Rename on the shortcut menu.
Edit the name from Program.cs to something more meaningful, such as TestConsole.cs.
Note
Visual Studio automatically changes the class declaration in TestConsole.cs to match the new file name.
In TestConsole.cs, add the following code to the
usingdirectives:using MyFirstVisualizer;In method
Main, add the following code:String myString = "Hello, World"; DebuggerSide.TestShowVisualizer(myString);
Now, you're ready to test your first visualizer.
Test the visualizer
In Solution Explorer, right-click MyTestConsole and choose Set as Startup Project on the shortcut menu.
On the Debug menu, choose Start.
The console application starts and the Visualizer appears and displays the string, "Hello, World."
Congratulations. You have built and tested your first visualizer!
If you want to use your visualizer in Visual Studio rather than just calling it from the test harness, you have to install it. For more information, see How to: Install a Visualizer.
Add a debuggee-side data object
In this section, you switch from the System.String data object to a custom data object.
In Solution Explorer, right-click the solution, choose Add, and then select New Project. In the language drop-down, choose C#. In the search box, type class library, and then choose either Class Library (.NET Framework) or Class Library for .NET Standard.
Note
If you are using a .NET Framework test console app, make sure you create a .NET Framework class library project.
Select Next. In the dialog box that appears, type the name
MyDataObject, and then select Create.(.NET Standard class library only) In Solution Explorer, right-click the project and choose Edit Project File. Change the
<TargetFramework>value tonetstandard2.0.<TargetFramework>netstandard2.0</TargetFramework>Inside the
MyDataObjectnamespace, replace the default code with the following code.[Serializable] public class CustomDataObject { public CustomDataObject() { this.MyData = "MyTestData"; } public string MyData { get; set; } }For a read-only visualizer, such as in this example, it isn't necessary to implement methods of VisualizerObjectSource.
Next, update the MyFirstVisualizer project to use the new data object.
In Solution Explorer under the MyFirstVisualizer project, right-click the References node and choose Add Reference.
Under Projects, select the MyDataObject project.
In the attribute code of DebuggerSide.cs, update the Target value, changing
System.StringtoMyDataObject.CustomDataObject.Target = typeof(MyDataObject.CustomDataObject),In the MyFirstVisualizer project, replace the code for the
Showmethod with the following code.var data = objectProvider.GetObject() as MyDataObject.CustomDataObject; // You can replace displayForm with your own custom Form or Control. Form displayForm = new Form(); displayForm.Text = data.MyData; windowService.ShowDialog(displayForm);The preceding code uses a property of the data object to show in the Form's title.
Next, update the console app to use the custom data object.
In Solution Explorer under the MyTestConsole project, right-click the References or Dependencies node, and add a project reference to
MyDataObject.In Program.cs, replace the code in the
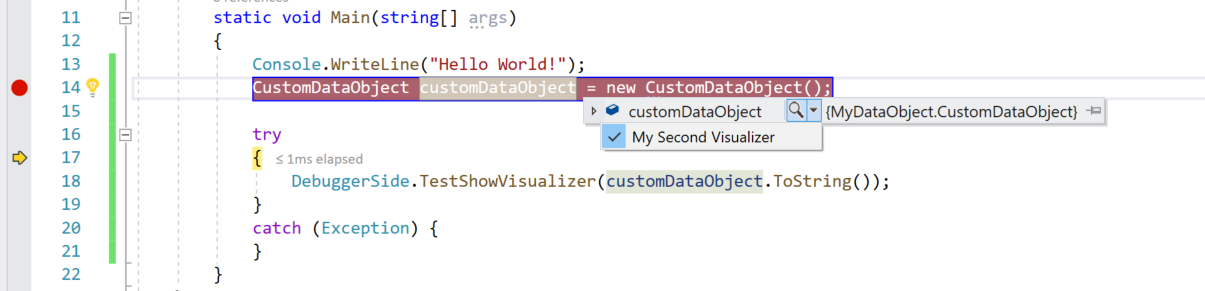
Mainmethod with the following code.// String myString = "Hello, World"; CustomDataObject customDataObject = new CustomDataObject(); DebuggerSide.TestShowVisualizer(customDataObject);(.NET console app) Enclose the call to
TestShowVisualizerin a try-catch statement, since the test harness is unsupported.try { DebuggerSide.TestShowVisualizer(customDataObject); } catch (Exception) { }The console app needs a runtime reference to the visualizer. You can maintain the reference by keeping the preceding code instead of commenting it out.
For a .NET Framework console app, you can run the test harness (press F5), or you can follow instructions in How to: Install a Visualizer.
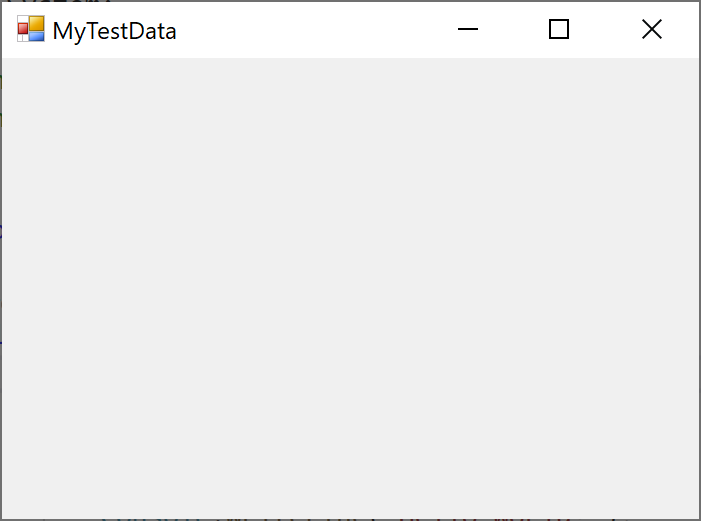
If you run the app using the test harness, the app shows the Windows Form.
For a .NET console app, copy the
MyFirstVisualizer.dlland theMyDataObject.dllto the folders described in How to: Install a Visualizer.After installing the visualizer, set a breakpoint, run the console app, and hover over
customDataObject. If everything is set up correctly, you should see the magnifying glass icon .
.
When you choose MyFirstVisualizer from the magnifying glass, you see the Form with the data object text in the title.